Flow Cytometry vs. Fluorescence Microscopy for Cell Viability: A Definitive Guide for Biomaterial and Drug Development Research
This article provides a comprehensive comparative analysis of flow cytometry (FCM) and fluorescence microscopy (FM) for cell viability assessment, tailored for researchers and drug development professionals.
Flow Cytometry vs. Fluorescence Microscopy for Cell Viability: A Definitive Guide for Biomaterial and Drug Development Research
Abstract
This article provides a comprehensive comparative analysis of flow cytometry (FCM) and fluorescence microscopy (FM) for cell viability assessment, tailored for researchers and drug development professionals. It explores the foundational principles of each technique, detailing their specific methodologies and staining protocols through recent application case studies. The content offers practical troubleshooting and optimization strategies and presents a rigorous, validation-focused comparison based on a seminal 2025 study. By synthesizing performance data on sensitivity, resolution, and throughput, this guide empowers scientists to select the most appropriate, robust, and quantitative method for their specific research context, particularly in challenging systems like particulate biomaterials.
Core Principles: How Flow Cytometry and Fluorescence Microscopy Work
The Fundamental Operating Principle of Flow Cytometry
Flow cytometry represents a cornerstone technology in biomedical research and clinical diagnostics, enabling rapid, multiparameter analysis of individual cells in suspension. Within the context of cell viability assessment, this technique provides unparalleled quantitative precision for distinguishing between live, apoptotic, and dead cell populations within heterogeneous samples. As researchers and drug development professionals increasingly require sophisticated viability metrics beyond simple live/dead dichotomies, understanding the fundamental operating principles of flow cytometry becomes essential for selecting appropriate methodologies and interpreting experimental data accurately.
This guide examines the core technological principles of flow cytometry and objectively compares its performance with fluorescence microscopy for cell viability assessment, supported by experimental data and detailed protocols.
Core Operating Principles
System Components and Their Functions
Flow cytometers operate based on integrated systems working in synchrony:
Fluidics System: Hydrodynamically focuses cells into a single-file stream, ensuring that only one cell at a time passes through the laser interrogation point. This precise cellular alignment is critical for accurate single-cell measurements [1] [2].
Optics System: Comprises lasers as light sources and optical filters that separate specific wavelength ranges. As cells pass through the laser beam, they scatter light and fluorescent probes emit light at characteristic wavelengths [3] [2].
Electronics System: Detects light signals using photomultiplier tubes (PMTs) or other detectors, converts them into digital data, and processes this information for analysis. Modern systems can process thousands of cells per second, generating statistically robust datasets [3] [2].
Signal Detection and Data Generation
As each cell passes through the laser beam, two types of optical signals are generated:
- Light Scatter: Forward-scattered light (FSC) correlates with cell size, while side-scattered light (SSC) indicates cellular complexity/granularity [2].
- Fluorescence Emission: Fluorescently-labeled antibodies or dyes bound to cellular components emit light at specific wavelengths when excited by lasers, enabling quantification of specific markers [2].
The detection system in conventional flow cytometers utilizes optical filters (dichroic mirrors and bandpass filters) to separate and direct light emitted by fluorophores to appropriate detectors. Each detector is tuned to a narrow wavelength band approximating the emission peak of specific fluorophores, implementing a "one detector–one fluorophore" approach [3].
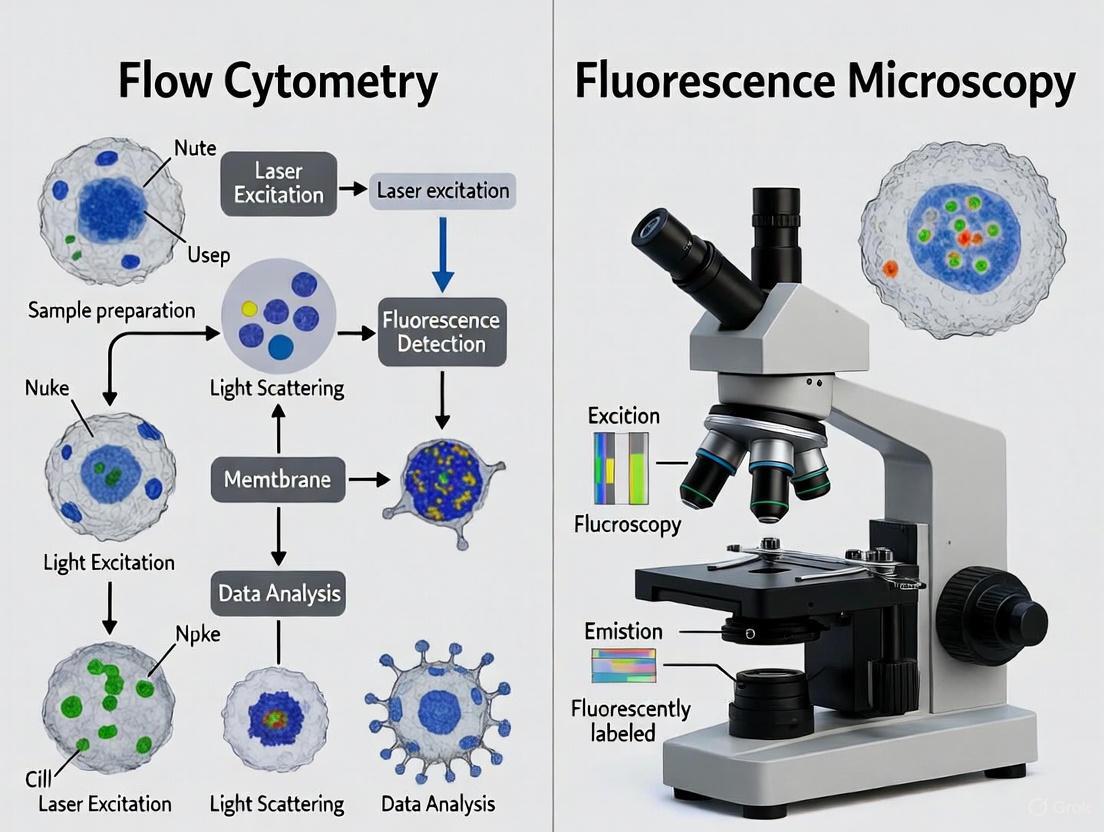
Figure 1: Flow Cytometry Workflow. This diagram illustrates the sequential process from sample introduction to data analysis in flow cytometry.
Comparative Analysis: Flow Cytometry vs. Fluorescence Microscopy
Technical Comparison
Table 1: Technical comparison between flow cytometry and fluorescence microscopy for cell viability assessment
| Feature | Flow Cytometry | Fluorescence Microscopy |
|---|---|---|
| Throughput | High (10,000+ events/second) [1] | Low to medium (manual counting) to automated |
| Data Type | Quantitative fluorescence intensity [1] | Quantitative intensity with morphological context [1] |
| Information Gained | Population statistics, protein expression levels [1] | Morphology, subcellular localization, cell-cell interactions [1] |
| Spatial Context | Lost [1] | Preserved [1] |
| Multiparametric Capacity | High (up to 40+ parameters with spectral systems) [3] | Limited by filter cubes and fluorophore overlap |
| Statistical Power | Excellent for large populations [2] | Limited without automated systems |
Performance in Cell Viability Assessment
Table 2: Comparison of cell viability assessment capabilities between flow cytometry and fluorescence microscopy
| Assessment Aspect | Flow Cytometry | Fluorescence Microscopy |
|---|---|---|
| Viability Staining | Multiparametric staining (e.g., Hoechst, DiIC1, Annexin V-FITC, PI) [4] | Typically FDA/PI or calcein AM/ethidium homodimer [4] |
| Cell Death Discrimination | Can distinguish early apoptosis, late apoptosis, and necrosis [4] | Generally dichotomizes into live/dead [4] |
| Sensitivity | High (detected 0.2% viability with BG particles <38μm) [4] | Lower (detected 9% viability in same conditions) [4] |
| Correlation Between Methods | Strong correlation (r=0.94) with microscopy data [4] | Strong correlation (r=0.94) with flow data [4] |
| Measurement Agreement | Average difference of 1.7-2.7% compared to microscopy [5] | Average difference of 1.7-2.7% compared to flow [5] |
Experimental Protocols for Cell Viability Assessment
Multiparametric Viability Staining Protocol for Flow Cytometry
Application: Detailed assessment of cell health status, discriminating between viable, early apoptotic, late apoptotic, and necrotic populations [4] [6].
Reagents:
- Hoechst 33342 (nuclear stain)
- DiIC1 (mitochondrial membrane potential indicator)
- Annexin V-FITC (phosphatidylserine exposure detection)
- Propidium Iodide (PI) or 7-AAD (membrane integrity assessment) [4] [6]
Procedure:
- Cell Preparation: Harvest cells and wash with cold PBS. Adjust concentration to 1×10ⶠcells/mL in binding buffer.
- Staining:
- Add Hoechst 33342 (1 μg/mL) and incubate 15 minutes at 37°C
- Add DiIC1 (20 nM) and incubate 15 minutes at 37°C
- Add Annexin V-FITC (5 μL/test) and incubate 15 minutes at room temperature in darkness
- Add PI or 7-AAD (5 μL/test) 5 minutes before acquisition
- Data Acquisition: Analyze samples immediately using flow cytometer with appropriate laser configurations [6].
- Analysis:
- Viable cells: Hoechstâº, DiIC1âº, Annexin Vâ», PIâ»
- Early apoptotic: Hoechstâº, DiIC1âº/â», Annexin Vâº, PIâ»
- Late apoptotic: Hoechstâº, DiIC1â», Annexin Vâº, PIâº
- Necrotic: Hoechstâº, DiIC1â», Annexin Vâ», PI⺠[6]
Comparative Viability Assessment Protocol
Application: Direct comparison of flow cytometry and fluorescence microscopy for viability assessment [4] [5].
Reagents:
- Fluorescein diacetate (FDA) or calcein AM (viable cell stain)
- Propidium iodide (PI) or ethidium homodimer-1 (dead cell stain) [4] [5]
Procedure:
- Sample Preparation: Prepare identical cell samples for both analysis methods.
- Staining: Incubate cells with FDA/calcein AM (1-5 μM) and PI/ethidium homodimer-1 (1-5 μg/mL) for 15-30 minutes at 37°C.
- Flow Cytometry Analysis:
- Analyze 10,000-50,000 events per sample
- Use 488nm laser for excitation
- Detect FDA/calcein AM fluorescence at 530/30nm
- Detect PI/ethidium homodimer-1 fluorescence at 610/20nm [4]
- Fluorescence Microscopy Analysis:
- Image multiple fields (minimum 5) with 10-20× objective
- Count at least 1,000 cells total for statistical significance
- Calculate viability as: (FDA⺠cells)/(total cells) × 100 [5]
- Data Correlation: Compare viability percentages between methods using linear regression analysis [4] [5].
Research Reagent Solutions
Table 3: Essential reagents for cell viability assessment in flow cytometry
| Reagent Category | Specific Examples | Function | Application Notes |
|---|---|---|---|
| Vital Dyes | FDA, calcein AM | Esterase activity in viable cells | Cell-permeable, converted to fluorescent product in live cells [4] |
| Membrane Integrity Indicators | Propidium iodide, 7-AAD, ethidium homodimer | DNA binding in membrane-compromised cells | Cell-impermeable, only enter dead cells [4] [7] |
| Apoptosis Detectors | Annexin V conjugates | Binds phosphatidylserine exposed on apoptotic cells | Requires calcium-containing buffer [6] |
| Mitochondrial Function Probes | DiIC1, DiOC₆(3) | Monitor mitochondrial membrane potential | Loss of signal indicates early apoptosis [6] |
| Nuclear Stains | Hoechst 33342, DAPI | Identify nucleated cells | Distinguish cells from debris [6] |
Advanced Technological Developments
Spectral Flow Cytometry
Spectral flow cytometry represents a significant advancement over conventional systems. Instead of using optical filters to direct specific wavelength ranges to individual detectors, spectral cytometers collect the entire emission spectrum of each fluorophore across a wide wavelength range (typically using 32-64 detection channels) [3]. This is achieved through using a prism or diffraction grating to scatter emitted light, which is captured by an array of highly sensitive detectors [3].
Advantages for Viability Assessment:
- Enables resolution of more fluorophores with overlapping spectra
- Improves sensitivity for detecting low-abundance markers
- Simplifies panel design for complex multiparametric viability panels [3]
Imaging Flow Cytometry
Imaging flow cytometry combines the high-throughput capabilities of conventional flow cytometry with the morphological analysis strengths of microscopy. Recent advancements have pushed throughput boundaries, with systems now capable of processing over 1,000,000 events per second while capturing high-resolution images of individual cells [8].
Advantages for Viability Assessment:
- Provides morphological confirmation of apoptotic features (membrane blebbing, nuclear condensation)
- Enables analysis of cell-cell interactions in viability contexts
- Allows visual verification of automated gating strategies [1] [8]
Figure 2: Cytometry Method Selection. This decision diagram guides researchers in selecting the appropriate technology based on their specific research needs.
Flow cytometry operates on the fundamental principles of hydrodynamic focusing, laser interrogation, and multiparametric optical detection, enabling high-throughput, quantitative analysis of cellular characteristics at the single-cell level. For cell viability assessment, it provides superior statistical power, multiparametric discrimination of cell death pathways, and enhanced sensitivity compared to fluorescence microscopy, particularly in detecting subtle cellular changes under cytotoxic stress [4].
While fluorescence microscopy maintains advantages in providing spatial context and morphological detail, the strong correlation between both methods (r=0.94) validates fluorescence microscopy as a viable screening tool when flow cytometry is unavailable [4] [5]. However, for detailed mechanistic studies requiring discrimination between apoptotic stages or for high-throughput drug screening applications, flow cytometry, particularly in its advanced spectral and imaging configurations, offers unparalleled capabilities for comprehensive cell viability assessment.
The choice between these technologies should be guided by specific research requirements, with flow cytometry excelling in quantitative, high-throughput applications, and microscopy providing complementary morphological insights. For the most comprehensive viability assessment, an integrated approach leveraging both technologies often yields the most complete understanding of cellular responses to experimental conditions.
The Basic Working Mechanism of Fluorescence Microscopy
Fluorescence microscopy is an indispensable imaging technique in biomedical research, enabling scientists to visualize specific molecules and structures within cells and tissues with high contrast and specificity. Unlike conventional light microscopy, which relies on the absorption or refraction of light, fluorescence microscopy detects the light emitted by fluorescent molecules after they have been excited by light of a specific wavelength [9] [10]. This fundamental principle allows researchers to distinguish target components against a dark background, making it a powerful tool for applications ranging from basic cell biology to drug development. Within the context of cell viability assessment, understanding the precise working mechanism of fluorescence microscopy is crucial for comparing its capabilities with alternative technologies like flow cytometry.
Fundamental Principles of Fluorescence
At the core of fluorescence microscopy is the physical phenomenon of fluorescence, which involves the absorption and re-emission of light by a fluorophore.
The Jablonski Diagram and Energy States: A Jablonski energy diagram illustrates the electronic transitions involved in fluorescence. When a fluorophore absorbs a photon of light, one of its electrons is elevated to a higher-energy, excited state. This process occurs in femtoseconds (10â»Â¹âµ seconds). The excited electron first rapidly loses a small amount of energy as heat to its environment (vibrational relaxation), settling into the lowest vibrational level of the excited state. The electron then returns to its ground state, emitting a photon of light in the process. The entire event typically occurs within nanoseconds [11] [12] [13].
Stokes Shift: A critical characteristic of fluorescence is the Stokes Shift, which denotes that the emitted light always has a longer wavelength (lower energy) than the excitation light [11] [10] [14]. This energy loss is due to the vibrational relaxation that occurs in the excited state. The magnitude of the Stokes shift is a key property of a fluorophore; a larger shift makes it easier to separate the strong excitation light from the weaker emitted fluorescence, thereby improving image contrast [10] [13].
Excitation and Emission Spectra: Fluorophores do not absorb and emit light at a single wavelength but across a range of wavelengths. The excitation spectrum is a graph showing the relative efficiency of different wavelengths to excite the fluorophore. The emission spectrum shows the range and relative intensity of wavelengths emitted. These spectra often appear as mirror images but with the emission spectrum shifted to longer wavelengths [14]. The peak of these spectra defines the optimal excitation and emission conditions for a given fluorophore.
Core Components of a Widefield Epifluorescence Microscope
The modern epifluorescence microscope (where "epi" means the same objective lens is used for both excitation and emission) is designed to efficiently deliver excitation light to the sample and then isolate the much weaker emitted fluorescence [15] [16] [10]. Its key components work in a coordinated sequence.
Figure 1: The essential light path and component interaction in a widefield epifluorescence microscope. The filter cube (comprising the excitation filter, dichroic mirror, and emission filter) is critical for separating excitation from emission light.
Detailed Component Functions
High-Intensity Light Source: The process begins with a bright light source that emits a broad spectrum of light. Common sources include mercury or xenon arc-discharge lamps, and increasingly, high-power Light Emitting Diodes (LEDs) [15] [17]. Lasers are used in more advanced systems like confocal microscopes.
Excitation Filter: This is an optical filter placed in the light path after the source. It functions as a bandpass filter, allowing only the specific range of wavelengths required to excite the chosen fluorophore to pass through, while blocking other unwanted wavelengths [15] [16] [10].
Dichroic Mirror (Beamsplitter): This is the central, cleverly engineered component of the filter cube. Positioned at a 45-degree angle, the dichroic mirror is an interference filter designed to reflect light below a specific cutoff wavelength and transmit light above it. It reflects the filtered excitation light down through the objective lens onto the specimen [16] [12] [10].
Objective Lens: In epifluorescence microscopy, the objective lens serves a dual purpose. It first acts as a well-corrected condenser, focusing the excitation light onto the sample. Subsequently, it gathers the faint fluorescent light emitted from the specimen [16] [10]. The numerical aperture (NA) of the objective is a key factor determining the resolution and light-gathering ability of the microscope [15].
Emission Filter (Barrier Filter): The fluorescence emission collected by the objective passes back through the dichroic mirror. However, some scattered excitation light may also pass through. The emission filter is a final bandpass filter that blocks any residual excitation light and allows only the desired emission wavelengths to proceed to the detector. This ensures a dark background and a high-contrast fluorescent image [15] [16] [10].
Critical Research Reagents and Staining Methodologies
The utility of fluorescence microscopy hinges on the ability to specifically label target molecules or structures. The table below summarizes key reagents and their functions.
Table 1: Essential Research Reagents for Fluorescence Microscopy
| Reagent Type | Key Examples | Primary Function in Experimentation |
|---|---|---|
| Immunofluorescence Labels | FITC, TRITC, Alexa Fluor dyes (e.g., 488, 568) [15] | Antibody-conjugated organic dyes used for highly specific tagging of proteins in fixed cells and tissues [15] [17]. |
| Fluorescent Proteins | GFP, eGFP, mCherry, BFP [15] | Genetically encoded tags for real-time visualization of protein localization, dynamics, and expression in live cells [15] [17]. |
| Nucleic Acid Stains | DAPI, Hoechst [15] [17] | Small molecules that bind DNA, used for labeling cell nuclei in both live and fixed samples. |
| Organelle-Tracking Dyes | MitoTracker, LysoTracker [18] | Cell-permeant dyes that selectively accumulate in specific organelles, enabling live-cell imaging of structures like mitochondria and lysosomes. |
| Ion Indicators (Chelators) | Fura-2, Indo-1 [18] | Dyes whose fluorescence intensity or spectral properties change with the concentration of specific ions (e.g., Ca²âº), allowing dynamic monitoring of ion fluxes. |
| Antifade Reagents | p-phenylenediamine, DABCO [11] [13] | Compounds added to mounting media to reduce photobleaching (fading), thereby preserving fluorescence signal intensity during prolonged observation. |
Standard Immunofluorescence Protocol
A foundational experimental protocol for visualizing a specific protein in fixed cells involves immunofluorescence [18] [17]:
- Sample Fixation: Cells or tissues are fixed (e.g., with paraformaldehyde) to preserve morphology and immobilize antigens.
- Permeabilization: A detergent (e.g., Triton X-100) is applied to permeabilize cell membranes, allowing antibodies access to intracellular targets.
- Blocking: Incubation with a protein solution (e.g., Bovine Serum Albumin) to block non-specific antibody binding sites.
- Primary Antibody Incubation: The sample is incubated with an unlabeled antibody specific to the target protein.
- Secondary Antibody Incubation: A fluorophore-conjugated antibody, which recognizes and binds to the primary antibody, is applied. This indirect method amplifies the signal and offers flexibility.
- Mounting and Visualization: The sample is mounted on a slide with an antifade reagent and imaged under the fluorescence microscope using filter sets matched to the fluorophore.
Comparison of Fluorescence Microscopy Modalities
While the basic widefield microscope is powerful, it captures light from the entire specimen, including out-of-focus regions, which can blur the image. Several advanced modalities have been developed to overcome this and other limitations.
Table 2: Comparison of Key Fluorescence Microscopy Techniques
| Microscopy Technique | Basic Principle | Key Advantages | Primary Limitations | Suitability for Cell Viability |
|---|---|---|---|---|
| Widefield Epifluorescence | Entire field of view is illuminated at once [15]. | Simple, fast, cost-effective; ideal for thin samples and quick screening [15]. | Out-of-focus light reduces contrast and resolution in thick samples [15]. | High throughput but limited to 2D or thin samples; prone to phototoxicity. |
| Laser Scanning Confocal | A laser scans a single point; a pinhole rejects out-of-focus light [15] [12]. | High-resolution optical sectioning; enables 3D reconstruction of thick specimens [15] [9]. | Slower imaging; expensive; high-intensity lasers can cause significant photobleaching and phototoxicity [9]. | Excellent for 3D morphology in fixed cells; phototoxicity a concern for long-term live-cell viability studies. |
| Multiphoton (Two-Photon) | Near-simultaneous absorption of two long-wavelength photons for excitation [12] [9]. | Deeper tissue penetration; reduced phototoxicity and out-of-focus bleaching outside the focal plane [12] [9]. | Very expensive due to requirement for pulsed infrared lasers [9]. | Superior for long-term imaging of cell viability in thick tissues (e.g., live brain slices, spheroids). |
| Total Internal Reflection (TIRF) | Uses an evanescent field to excite fluorophores only within ~100 nm of the coverslip [9]. | Extremely high signal-to-noise ratio for imaging processes at the cell membrane [9]. | Limited to surface-associated events. | Ideal for studying exocytosis/endocytosis, adhesion dynamics in live cells with minimal background. |
Limitations and Considerations for Cell Viability Research
When applying fluorescence microscopy for cell viability assessment, several technical constraints must be considered:
- Photobleaching: The irreversible destruction of fluorophores under prolonged or intense illumination, leading to signal loss [11] [17]. This can be mitigated with antifade reagents and by minimizing light exposure [11] [13].
- Phototoxicity: The generation of reactive chemical species during fluorescence excitation can damage cellular components and compromise viability, a critical concern in live-cell imaging [17]. Using longer-wavelength light (e.g., in multiphoton microscopy), lower light intensities, and more sensitive detectors can reduce this effect [12].
- Indirect Measurement: Fluorescence microscopy typically reveals the location of a labeled component but not the viability state directly. Viability is inferred using dyes that indicate membrane integrity (e.g., propidium iodide) or enzymatic activity, which may require careful interpretation and control experiments.
The basic working mechanism of fluorescence microscopy—founded on the principles of Stokes shift and the precise optical separation of excitation and emission light—makes it an exceptionally powerful tool for spatial and functional analysis in biological research. Its versatility, driven by a vast toolkit of fluorescent reagents and specialized modalities, allows researchers to visualize everything from single molecules to dynamic processes in living organisms. In the specific context of cell viability assessment, while techniques like widefield microscopy offer high-speed screening, confocal and multiphoton microscopy provide the 3D resolution and reduced phototoxicity necessary for rigorous, long-term investigation of living systems. A deep understanding of this mechanism and its associated technologies is fundamental for designing robust experiments and for making an informed comparison with high-throughput but lower-resolution techniques like flow cytometry.
In the field of cell biology and biomaterial research, the choice of analytical technique profoundly influences the type and quality of data obtained. Two dominant paradigms have emerged: high-throughput analysis, characterized by its ability to rapidly quantify large cell populations, and spatial localization, which preserves and analyzes the architectural context of cells within their native environment. Flow cytometry epitomizes the high-throughput approach, enabling rapid, single-cell quantification of multiple parameters across thousands of cells per second. In contrast, fluorescence microscopy provides detailed spatial context, allowing researchers to visualize subcellular structures, cell-to-cell interactions, and morphological features within intact samples. This guide objectively compares these methodologies within the specific context of cell viability assessment, providing researchers with the experimental data and methodological insights needed to select the appropriate tool for their research objectives.
The fundamental distinction lies in what each technique optimizes for: flow cytometry excels in statistical power and multiparametric quantification of cell populations in suspension, while fluorescence microscopy preserves spatial relationships and morphological detail in situ. This trade-off between throughput and contextual information frames the comparative landscape, influencing applications from basic research to preclinical drug development and biomaterial safety testing [19] [4].
Technical Comparison: Capabilities and Limitations
Table 1: Core Technical Characteristics of Flow Cytometry and Fluorescence Microscopy
| Feature | Flow Cytometry | Fluorescence Microscopy |
|---|---|---|
| Throughput | High (thousands of cells/second) | Low to Moderate (limited by field of view) |
| Spatial Context | Lost (cells in suspension) | Preserved (cells in situ) |
| Primary Output | Quantitative population data | Qualitative images & morphometric data |
| Multiplexing Capacity | High (10+ parameters simultaneously) | Moderate (limited by spectral overlap) |
| Key Strength | Statistical significance, subpopulation discrimination | Cellular morphology, localization, integrity |
| Primary Limitation | No spatial information, requires single-cell suspension | Lower throughput, potential observer bias |
| Automation Potential | High | Moderate (especially with automated stages) |
Table 2: Quantitative Performance in a Direct Comparative Viability Study [19] [4]
| Experimental Condition | Viability via Fluorescence Microscopy (FDA/PI) | Viability via Flow Cytometry (Multiparametric Staining) |
|---|---|---|
| Control Cells | >97% | >97% |
| <38 µm BG, 100 mg/mL, 3h | 9% | 0.2% |
| <38 µm BG, 100 mg/mL, 72h | 10% | 0.7% |
| Data Correlation | Strong correlation (r = 0.94, R² = 0.8879, p < 0.0001) | |
| Additional Data | Live/Dead distinction only | Distinction of viable, early apoptotic, late apoptotic, and necrotic populations |
The data from a direct comparative study on bioactive glass (BG) cytotoxicity reveals a strong correlation between the two techniques, validating both for viability assessment. However, flow cytometry demonstrated superior sensitivity and precision, particularly under high cytotoxic stress, detecting drastically lower viability percentages than fluorescence microscopy. This is attributed to its ability to analyze every cell in a sample and its more precise discrimination of dim fluorescence signals. Furthermore, flow cytometry's multiparametric capacity provided a deeper mechanistic insight by distinguishing between early and late apoptosis and necrosis, whereas microscopy primarily offered a binary live/dead classification [19] [4].
Beyond standard flow cytometry, spectral flow cytometry represents a significant advancement. Unlike conventional flow cytometry, which measures peak emissions with limited detectors, spectral cytometry uses multiple detectors to capture the full emission spectrum for each fluorochrome. This allows for superior unmixing of dyes with highly overlapping spectra, enabling the use of more parameters in a single panel and improving resolution by characterizing and subtracting cellular autofluorescence [20].
Similarly, fluorescence microscopy is evolving. New techniques like Super-resolution Panoramic Integration (SPI) microscopy overcome traditional diffraction limits, enabling instant generation of sub-diffraction images with a twofold resolution enhancement (~120 nm) while maintaining high-throughput capabilities, imaging thousands of cells per second. This bridges the gap between the high resolution of traditional microscopy and the need for population-level analysis [21].
Experimental Protocols for Cell Viability Assessment
Flow Cytometry Protocol for Multiparametric Viability and Death Mechanism Analysis
This protocol leverages the high-throughput, multi-parameter capabilities of flow cytometry to not only determine viability but also to distinguish the mechanism of cell death, which is crucial for understanding material cytotoxicity or drug mechanisms [19].
- 1. Cell Preparation and Staining: Harvest and wash cells. Resuspend the cell pellet in a suitable buffer. For a comprehensive view, stain with a cocktail of fluorescent probes. A typical panel includes:
- Hoechst 33342: A cell-permeant DNA stain that labels all nucleated cells, allowing for the identification of the entire cell population.
- Annexin V-FITC: Binds to phosphatidylserine (PS), which is externalized to the outer leaflet of the plasma membrane during early apoptosis.
- Propidium Iodide (PI) or other cell-impermeant DNA stain: Enters cells with compromised plasma membranes, marking late apoptotic and necrotic cells.
- 2. Incubation and Analysis: Incubate the stained cells according to the specific requirements of each dye (typically 15-20 minutes at room temperature, protected from light). Analyze the cells immediately on a flow cytometer. A minimum of 10,000 events per sample is recommended for robust statistics.
- 3. Data Gating and Interpretation:
- Gate on the Hoechst-positive population to exclude debris.
- Create a dot plot of Annexin V-FITC vs. PI.
- Viable cells are Annexin V-negative/PI-negative.
- Early apoptotic cells are Annexin V-positive/PI-negative.
- Late apoptotic cells are Annexin V-positive/PI-positive.
- Necrotic cells are Annexin V-negative/PI-positive (though this can vary depending on the timing of membrane rupture).
Fluorescence Microscopy Protocol for Live/Dead Viability Staining
This protocol is ideal for visualizing cell death in situ, allowing for the observation of morphological changes and spatial patterns of cytotoxicity [19] [22].
- 1. Sample Preparation: Culture cells directly on glass-bottom dishes or coverslips, especially when testing biomaterials or surface treatments.
- 2. Staining: Prepare a working solution of viability stains in culture medium or buffer. A common combination is:
- Fluorescein Diacetate (FDA): A cell-permeant, non-fluorescent compound that is converted by intracellular esterases into fluorescent fluorescein, retained only in live cells.
- Propidium Iodide (PI): As above, it labels the nuclei of dead cells.
- 3. Incubation and Imaging: Replace the culture medium with the staining solution and incubate for a short period (e.g., 5-15 minutes at 37°C). Image the cells immediately using a fluorescence microscope with appropriate filter sets for FITC (green, for FDA) and TRITC/Texas Red (red, for PI).
- 4. Image Analysis: Acquire multiple, random fields of view to minimize sampling bias. Count or use image analysis software to quantify the number of green (live) and red (dead) cells. Viability is calculated as the percentage of live cells from the total counted cells.
Diagram 1: Flow cytometry multiparametric viability analysis workflow.
The Scientist's Toolkit: Essential Reagents and Materials
Table 3: Key Reagents for Cell Viability Assessment [22]
| Reagent Name | Function / Mechanism | Compatible Platform(s) | Key Characteristics |
|---|---|---|---|
| Propidium Iodide (PI) | DNA-binding dead cell stain; membrane integrity. | FC, FM | Cell-impermeant; red fluorescence upon DNA binding. |
| 7-AAD | DNA-binding dead cell stain; membrane integrity. | FC, FM | Cell-impermeant; used in cell cycle and chromosome studies. |
| SYTOX Green/Blue/Orange | DNA-binding dead cell stain; membrane integrity. | FC, FM, M | Non-fluorescent in solution; bright upon DNA binding; no wash step. |
| Annexin V (FITC, etc.) | Binds phosphatidylserine exposed on apoptotic cells. | FC, FM | Marker for early apoptosis; requires calcium buffer. |
| Hoechst 33342 | Cell-permeant DNA stain; labels all nucleated cells. | FC, FM | Labels all cells; used for population gating and total cell count. |
| Fluorescein Diacetate (FDA) | Converted to fluorescent fluorescein by live cell esterases. | FM | Metabolic activity marker for live cells. |
| LIVE/DEAD Fixable Viability Stains | Amine-reactive dye; dim in live cells, bright in dead cells. | FC | Fixable; allows sample fixation post-staining. |
| Image-iT DEAD Green | Membrane integrity dead cell stain. | FC, FM | Green-fluorescent; fixable. |
| FDGal | FDGal | 2-[18F]FDGal for quantitative liver function PET/CT studies. For Research Use Only (RUO). Not for diagnostic or therapeutic procedures. | Bench Chemicals |
| Erbon | Erbon, CAS:136-25-4, MF:C11H9Cl5O3, MW:366.4 g/mol | Chemical Reagent | Bench Chemicals |
FC = Flow Cytometry, FM = Fluorescence Microscopy, M = Microplate Assay
Diagram 2: Technique selection workflow for viability analysis.
The comparative analysis between high-throughput flow cytometry and spatial localization via fluorescence microscopy reveals that the choice is not a matter of which technique is universally superior, but which is more appropriate for the specific research question. Flow cytometry provides unmatched statistical power, sensitivity, and detailed mechanistic classification of cell death, making it ideal for screening applications and quantifying subtle population changes. Fluorescence microscopy, meanwhile, offers indispensable spatial context and morphological detail, crucial for understanding cell-material interactions, tissue architecture, and localized effects.
The future of cellular analysis lies in the convergence of these paradigms. Technologies like imaging flow cytometry combine the high-throughput, multiparametric strength of flow cytometry with the morphological information of microscopy, allowing for the identification of distinct spatial configurations of proteins like CAR in T cells directly from a heterogeneous sample [23]. Similarly, advancements in spatial proteomics and transcriptomics are pushing microscopy toward more multiplexed, high-content analysis, enabling the mapping of dozens to hundreds of biomarkers within their native tissue architecture [24] [25]. For the most comprehensive understanding, many sophisticated research workflows now integrate both techniques, using microscopy for initial spatial observation and flow cytometry for deep, quantitative validation.
Flow Cytometry (FCM) and Fluorescence Microscopy (FM) are foundational techniques in cell viability assessment, yet they generate fundamentally different types of data. FCM provides high-throughput, multi-parametric statistical data for thousands of cells, offering robust quantitative analysis. In contrast, FM produces high-resolution visual images that preserve the spatial context and morphology of cells. Understanding the strengths, limitations, and appropriate applications of each method is crucial for researchers in biomaterial science and drug development. This guide objectively compares their performance using recent experimental data.
Quantitative Data Comparison
A direct comparative study investigating the cytotoxicity of Bioglass 45S5 (BG) on SAOS-2 osteoblast-like cells provides clear performance metrics for both techniques [19] [4]. The following tables summarize the key quantitative findings.
Table 1: Cell Viability Outcomes Measured by FCM and FM
| Particle Size | Concentration (mg/mL) | Time (h) | Viability by FM (%) | Viability by FCM (%) |
|---|---|---|---|---|
| < 38 µm | 100 | 3 | 9 | 0.2 |
| < 38 µm | 100 | 72 | 10 | 0.7 |
| Controls (Various) | N/A | 3 & 72 | > 97 | > 97 |
Table 2: Correlation of Techniques and Key Differentiating Features
| Parameter | Findings |
|---|---|
| Statistical Correlation | Strong correlation between FM and FCM data (r = 0.94, R² = 0.8879, p < 0.0001) [19]. |
| Cell Death Differentiation | FM: Distinguishes viable and non-viable cells [19].FCM: Classifies viable, early apoptotic, late apoptotic, and necrotic populations [19] [4]. |
| Precision | FCM demonstrated superior precision, particularly under high cytotoxic stress [19]. |
Detailed Experimental Protocols
The data presented in the tables above were generated under controlled and identical experimental conditions to ensure a fair comparison [19] [4].
Cell Culture and Treatment
- Cell Line: Human SAOS-2 osteoblast-like cells were used due to their robust osteogenic phenotype [19].
- Test Material: Bioglass 45S5 (BG) particles were used to induce a gradient of cytotoxic stress.
- Experimental Conditions: Cells were exposed to BG particles of three size ranges (< 38 µm, 63–125 µm, and 315–500 µm) at concentrations of 25, 50, and 100 mg/mL for 3 and 72 hours [19].
Fluorescence Microscopy (FM) Protocol
- Staining: Cells were stained with Fluorescein Diacetate (FDA) and Propidium Iodide (PI). FDA is metabolized by live cells to produce green fluorescence, while PI enters dead cells with compromised membranes and intercalates into DNA, producing red fluorescence [19] [4].
- Imaging & Analysis: Stained cells were visualized using a conventional widefield fluorescence microscope. Viability was determined by manually or digitally counting cells exhibiting green (viable) versus red (non-viable) fluorescence [19]. This process is labor-intensive and can be subject to sampling bias, as only a few fields of view are analyzed [19].
Flow Cytometry (FCM) Protocol
- Staining: A multiparametric staining panel was employed, including:
- Hoechst: Stains DNA for general cell identification and gating.
- DiIC1: A lipophilic cationic dye that accumulates in the mitochondria of live cells.
- Annexin V-FITC: Binds to phosphatidylserine (PS) exposed on the outer leaflet of the cell membrane during early apoptosis.
- Propidium Iodide (PI): As above, indicating late apoptosis or necrosis when the cell membrane is compromised [19] [4].
- Analysis: The single-cell suspension was hydrodynamically focused and passed through a laser beam. The scattered and fluorescent light signals from each cell were detected and quantified [19] [26]. This allows for the automated, high-throughput classification of thousands of cells per second into distinct viability states based on their staining profile [19].
Workflow and Technique Comparison
The following diagram illustrates the logical relationship between the core functions of each technique and the type of data they generate, highlighting their complementary nature.
Research Reagent Solutions
The execution of these protocols relies on specific reagents and materials. The table below details key solutions used in the featured experiments.
Table 3: Essential Research Reagents for Cell Viability Assays
| Reagent/Material | Function/Description | Example Application |
|---|---|---|
| Propidium Iodide (PI) | A red-fluorescent DNA intercalator that is excluded by viable cells. Used to label dead cells [19] [4]. | A standard component in live/dead staining kits for both FCM and FM [19]. |
| Fluorescein Diacetate (FDA) | A cell-permeant esterase substrate. Metabolized in live cells to produce green fluorescence [4]. | Used in FM for visual identification of viable cells [19] [4]. |
| Annexin V-FITC | Binds to phosphatidylserine (PS) exposed on the cell surface during early apoptosis. Requires co-staining with PI for viability context [19]. | Enables FCM to distinguish early apoptotic (Annexin V+/PI-) from late apoptotic/necrotic (Annexin V+/PI+) cells [19]. |
| Hoechst Stains | Cell-permeant blue-fluorescent nucleic acid stains. Used for general cell counting and gating in FCM [19]. | Helps identify and select the entire cell population in complex FCM plots [19]. |
| Antifade Mounting Media | Reagents that minimize photobleaching of fluorophores during microscopy by inhibiting reactive oxygen species [27]. | Critical for preserving fluorescence signal in FM samples (e.g., ProLong Gold, SlowFade Gold) [27]. |
Protocols in Practice: Staining, Assays, and Real-World Applications
In the field of biomaterial research and preclinical cytotoxicity assessment, accurately determining cell viability is a fundamental requirement. Among the various techniques available, fluorescence microscopy (FM) and flow cytometry (FCM) have emerged as two prominent methods, each employing distinct staining methodologies to differentiate between live and dead cells [19]. The selection of an appropriate staining panel directly influences the accuracy, depth, and reliability of the viability data obtained. This guide provides a detailed, objective comparison between two standard staining approaches: the FDA/PI (Fluorescein Diacetate/Propidium Iodide) panel conventionally used with Fluorescence Microscopy, and the multiparametric staining panels (e.g., Hoechst, DiIC1, Annexin V-FITC, PI) designed for Flow Cytometry. Understanding the principles, applications, and performance characteristics of these staining panels is crucial for researchers, scientists, and drug development professionals to optimize their experimental designs and correctly interpret cellular responses to cytotoxic stimuli, such as those induced by particulate biomaterials [19] [4].
Staining Panel Specifications and Mechanisms
The core difference between these staining panels lies in their complexity and the breadth of information they deliver. The FDA/PI panel offers a fundamental live/dead distinction, whereas the multiparametric FCM panel enables a detailed dissection of cell death pathways.
FDA/PI Staining for Fluorescence Microscopy
The FDA/PI staining panel is a widely adopted two-color assay for direct visualization of cell viability.
- Viable Cells (FDA): Fluorescein diacetate (FDA) is a non-fluorescent, cell-permeant compound. Once inside a viable cell, intracellular esterases cleave the acetate groups, converting it to fluorescein, a green-fluorescent compound (typically excited at ~488 nm and emitting at ~530 nm) that is retained in cells with intact plasma membranes [4].
- Non-Viable Cells (PI): Propidium iodide (PI) is a red-fluorescent nucleic acid stain (excitation maximum ~535 nm, emission maximum ~617 nm) that is impermeant to live cells. It only enters cells with compromised plasma membranes, binding to DNA and RNA [28].
This mechanism allows for a straightforward binary classification where green fluorescence indicates viability and red fluorescence indicates cell death, visualized directly via the fluorescence microscope.
Multiparametric Staining for Flow Cytometry
Advanced flow cytometry utilizes panels with multiple fluorescent markers to provide a nuanced view of cell status. A representative panel, as used in a recent comparative study, includes Hoechst, DiIC1, Annexin V-FITC, and PI [19] [4].
- Viable Cells (Hoechst & DiIC1): Hoechst stains DNA in all cells and is often used for gating. DiIC1 is a carbocyanine dye that accumulates in the mitochondria of cells with active membrane potentials, serving as an indicator of metabolic activity and early viability [19].
- Early Apoptotic Cells (Annexin V-FITC): Annexin V is a protein that binds to phosphatidylserine (PS). In viable cells, PS is located on the inner leaflet of the plasma membrane. During early apoptosis, PS is translocated to the outer leaflet, where it can be stained by Annexin V conjugated to FITC (green fluorescence), while the membrane remains intact, excluding PI [4].
- Late Apoptotic/Necrotic Cells (Annexin V-FITC & PI): In late apoptosis and necrosis, the cell membrane becomes permeable, allowing PI (red fluorescence) to enter and stain the nucleic acids. Cells that stain positive for both Annexin V and PI are typically classified as late apoptotic or necrotic [19] [4].
This multi-parameter approach enables the classification of cells into viable, early apoptotic, late apoptotic, and necrotic populations.
The following diagram illustrates the experimental workflow for both staining methods, from sample preparation to final analysis.
Comparative Experimental Data
A direct comparative study exposed SAOS-2 osteoblast-like cells to Bioglass 45S5 (BG) particles of varying sizes and concentrations, applying both staining panels under identical conditions to benchmark their performance [19] [29]. The results are summarized in the table below.
Table 1: Comparative Viability Assessment under Cytotoxic Stress
Cell viability (%) of SAOS-2 cells exposed to <38 µm BG particles at 100 mg/mL [19] [4].
| Assessment Technique | Staining Panel | Viability at 3 Hours | Viability at 72 Hours |
|---|---|---|---|
| Fluorescence Microscopy (FM) | FDA / PI | 9% | 10% |
| Flow Cytometry (FCM) | Hoechst / DiIC1 / Annexin V-FITC / PI | 0.2% | 0.7% |
Key Findings:
- Strong Correlation, Different Sensitivity: Despite the stark difference in absolute values, the data from both techniques showed a strong statistical correlation (r = 0.94, R² = 0.8879, p < 0.0001) across all tested conditions [19] [4]. This confirms that both can reliably track cytotoxic trends.
- Superior FCM Sensitivity: The multiparametric FCM panel consistently reported lower viability percentages under high cytotoxic stress, suggesting a higher sensitivity and resolution for detecting compromised cells that might still be scored as viable by the FM-based method [19].
- Mechanistic Insight: A key advantage of the FCM panel was its ability to differentiate the mode of cell death. It distinguished early apoptotic populations (Annexin V-FITC positive, PI negative) from late apoptotic/necrotic populations (Annexin V-FITC positive, PI positive), providing a deeper understanding of the biomaterial's cytotoxic mechanism [19] [4].
Detailed Methodologies
To ensure reproducibility, the experimental protocols for both staining methods are detailed below.
- Cell Culture and Treatment: Seed SAOS-2 osteoblast-like cells in culture plates and allow them to adhere. Treat with the test particulate biomaterial (e.g., Bioglass 45S5) at desired concentrations and durations.
- Staining Solution Preparation: Prepare a working solution containing Fluorescein Diacetate (FDA) and Propidium Iodide (PI) in a suitable buffer, such as phosphate-buffered saline (PBS).
- Staining Incubation: After the treatment period, remove the culture medium and gently wash the cells with PBS. Add the FDA/PI working solution to cover the cells and incubate for a specified time (e.g., 5-15 minutes) at room temperature, protected from light.
- Image Acquisition and Analysis: Remove the staining solution, replace with fresh buffer, and immediately visualize using a fluorescence microscope with appropriate filter sets for FITC (green) and TRITC/Texas Red (red). Capture multiple random fields. Viability is quantified as the percentage of green-fluorescent cells relative to the total number of cells (green + red).
- Cell Harvesting: After treatment, harvest the cells from the culture substrate, typically using trypsinization followed by centrifugation to form a cell pellet.
- Staining for Viability and Apoptosis: Resuspend the cell pellet in a binding buffer.
- Add Annexin V-FITC and incubate for 10-15 minutes in the dark.
- Add Propidium Iodide (PI) and other dyes like Hoechst (for DNA content/nuclear staining) or DiIC1 (for mitochondrial membrane potential) shortly before analysis, as per manufacturer's instructions.
- Flow Cytometric Analysis: Analyze the stained cell suspension on a flow cytometer equipped with lasers and filters appropriate for the fluorochromes used (e.g., 488 nm for FITC and PI, 405 nm for Hoechst, 638 nm for DiIC1). Collect a sufficiently high number of events (e.g., 10,000 cells).
- Data Analysis and Gating: Use sequential gating to identify the cell population of interest (e.g., based on forward/side scatter and Hoechst staining). Then, create a biparametric plot of Annexin V-FITC vs. PI to distinguish the subpopulations:
- Annexin V-FITCâ» / PIâ»: Viable cells.
- Annexin V-FITC⺠/ PIâ»: Early apoptotic cells.
- Annexin V-FITC⺠/ PIâº: Late apoptotic or necrotic cells.
The logical relationship of how these stains work together to classify cell states in the FCM panel is summarized below.
The Scientist's Toolkit: Essential Research Reagents
Selecting the right reagents is fundamental to the success of these viability assays. The following table details the key components used in the featured staining panels.
Table 2: Key Reagent Solutions for Cell Viability Assessment
| Reagent / Dye | Function / Mechanism | Typical Application |
|---|---|---|
| Fluorescein Diacetate (FDA) | Cell-permeant substrate for intracellular esterases; produces green fluorescein in viable cells. | FM Live/Dead Staining |
| Propidium Iodide (PI) | Cell-impermeant DNA intercalator; red fluorescence indicates loss of membrane integrity. | FM & FCM (Necrosis/Late Apoptosis) |
| Annexin V-FITC | Binds phosphatidylserine (PS) on the outer leaflet of the plasma membrane; indicates early apoptosis. | FCM Apoptosis Detection |
| Hoechst Stains | Cell-permeant DNA stain; labels all nuclei, used for cell gating and enumeration. | FCM Nuclear Staining |
| DiIC1(5) | Carbocyanine dye that accumulates in active mitochondria; indicates mitochondrial membrane potential. | FCM Viability / Metabolism |
| Fixable Viability Dyes | Amine-reactive dyes that covalently bind to non-viable cells; allow subsequent cell fixation. | FCM (excluded from viable cells) [30] |
| Borax (B4Na2O7.10H2O) | Borax (Sodium Tetraborate) | |
| (3,5-Dibromophenyl)(4-(trifluoromethyl)phenyl)methanone | (3,5-Dibromophenyl)(4-(trifluoromethyl)phenyl)methanone, CAS:1310355-45-3, MF:C14H7Br2F3O, MW:408.012 | Chemical Reagent |
The choice between the standard FDA/PI panel for FM and multiparametric panels for FCM hinges on the specific research requirements regarding information depth, sensitivity, and throughput.
- FDA/PI for Fluorescence Microscopy provides a straightforward, cost-effective, and visually intuitive method for basic viability assessment. It is an excellent tool for initial screening and for experiments where direct morphological observation is beneficial.
- Multiparametric Panels for Flow Cytometry offer a superior, high-resolution analysis of cell health. Their principal advantage lies in the ability to distinguish between viable, early apoptotic, and late apoptotic/necrotic cell populations, providing mechanistically rich data [19] [4]. FCM demonstrates higher sensitivity, especially under conditions of severe cytotoxic stress, and enables the high-throughput analysis of thousands of cells, minimizing sampling bias [19].
For studies where understanding the pathway of cell death is critical, or where the highest level of quantitative precision is required, multiparametric flow cytometry is the unequivocally more powerful technique. However, for rapid, accessible live/dead assessment, FDA/PI staining combined with fluorescence microscopy remains a valid and widely used approach, particularly when its limitations regarding sensitivity and mechanistic insight are acknowledged.
Reliable assessment of biomaterial cytotoxicity is a cornerstone of preclinical evaluation in biomedical research and drug development. Among the various methods available, fluorescence microscopy (FM) and flow cytometry (FCM) stand out as widely used techniques for determining cell viability. However, their comparative performance in the context of particulate systems, such as bioactive glasses, has remained underexplored. This guide provides a direct, data-driven comparison of these two methodologies, focusing on their application in evaluating the cytotoxicity of Bioglass 45S5 (BG) on SAOS-2 osteoblast-like cells. The findings are critical for researchers aiming to select the most appropriate, sensitive, and reliable technique for their biomaterial compatibility testing.
Experimental Setup & Quantitative Comparison
This analysis is based on a 2025 comparative study that exposed SAOS-2 osteoblast-like cells to BG particles of different sizes and concentrations, assessing viability at two time points using both FM and FCM under identical conditions [19] [29].
- Test Material: Bioglass 45S5 (BG) particles in three size ranges: <38 µm, 63–125 µm, and 315–500 µm [19].
- Cell Line: SAOS-2 human osteosarcoma cell line, chosen for its mature osteoblast-like phenotype [19].
- Experimental Conditions: Cells were treated with BG at concentrations of 25, 50, and 100 mg/mL for 3 and 72 hours [19].
- Viability Staining:
- Fluorescence Microscopy (FM): Used FDA (fluorescein diacetate) and PI (propidium iodide) to distinguish viable (green) from non-viable (red) cells [19] [4].
- Flow Cytometry (FCM): Employed a multiparametric stain (Hoechst, DiIC1, Annexin V-FITC, and PI) to classify cells into viable, early apoptotic, late apoptotic, and necrotic populations [19] [4].
Both techniques confirmed that smaller particles and higher concentrations caused greater cytotoxicity [19]. The most pronounced effect was observed for the smallest particles (<38 µm) at the highest concentration (100 mg/mL). The table below summarizes the viability measurements under these conditions, highlighting the critical difference between the two methods.
Table 1: Cell Viability Under High Cytotoxic Stress (<38 µm BG at 100 mg/mL)
| Time Point | Fluorescence Microscopy (FM) Viability | Flow Cytometry (FCM) Viability |
|---|---|---|
| 3 hours | 9% | 0.2% |
| 72 hours | 10% | 0.7% |
| Control Viability | >97% | >97% |
Despite the significant difference in absolute values, a strong statistical correlation was found between the datasets from both techniques (r = 0.94, R² = 0.8879, p < 0.0001) [19] [4]. This validates FM as a useful screening tool but also underscores FCM's superior sensitivity, especially under high cytotoxic stress.
Detailed Methodologies
Fluorescence Microscopy (FM) Protocol
The FM protocol offers direct visual assessment of cell cultures. The following diagram outlines the core workflow for this method.
Step-by-Step Procedure [19]:
- Cell Seeding and Treatment: SAOS-2 osteoblast-like cells are seeded in culture plates and exposed to the prepared BG particles at the desired concentrations.
- Incubation: Cells are incubated with the particles for the designated time (e.g., 3 or 72 hours).
- Staining: The culture medium is replaced with a solution containing the fluorescent stains.
- FDA (Fluorescein diacetate): A cell-permeant esterase substrate. Metabolically active viable cells convert it into fluorescent fluorescein (green emission).
- PI (Propidium iodide): A cell-impermeant DNA stain. It only enters cells with compromised plasma membranes (dead cells) and emits red fluorescence.
- Washing and Visualization: Unbound stain is washed off, and the cells are immediately visualized under a fluorescence microscope with appropriate filter sets.
- Image Analysis: Multiple random fields of view are captured. Viable (green) and non-viable (red) cells are counted manually or using image analysis software to calculate the percentage viability.
Flow Cytometry (FCM) Protocol
The FCM protocol provides a high-throughput, quantitative analysis of individual cells in suspension. The workflow is more complex, involving several staining steps to differentiate cell states.
Step-by-Step Procedure [19]:
- Cell Seeding and Treatment: Identical to the FM protocol.
- Incubation: Identical to the FM protocol.
- Cell Harvesting: After incubation, cells are detached from the culture surface using trypsin-EDTA to create a single-cell suspension—a critical step for FCM.
- Multiparametric Staining: The cell suspension is stained with a panel of dyes:
- Hoechst: A cell-permeant blue fluorescent DNA stain, often used to identify nucleated cells.
- DiIC1(5): A lipophilic cyanine dye that accumulates in the mitochondria of viable cells, reflecting mitochondrial membrane potential.
- Annexin V-FITC: Binds to phosphatidylserine (PS), which is externalized to the outer leaflet of the plasma membrane during early apoptosis (green fluorescence).
- PI: As in FM, it labels cells with permeable membranes (late apoptotic and necrotic cells).
- Data Acquisition: The stained cell suspension is run through a flow cytometer. The instrument analyzes thousands of cells per second, measuring light scattering and fluorescence parameters for each cell.
- Gating and Analysis: Data analysis software is used to identify cell populations based on their staining profiles:
- Viable cells: Annexin V-/PI-
- Early apoptotic cells: Annexin V+/PI-
- Late apoptotic cells: Annexin V+/PI+
- Necrotic cells: Annexin V-/PI+
The Scientist's Toolkit: Essential Research Reagents
Table 2: Key Reagents and Their Functions in Cell Viability Assays
| Reagent | Function | Assay Type |
|---|---|---|
| FDA (Fluorescein Diacetate) | Metabolized by esterases in viable cells to produce green fluorescence. | Fluorescence Microscopy |
| Propidium Iodide (PI) | Binds to DNA in cells with compromised membranes; red fluorescent. | FM & Flow Cytometry |
| Annexin V-FITC | Binds to phosphatidylserine exposed on the surface of apoptotic cells. | Flow Cytometry |
| Hoechst Stains | Cell-permeant blue fluorescent DNA stains; identifies nucleated cells. | Flow Cytometry |
| DiIC1(5) | Dye that accumulates in active mitochondria based on membrane potential. | Flow Cytometry |
| CellTrace Violet | Fluorescent cell staining dye for tracking cell division and proliferation. | Flow Cytometry [31] |
| BrdU (Bromodeoxyuridine) | Thymidine analog incorporated into DNA during synthesis; marks S-phase cells. | Flow Cytometry [31] |
| JC-1 | Dye used to measure mitochondrial membrane potential (MMP). | Flow Cytometry [31] |
| Sag1.3 | Sag1.3, CAS:912545-86-9, MF:C28H28ClN3OS, MW:490.1 g/mol | Chemical Reagent |
| IT1t | IT1t, MF:C21H34N4S2, MW:406.7 g/mol | Chemical Reagent |
Discussion & Recommendations for Researchers
This comparative case study reveals distinct advantages and limitations for each technique, guiding researchers in their selection.
- Resolution and Sensitivity: Flow cytometry demonstrated superior sensitivity, detecting drastically lower viability levels (0.2-0.7%) under high-stress conditions compared to microscopy (9-10%) [19]. This is likely because FCM can analyze a much larger number of cells (tens of thousands), minimizing sampling bias, whereas FM only assesses a few hundred cells in selected fields of view [19].
- Cellular Insight: A key advantage of FCM is its multiparametric capability. While FM provides a simple live/dead classification, FCM differentiates between early and late apoptosis and necrosis [19] [4]. This offers deeper mechanistic insights into the cell death pathways triggered by the biomaterial.
- Practical Considerations: FM allows direct visualization of cell-particle interactions and morphology, which can be valuable. However, it is more labor-intensive for quantification and susceptible to operator bias [19]. While FCM requires specialized instrumentation and a more complex sample preparation (including creating a single-cell suspension), it provides high-throughput, objective, and quantitative data [19].
For researchers and drug development professionals, the choice depends on the study's goals:
- Use fluorescence microscopy for initial screening, when direct visualization is crucial, or when access to flow cytometry is limited.
- Choose flow cytometry for high-throughput, quantitative studies requiring high statistical power, sensitivity under high cytotoxicity, and detailed information on the mode of cell death (apoptosis vs. necrosis).
The strong correlation between the methods means they can be used complementarily, but the evidence strongly supports FCM as the more robust and informative tool for the precise cytocompatibility evaluation of particulate biomaterials [19] [4].
Flow Cytometry vs. Fluorescence Microscopy for Cell Viability Assessment
Cell viability assessment is a cornerstone of biomedical research, clinical diagnostics, and drug development, providing crucial insights into cellular health and function under various experimental conditions. Among the numerous techniques available, flow cytometry (FCM) and fluorescence microscopy (FM) have emerged as two prominent methodologies, each with distinct advantages and limitations. Flow cytometry is a laser-based technology that enables rapid multi-parametric analysis of single cells in solution, generating both scattered and fluorescent light signals that provide information about cell size, granularity, and biomarker expression [32]. In contrast, fluorescence microscopy utilizes specific fluorescent dyes or proteins to visualize cellular structures and processes, allowing for direct imaging of cells and tissues [33]. The selection between these techniques significantly impacts the quality, depth, and interpretation of experimental data in various research contexts.
This comprehensive guide objectively compares the performance characteristics of flow cytometry and fluorescence microscopy across three critical application areas: immunophenotyping, apoptosis detection, and clinical diagnostics. By examining experimental data, technical capabilities, and practical considerations, we aim to provide researchers with evidence-based insights to inform their methodological selections. Understanding the relative strengths and limitations of each approach is essential for optimizing experimental design, ensuring data reliability, and advancing scientific discovery in cell biology and related fields.
Technical Principles and Instrumentation
Flow Cytometry Fundamentals
Flow cytometry operates on the principle of hydrodynamic focusing, where cells in suspension are aligned in a single-file stream through a laser interrogation point. As cells pass through the laser beam, they scatter light and may emit fluorescence from labeled antibodies or dyes. The instrumentation consists of three main systems: fluidics, optics, and electronics [32]. The fluidics system delivers and focuses the sample to the laser intercept point; the optical system includes excitation sources (lasers) and collection optics (filters and detectors); while the electronic system converts the detected signals into digital data [32].
Key measurements in flow cytometry include forward scatter (FSC), which correlates with cell size, and side scatter (SSC), which indicates cellular granularity or internal complexity [32] [34]. Fluorescence detection enables multiparametric analysis, with modern instruments capable of simultaneously measuring up to 30-50 parameters using multiple laser systems and sophisticated detector arrays [34]. Advanced flow cytometer variants include cell sorters (e.g., FACS), which can physically separate cell populations based on defined characteristics; imaging flow cytometers that combine microscopy with traditional FCM; mass cytometers that use heavy metal tags instead of fluorochromes; and spectral analyzers that measure entire emission spectra to improve multiparametric resolution [32].
Fluorescence Microscopy Fundamentals
Fluorescence microscopy operates on the principle of exciting fluorophores with specific wavelengths of light and detecting the emitted light at longer wavelengths. Conventional widefield fluorescence microscopy illuminates the entire sample and captures emitted light through an objective lens, enabling visualization of specific molecules or structures within cells and tissues [33]. The technique relies on fluorescent reagents such as fluorescently conjugated antibodies, DNA binding dyes, viability dyes, and fluorescent proteins to label cellular components [33].
The resolution of traditional fluorescence microscopy is limited by the diffraction barrier (approximately 200 nm), though super-resolution techniques have been developed to overcome this limitation [33]. Fluorescence microscopy allows direct observation of cellular localization, morphology, and dynamic processes through time-lapse imaging. However, it faces challenges including shallow depth of field, photobleaching, phototoxicity, autofluorescence interference, and difficulties in accurately distinguishing between live and dead cells when used for viability assessment [33]. Manual counting or image analysis can be labor-intensive, potentially undermining precision and throughput compared to automated methods [33].
Comparison of fundamental workflows for flow cytometry and fluorescence microscopy techniques.
Comparative Performance in Key Applications
Immunophenotyping Capabilities
Immunophenotyping represents one of the most common applications of flow cytometry, enabling the characterization and quantification of heterogeneous cell populations based on surface and intracellular marker expression. The technology excels in this domain due to its ability to simultaneously analyze multiple parameters on individual cells within mixed populations [34]. Modern flow cytometers can detect up to 30 colors in a single experiment, with routine panels typically comprising 15-20 markers for comprehensive immunophenotyping [34]. This multiparametric capacity allows researchers to identify rare cell populations, characterize complex immune subsets, and assess cellular activation states with statistical robustness derived from high cell throughput.
Fluorescence microscopy offers complementary advantages for immunophenotyping, particularly in providing spatial context and morphological detail. Through techniques such as immunofluorescence staining and multilabel imaging, researchers can visualize protein localization, cell-cell interactions, and tissue architecture [33]. However, conventional fluorescence microscopy has limitations in the number of parameters that can be simultaneously assessed due to spectral overlap, and throughput is significantly lower compared to flow cytometry [33]. While advanced imaging platforms and spectral unmixing approaches have expanded these capabilities, flow cytometry remains superior for high-dimensional immunophenotyping of dissociated cells, whereas microscopy provides essential spatial information in intact samples.
Table 1: Immunophenotyping Comparison
| Parameter | Flow Cytometry | Fluorescence Microscopy |
|---|---|---|
| Multiplexing Capacity | High (up to 30-50 parameters simultaneously) [34] | Moderate (typically 4-7 labels due to spectral overlap) [33] |
| Throughput | Very high (10,000+ cells/second) [2] | Low to moderate (limited by imaging and analysis speed) [33] |
| Spatial Context | Limited (cells in suspension) | Excellent (preserved tissue architecture and subcellular localization) [33] |
| Data Output | Quantitative population statistics | Qualitative visualization with semi-quantitative analysis [33] |
| Rare Population Detection | Excellent (statistical power from high cell numbers) | Challenging (limited field of view and sampling bias) [33] |
Apoptosis Detection Sensitivity
The comparative performance of flow cytometry and fluorescence microscopy in apoptosis detection was rigorously evaluated in a 2025 study investigating bioactive glass cytotoxicity on SAOS-2 osteoblast-like cells [33] [29]. Both techniques confirmed a clear trend of increased cytotoxicity with smaller particle sizes and higher concentrations, but revealed important differences in sensitivity and resolution of apoptotic stages. Fluorescence microscopy employing FDA/PI staining could distinguish viable from nonviable cells but offered limited capacity to differentiate stages of cell death [33]. In contrast, flow cytometry utilizing multiparametric staining (Hoechst, DiIC1, Annexin V-FITC, and PI) enabled precise classification of viable, early apoptotic, late apoptotic, and necrotic populations [33] [29].
Under high cytotoxic stress conditions (particles <38 μm at 100 mg/mL), fluorescence microscopy reported viability of 9% at 3 hours and 10% at 72 hours, while flow cytometry detected more extreme viability reductions to 0.2% and 0.7% respectively [33] [29] [4]. This discrepancy highlights flow cytometry's superior sensitivity in detecting subtle cellular changes under pronounced cytotoxic stress. Despite these differences, a strong correlation between both techniques was observed (r = 0.94, R² = 0.8879, p < 0.0001), validating fluorescence microscopy as a reliable screening tool while establishing flow cytometry as the more sensitive methodology for detailed apoptosis mechanism studies [33] [29].
Table 2: Apoptosis Detection Performance in Bioactive Glass Cytotoxicity Study
| Measurement | Flow Cytometry | Fluorescence Microscopy | Experimental Conditions |
|---|---|---|---|
| Viability Detection Range | 0.2% - 97% [33] [29] | 9% - 97% [33] [29] | SAOS-2 cells, BG particles <38μm at 100 mg/mL |
| Cell Death Pathway Resolution | Distinguishes early apoptosis, late apoptosis, and necrosis [33] [4] | Primarily distinguishes viable vs. nonviable cells [33] | Multiparametric staining vs. FDA/PI |
| Statistical Correlation | r = 0.94, R² = 0.8879, p < 0.0001 [33] [29] | r = 0.94, R² = 0.8879, p < 0.0001 [33] [29] | Comparative analysis across all test conditions |
| Precision Under High Cytotoxic Stress | Superior precision and sensitivity [33] [4] | Reduced precision under extreme conditions [33] | High particle concentrations and small sizes |
Clinical Diagnostic Applications
In clinical diagnostics, flow cytometry has established an indispensable role for numerous applications, particularly in hematological malignancies and immunodeficiency diseases. For immunophenotyping of peripheral blood cells, flow cytometry can detect abnormal cells with marker patterns characteristic of specific leukemia and lymphoma types [34]. The DHR (dihydrorhodamine) test, used since 1988, leverages flow cytometry to assess neutrophil function by measuring their respiratory burst capacity after stimulation, enabling diagnosis of chronic granulomatous disease and other functional immune disorders [34]. Flow cytometry also facilitates CD4+ T-cell counting in HIV patients, residual disease detection in cancer, and stem cell enumeration for transplantation medicine [2] [34].
Fluorescence microscopy maintains important roles in clinical diagnostics, particularly in histopathology, cytology, and infectious disease identification. Its ability to provide morphological context complements the quantitative data from flow cytometry. In autoimmune disease diagnostics, fluorescent antinuclear antibody (ANA) testing using microscopy remains a gold standard. However, for high-volume routine testing requiring precise quantification of cellular markers, flow cytometry's throughput, standardization capabilities, and quantitative output make it preferred for many clinical applications [34]. Emerging technologies like imaging flow cytometry aim to bridge these approaches by combining the high-throughput quantitative capabilities of flow cytometry with the morphological information of microscopy [8].
Decision pathway for selecting between flow cytometry and fluorescence microscopy in clinical applications.
Experimental Protocols and Methodologies
Flow Cytometry Viability Protocol
The following protocol summarizes the multiparametric staining approach used in the bioactive glass cytotoxicity study [33], which enabled distinction of viable, apoptotic, and necrotic cell populations:
Cell Preparation: Harvest SAOS-2 osteoblast-like cells after treatment with particulate biomaterials and prepare single-cell suspension in appropriate buffer.
Staining Cocktail Preparation: Combine the following reagents in staining buffer:
- Hoechst dye (nuclear staining)
- DiIC1 (membrane potential indicator)
- Annexin V-FITC (phosphatidylserine exposure detection)
- Propidium Iodide (PI) (membrane integrity indicator)
Staining Procedure: Incubate cell suspension with staining cocktail for 15-20 minutes at room temperature protected from light.
Data Acquisition: Analyze samples using flow cytometer with appropriate laser and filter configurations:
- Hoechst: UV laser (355 nm), 450/50 nm filter
- FITC: Blue laser (488 nm), 530/30 nm filter
- DiIC1: Red laser (640 nm), 670 nm filter
- PI: Blue laser (488 nm), 585/42 nm filter
Analysis Strategy:
- Gate on single cells using FSC-A vs FSC-H
- Identify viable cells (Hoechst+, Annexin V-, PI-)
- Identify early apoptotic cells (Hoechst+, Annexin V+, PI-)
- Identify late apoptotic/necrotic cells (Hoechst+, Annexin V+, PI+)
This protocol provides comprehensive information about cell death mechanisms beyond simple viability assessment and can be adapted for various cell types and experimental conditions.
Fluorescence Microscopy Viability Protocol
The fluorescence microscopy protocol from the same comparative study [33] utilized FDA/PI staining for viability assessment:
Cell Preparation: Culture SAOS-2 cells on appropriate substrate and treat with test particulates. Do not trypsinize; image adherent cells directly.
Staining Solution Preparation:
- Fluorescein diacetate (FDA) stock solution: 5 mg/mL in acetone
- Propidium iodide (PI) stock solution: 1 mg/mL in PBS
- Working solution: Combine FDA (final concentration 10 μg/mL) and PI (final concentration 15 μg/mL) in culture medium or buffer
Staining Procedure:
- Remove culture medium from cells
- Add staining solution to cover cells
- Incubate for 5-10 minutes at 37°C protected from light
- Remove staining solution and replace with fresh buffer
Image Acquisition:
- Use fluorescence microscope with appropriate filter sets
- FDA (viable cells): FITC filter set (excitation 480/30 nm, emission 535/45 nm)
- PI (dead cells): TRITC filter set (excitation 540/25 nm, emission 605/55 nm)
- Capture multiple non-overlapping fields for statistical relevance (minimum 5-10 fields)
Analysis and Quantification:
- Count FDA-positive (green, viable) and PI-positive (red, dead) cells
- Calculate viability percentage: (viable cells/total cells) × 100
- Document morphological features of cells
This approach provides direct visualization of cell status and morphology but offers limited mechanistic information compared to the multiparametric flow cytometry approach.
Research Reagent Solutions
The selection of appropriate reagents is crucial for successful cell viability assessment using either flow cytometry or fluorescence microscopy. The following table summarizes key reagents and their applications in viability and cell death assessment.
Table 3: Essential Research Reagents for Viability Assessment
| Reagent Category | Specific Examples | Function & Mechanism | Application Notes |
|---|---|---|---|
| Viability Dyes | Propidium Iodide (PI), 7-AAD | Membrane integrity indicators; exclude from viable cells [35] | PI suitable for both FCM and FM; 7-AAD preferred for FCM with FITC conjugates [35] |
| Apoptosis Detectors | Annexin V conjugates | Binds phosphatidylserine exposed on apoptotic cells [33] [29] | Requires calcium-containing buffer; typically combined with viability dye [33] |
| Metabolic Activity Indicators | Fluorescein Diacetate (FDA), Calcein-AM | Converted to fluorescent products by esterases in viable cells [33] [4] | FDA for FM; Calcein-AM for FCM; indicate enzymatic activity [33] |
| Nuclear Stains | Hoechst dyes, DAPI | Bind DNA; indicate cell presence and nuclear morphology [33] | Distinguish nucleated cells; cell cycle analysis [33] |
| Membrane Potential Sensors | DiIC1(5) | Mitochondrial membrane potential indicator [33] [29] | Loss of signal indicates early apoptosis; FCM applications [33] |
| Antibody Panels | CD markers, lineage-specific antibodies | Cell surface and intracellular protein detection [32] [34] | Multiparametric immunophenotyping; requires titration and compensation [34] |
Technical Advantages and Limitations
Flow Cytometry Strengths and Constraints
Flow cytometry offers several significant advantages for cell viability assessment and cellular analysis. Its foremost strength is high-throughput capability, with the ability to analyze thousands of cells per second, providing robust statistical power for detecting rare populations and subtle cellular changes [2]. The technology enables multiparametric analysis, simultaneously measuring multiple cellular parameters including size, granularity, and multiple fluorescent markers [32] [34]. This provides quantitative precision with objective, numerical data output that minimizes observer bias and facilitates standardization across experiments and laboratories [2]. Additionally, modern flow cytometers offer cell sorting capabilities (FACS), allowing physical separation of cell populations for downstream analysis [32] [34].
The limitations of flow cytometry include its inability to provide spatial context, as cells are analyzed in suspension rather than in their native tissue architecture [2]. The technique requires single-cell suspensions, making it unsuitable for solid tissues that cannot be effectively dissociated [34]. Flow cytometry also demands significant technical expertise for instrument operation, experimental design, and data interpretation, particularly for complex multiparametric panels [2] [34]. There are also substantial equipment and operational costs associated with flow cytometry, including expensive instrumentation, maintenance, and reagent costs [2].
Fluorescence Microscopy Strengths and Constraints
Fluorescence microscopy provides unique advantages for cell viability assessment, primarily through morphological preservation that allows visualization of cellular and subcellular structures in their native context [33]. The technique offers spatial information regarding tissue architecture, cell-cell interactions, and subcellular localization of targets [33]. It requires minimal sample processing for adherent cells, avoiding potential artifacts introduced by cell harvesting procedures [33]. Fluorescence microscopy also provides flexibility in sample types, accommodating live or fixed cells, tissue sections, and whole mounts [33]. Modern microscopy systems additionally enable live-cell imaging for tracking dynamic processes over time [36].
The limitations of fluorescence microscopy include lower throughput compared to flow cytometry, with analysis typically limited to hundreds or thousands of cells rather than tens of thousands [33]. There is potential for subjective interpretation in image analysis, particularly with manual counting methods [33] [35]. The technique is susceptible to photobleaching and phototoxicity, which can compromise sample integrity and experimental outcomes [33]. Additionally, fluorescence microscopy has limited multiplexing capability due to spectral overlap of fluorophores, typically allowing simultaneous detection of only 4-7 markers [33]. The quantitative capabilities of fluorescence microscopy are generally inferior to flow cytometry, particularly for intensity measurements [33].
Flow cytometry and fluorescence microscopy offer complementary approaches to cell viability assessment, with distinct advantages that make each technique suitable for specific research contexts. Flow cytometry excels in high-throughput, multiparametric analysis of cell populations, providing robust quantitative data with superior statistical power, particularly valuable for apoptosis mechanism studies, immunophenotyping, and clinical diagnostics requiring precise quantification [33] [34]. Fluorescence microscopy provides essential spatial and morphological context, enabling visualization of cellular processes in intact samples and making it indispensable for localization studies and samples where tissue architecture must be preserved [33].
The comparative study on bioactive glass cytotoxicity demonstrates that while both techniques show strong correlation in viability assessment, flow cytometry offers enhanced sensitivity, particularly under high cytotoxic stress conditions, and enables differentiation of cell death mechanisms through multiparametric staining approaches [33] [29] [4]. Selection between these techniques should be guided by specific research objectives, with flow cytometry preferred for quantitative, high-throughput analysis of dissociated cells, and fluorescence microscopy chosen when spatial information and morphological context are paramount. Emerging technologies such as imaging flow cytometry [8] and advanced computational analysis methods continue to bridge the gap between these approaches, offering promising avenues for comprehensive cell analysis that leverages the strengths of both methodologies.
In the field of cell viability assessment, particularly for evaluating biomaterial cytotoxicity, the choice of analytical technique dictates specific and often divergent sample preparation protocols. Flow cytometry (FCM) and fluorescence microscopy (FM) serve as cornerstone methods for quantifying cell health and death, yet they require fundamentally different sample states. FCM necessitates analyzing cells in a single-cell suspension to ensure accurate hydrodynamic focusing and laser interrogation [37] [38]. In contrast, FM often benefits from examining adherent cells cultured directly on substrates, preserving morphological context and spatial relationships [19] [1]. This guide objectively compares these critical sample preparation requirements, underpinned by experimental data from biomaterial cytotoxicity studies. The fundamental distinction in sample state arises from the core operating principles of each instrument. FCM's fluidics system requires cells to pass individually through a laser beam, where clumps or debris can cause blockages and inaccurate data recording [38]. FM, however, visualizes cells in a static state, allowing for the direct observation of attached cells, which is particularly valuable for studying cell-biomaterial interactions in their native, adhered state [19].
Core Principles and Technical Comparison
The following table summarizes the fundamental technical differences that dictate sample preparation for each method.
Table 1: Core Technical Comparison of Flow Cytometry and Fluorescence Microscopy
| Feature | Flow Cytometry (FCM) | Fluorescence Microscopy (FM) |
|---|---|---|
| Sample State | Single-cell suspension [37] [38] | Adherent cells or suspension [19] [1] |
| Throughput | High (10,000+ events/second) [1] | Low to Medium (manual) to High (automated) [19] [8] |
| Primary Data Output | Quantitative fluorescence intensity for thousands of cells [1] | Quantitative intensity & high-resolution morphological images [19] [1] |
| Spatial Context | Lost [1] | Preserved (cell shape, attachment, subcellular localization) [1] |
| Key Strength | High-throughput, statistical power, multiparametric analysis [19] [4] | Morphological insight, spatial relationships, no detachment needed [19] [1] |
Experimental Workflows: A Side-by-Side Comparison
The sample preparation pathways for FCM and FM diverge significantly, especially when dealing with cells that are naturally adherent. The workflow below illustrates the key steps for each method.
Detailed Protocol for Flow Cytometry (Single-Cell Suspension)
The following steps are critical for preparing high-quality single-cell suspensions for FCM, as derived from established protocols [37] [38]:
- A. Cell Detachment (for adherent cells): Gently detach cells using a mild enzyme solution like Accutase, trypsin, or EDTA. The choice of reagent should be optimized to minimize the destruction of cell surface epitopes, which are crucial for subsequent antibody staining [37].
- B. Washing and Concentration: Centrifuge the cell suspension (300-400 x g for 4-5 minutes) and carefully decant the supernatant. Resuspend the pellet in an appropriate buffer, such as PBS without Ca²âº/Mg²⺠or a specialized Flow Cytometry Staining Buffer [37].
- C. Filtration and Viability Assessment: Pass the cell suspension through a nylon mesh cell strainer to remove any remaining clumps or debris that could obstruct the flow cytometer's tubing. It is also recommended to perform a cell count and viability check at this stage [38].
- D. Staining for Multiparametric Analysis: Resuspend the cells at a density of approximately 1 x 10â· cells/mL in staining buffer. Add the desired fluorescent probes, such as a multiparametric mix of Hoechst (for live cells), DiIC1 (for mitochondrial membrane potential), Annexin V-FITC (for early apoptosis), and Propidium Iodide (PI) (for late apoptosis/necrosis) [19] [4]. Incubate in the dark according to dye-specific protocols before a final wash and resuspension for acquisition.
Detailed Protocol for Fluorescence Microscopy (Adherent Cells)
For FM, the goal is to maintain cells in their adherent state to preserve morphology [19]:
- A. Seeding and Treatment: Seed cells directly onto a suitable imaging substrate, such as a glass coverslip or the bottom of a culture dish or multi-well plate. Apply the experimental treatment (e.g., particulate biomaterials like Bioglass 45S5) and incubate for the desired duration [19].
- B. Staining (in situ): After incubation, gently wash the adherent cell layer with a buffered saline solution to remove non-adherent particles and debris. Apply live/dead stains directly to the cells on the substrate. A common combination is Fluorescein Diacetate (FDA), which is metabolized to a green fluorescent product in live cells, and Propidium Iodide (PI), which enters dead cells with compromised membranes and stains nuclei red [19] [4].
- C. Imaging: Image the cells directly on the substrate using a fluorescence microscope. Cells can be imaged live in a controlled environment or fixed (e.g., with formaldehyde) for later analysis [19].
Comparative Experimental Data in Biomaterial Cytotoxicity
A direct comparative study on Bioglass 45S5 (BG) cytotoxicity highlights the practical outcomes of these different methodologies. The study treated SAOS-2 osteoblast-like cells with BG particles of varying sizes and concentrations and assessed viability using both FM and FCM [19] [4].
Table 2: Experimental Viability Results Comparing FCM and FM
| Experimental Condition | Viability by FM (FDA/PI) | Viability by FCM (Multiparametric Stain) |
|---|---|---|
| Control (Untreated) | >97% [4] | >97% [4] |
| <38 µm BG, 100 mg/mL, 3h | 9% [19] [4] | 0.2% [19] [4] |
| <38 µm BG, 100 mg/mL, 72h | 10% [19] [4] | 0.7% [19] [4] |
| Statistical Correlation | r = 0.94, R² = 0.8879, p < 0.0001 [19] [4] |
Key Findings from Comparative Data
- Superior Sensitivity of FCM: The data shows that FCM reported significantly lower viability percentages under high cytotoxic stress. This enhanced sensitivity is attributed to its ability to analyze a larger number of cells and its use of multiparametric staining that can precisely distinguish early apoptotic, late apoptotic, and necrotic populations, which FM may misclassify in a simple live/dead dichotomy [19] [4].
- Strong Correlation: Despite the absolute differences, a strong statistical correlation was found between the two methods, validating FM as a reliable screening tool. However, FCM is demonstrated to be more precise, especially under conditions of high cytotoxicity [19].
- Impact of Sample Preparation: The FCM protocol, which involved detaching cells from the substrate, may itself contribute to the loss of cells that were already weakened by the cytotoxic treatment, potentially accounting for part of the lower viability readout. In contrast, FM assesses cells that remain attached, which could overrepresent a surviving population [19].
The Scientist's Toolkit: Essential Research Reagents
The following table lists key reagents used in the featured experiments for cell viability assessment.
Table 3: Essential Reagents for Cell Viability Assessment
| Reagent / Assay | Function / Application |
|---|---|
| Accutase Enzyme | Gentle cell detachment solution for creating single-cell suspensions from adherent cultures for FCM [37]. |
| FDA / PI Staining | Classic live/dead fluorescent stain combination used in fluorescence microscopy (FM) [19] [4]. |
| Hoechst 33342 | Cell-permeant DNA stain used in FCM to identify all nucleated cells in a population [19]. |
| Annexin V-FITC | Binds to phosphatidylserine exposed on the outer leaflet of the cell membrane, a marker for early apoptosis. Used in FCM panels [19] [4]. |
| Propidium Iodide (PI) | Membrane-impermeant DNA stain that identifies dead cells or those in late-stage apoptosis. Used in both FM and FCM [19] [39]. |
| Cell Strainer | Nylon mesh filter used to remove clumps and ensure a single-cell suspension for FCM, preventing instrument blockages [37] [38]. |
| Di-4-ANEPPDHQ | Voltage-sensitive dye for fluorescence microscopy that reports on membrane order, used for differentiating cell activation states [40]. |
| Flow Cytometry Staining Buffer | Specialized buffer, often without Ca²âº/Mg²⺠and containing azide, for washing and resuspending cells during FCM staining protocols [37]. |
Overcoming Challenges: Expert Tips for Enhanced Data Quality
In the field of cell viability assessment, flow cytometry (FCM) and fluorescence microscopy (FM) are two foundational techniques. A direct comparison of their performance is crucial for researchers aiming to select the most appropriate method for their biomaterial research, such as evaluating the cytotoxicity of particulate bioactive glasses. While both methods are used to assess cell viability, they possess distinct strengths and limitations. Flow cytometry offers high-throughput, multiparametric quantitative data, whereas fluorescence microscopy provides valuable visual confirmation and morphological context. Understanding their comparative performance, along with the common pitfalls in flow cytometry such as weak signal, high background, and abnormal scatter, is essential for generating reliable and reproducible data. This guide objectively compares these techniques, supported by experimental data, and provides methodologies to troubleshoot key challenges in FCM.
Flow Cytometry vs. Fluorescence Microscopy: A Direct Experimental Comparison
A 2025 comparative study directly evaluated the performance of FCM and FM for assessing the cytotoxicity of Bioglass 45S5 (BG) on SAOS-2 osteoblast-like cells. The experimental setup was designed to create a gradient of cytotoxic stress, providing a robust platform for method comparison [33] [4].
Experimental Protocols
- Cell Line and Material: The study used the human osteosarcoma cell line SAOS-2, known for its mature osteoblast-like phenotype. The test material was particulate Bioglass 45S5 (BG) [33].
- Treatment Conditions: Cells were exposed to BG particles of three size ranges (< 38 µm, 63–125 µm, and 315–500 µm) at concentrations of 25, 50, and 100 mg/mL for 3 and 72 hours [33] [29].
- Staining Techniques:
- Fluorescence Microscopy (FM): Utilized Fluorescein Diacetate (FDA) and Propidium Iodide (PI) to stain viable and non-viable cells, respectively [4].
- Flow Cytometry (FCM): Employed a multiparametric staining panel including Hoechst (nuclear stain), DiIC1 (mitochondrial membrane potential indicator), Annexin V-FITC (marker for apoptosis), and PI (marker for necrosis) to classify cell populations into viable, early apoptotic, late apoptotic, and necrotic [33] [4].
Key Comparative Findings and Quantitative Data
Both techniques confirmed that smaller particles and higher concentrations caused greater cytotoxicity. However, the methods yielded different viability percentages and levels of detail under identical conditions [33] [4].
Table 1: Comparative Cell Viability Assessment using FM and FCM
| Particle Size & Concentration | Exposure Time | Viability by FM (FDA/PI) | Viability by FCM (Multiparametric) |
|---|---|---|---|
| Control | 3 h / 72 h | > 97% [4] | > 97% [4] |
| < 38 µm at 100 mg/mL | 3 hours | 9% [4] | 0.2% [33] [4] |
| < 38 µm at 100 mg/mL | 72 hours | 10% [4] | 0.7% [33] [4] |
The data reveals a strong statistical correlation between the results from both techniques (r = 0.94, R² = 0.8879, p < 0.0001) [33] [4]. Despite this correlation, FCM consistently reported lower viability percentages under high cytotoxic stress. This is attributed to FCM's superior sensitivity and its ability to detect early apoptotic cells (Annexin V-FITC positive, PI negative) that FM, with its simple live/dead staining, would likely classify as viable [33] [4]. FCM demonstrated higher precision, especially in high-stress conditions, and provided a nuanced breakdown of cell death mechanisms [33].
Troubleshooting Common Flow Cytometry Pitfalls
Even with its superior quantitative capabilities, flow cytometry data can be compromised by several common issues. Below is a guide to diagnosing and resolving these problems, supported by experimental protocols.
Weak or No Fluorescence Signal
A weak signal can lead to false negatives and an underestimation of marker expression.
Table 2: Troubleshooting Weak Fluorescence Signal
| Possible Cause | Recommended Solution / Experimental Protocol |
|---|---|
| Low antibody concentration or degraded reagents | Titrate antibodies to find the optimal concentration before the main experiment. Ensure reagents are stored correctly and are not expired [41]. |
| Low antigen expression or intracellular target | Use a bright fluorophore (e.g., PE, APC) for low-abundance antigens [42]. For intracellular targets, optimize permeabilization protocols using saponin-based buffers and perform staining on ice [41]. |
| Photobleaching of fluorophore | Protect fluorophores and stained samples from light exposure throughout the experiment. Use fresh antibody aliquots [41] [42]. |
| Suboptimal instrument settings | Ensure proper laser alignment and check that the PMT voltage is appropriately set for the specific fluorescent channel. Use positive controls to optimize settings [41] [43]. |
High Background or Non-Specific Staining
High background can obscure true positive signals and lead to false positives.
Table 3: Troubleshooting High Background
| Possible Cause | Recommended Solution / Experimental Protocol |
|---|---|
| Inadequate washing | Include sufficient wash steps after each antibody incubation. Consider adding a low concentration of detergent (e.g., Tween or Triton X-100) to wash buffers to remove unbound antibodies effectively [41] [42]. |
| Presence of dead cells or cellular debris | Always include a viability dye (e.g., PI or 7-AAD) in the staining panel to gate out dead cells during analysis. Sieve cells before acquisition to remove debris [41] [42]. |
| High autofluorescence | Include an unstained control to quantify and subtract autofluorescence. For highly autofluorescent cells (e.g., neutrophils), use fluorophores that emit in the red channel (e.g., APC) [42]. |
| Fc receptor-mediated binding or non-specific antibody binding | Incorporate an Fc receptor blocking step prior to antibody staining. Use well-validated, specific antibodies and include an isotype control to account for non-specific binding [42] [43]. |
Abnormal Scatter Profile
Abnormal forward scatter (FSC) and side scatter (SSC) profiles can indicate problems with sample quality.
Table 4: Troubleshooting Abnormal Scatter
| Possible Cause | Recommended Solution / Experimental Protocol |
|---|---|
| Cell clumping or doublets | Gently mix the cell suspension by pipetting before running it through the cytometer. Filter cells through a strainer to break up clumps and avoid doublets [41] [43]. |
| Cell lysis or damage | Optimize sample preparation; avoid vortexing or centrifuging at high speeds. Use fresh buffers and analyze cells soon after staining [41] [42]. |
| Bacterial or particulate contamination | Practice proper sterile technique during cell culture and sample preparation. Ensure all buffers and solutions are free of contaminants [41]. |
| Presence of un-lysed red blood cells (RBCs) | Ensure RBC lysis is complete. Use fresh RBC lysis buffer and confirm complete lysis under a microscope if necessary [41]. |
The Scientist's Toolkit: Key Reagents and Materials
The following table details essential reagents used in the comparative FCM/FM study and their functions, which can serve as a reference for designing similar viability assays.
Table 5: Research Reagent Solutions for Cell Viability Assessment
| Reagent / Dye | Function / Application |
|---|---|
| Propidium Iodide (PI) | A membrane-impermeant dye that binds to DNA. It is used in both FCM and FM to identify dead cells with compromised plasma membranes [33] [4]. |
| Fluorescein Diacetate (FDA) | A cell-permeant dye converted by live-cell esterases into fluorescent fluorescein, marking viable cells. Primarily used in the FM protocol [4]. |
| Annexin V-FITC | Binds to phosphatidylserine (PS), which is externalized to the outer leaflet of the plasma membrane during early apoptosis. Used in the multiparametric FCM panel [33] [4]. |
| Hoechst 33342 | A cell-permeant nuclear stain used in the FCM panel to identify nucleated cells and aid in gating [33]. |
| DiIC1(5) | A carbocyanine dye that accumulates in mitochondria based on the mitochondrial membrane potential, serving as an indicator of cell health in the FCM assay [33]. |
Experimental Workflow for Comparative Viability Analysis
The diagram below illustrates the logical workflow and decision-making process for a side-by-side comparison of flow cytometry and fluorescence microscopy for cell viability assessment, as described in the foundational study.
Advanced Techniques and Future Directions
The field of flow cytometry is evolving rapidly. Spectral flow cytometry is a significant advancement that addresses many limitations of conventional FCM. Unlike conventional cytometers, which use optical filters to direct specific wavelengths to detectors, spectral cytometers capture the full emission spectrum of every fluorophore [3]. This is achieved using a prism or diffraction grating and an array of detectors [3]. The primary advantage is a massive increase in the number of parameters that can be measured simultaneously (up to 40+ colors) without significant optical complexity [3]. This technology also simplifies panel design by allowing the use of fluorophores with highly overlapping emission spectra, as sophisticated "spectral unmixing" algorithms can distinguish them based on their unique full-spectrum fingerprints [3].
Another frontier is imaging flow cytometry (IFC), which merges the high-throughput capability of FCM with the morphological insight of FM. The latest IFC systems, such as those based on optical time-stretch (OTS) imaging, have achieved groundbreaking throughputs exceeding 1,000,000 events per second while maintaining sub-micron resolution [8]. This allows for the high-speed capture of individual cell images, enabling analysis based not only on fluorescence intensity but also on cell morphology, texture, and spatial relationships within the cell [8] [1].
The comparative analysis demonstrates that while fluorescence microscopy and flow cytometry are strongly correlated for viability assessment, flow cytometry provides superior sensitivity, statistical power, and the critical ability to distinguish between different modes of cell death. For research requiring precise, high-throughput, and multiparametric analysis of cell populations, particularly under conditions of cytotoxic stress, flow cytometry is the more robust tool. However, this power comes with a need for meticulous attention to potential pitfalls like weak signals and high background. By applying the systematic troubleshooting and optimization protocols outlined in this guide, researchers can reliably generate high-quality FCM data, thereby strengthening the validity of their findings in biomaterial evaluation and drug development.
Optimizing Antibody Titration and Fluorochrome Selection
In biomedical research, particularly in cell viability assessment for biomaterial testing, the choice between flow cytometry (FCM) and fluorescence microscopy (FM) significantly impacts experimental outcomes. Both techniques rely on fluorescent detection but differ fundamentally in approach: FM provides spatial context through direct imaging, while FCM offers high-throughput, multiparametric single-cell analysis [33]. A recent 2025 comparative study highlights that although both methods show strong correlation (r = 0.94) in assessing bioactive glass cytotoxicity, FCM demonstrates superior sensitivity in detecting subtle viability changes, especially under high cytotoxic stress [29] [4]. This technical guide examines the optimization principles for antibody titration and fluorochrome selection within this methodological context, providing researchers with evidence-based protocols to enhance data quality in cell viability assessment.
Quantitative Comparison: Flow Cytometry Versus Fluorescence Microscopy
Recent comparative research directly evaluating both techniques for cell viability assessment reveals significant differences in performance characteristics and output data.
Table 1: Quantitative Comparison of Cell Viability Assessment Techniques
| Parameter | Fluorescence Microscopy (FM) | Flow Cytometry (FCM) |
|---|---|---|
| Viability Detection Range | 9-10% (for <38µm particles at 100 mg/mL) [4] | 0.2-0.7% (for <38µm particles at 100 mg/mL) [29] [4] |
| Control Viability | >97% [4] | >97% [33] |
| Cell Death Differentiation | Basic live/dead distinction (FDA/PI staining) [33] | Multiparametric analysis (viable, apoptotic, necrotic) [29] [4] |
| Statistical Correlation | r = 0.94 with FCM data [29] | R² = 0.8879 with FM data [29] |
| Throughput Capabilities | Limited by field of view and manual analysis [33] | High-throughput (>10,000 cells/second) [8] [3] |
| Sensitivity in High Cytotoxic Stress | Limited detection of subtle variations [4] | Superior precision and detection sensitivity [29] [4] |
The data demonstrates that while both techniques identify the same trends (smaller particles and higher concentrations cause greater cytotoxicity), FCM provides significantly enhanced resolution, particularly in detecting rare populations and distinguishing between apoptosis and necrosis [29] [33] [4]. This capability stems from FCM's multiparametric staining approaches using combinations of Hoechst, DiIC1, Annexin V-FITC, and PI, compared to the basic FDA/PI staining typically used in FM [33].
Experimental Protocols for Method Comparison
Cytotoxicity Assessment Protocol
The foundational study comparing FCM and FM employed a standardized protocol for evaluating bioactive glass cytotoxicity [29] [33]:
- Cell Culture: SAOS-2 osteoblast-like cells maintained under standard conditions
- Treatment Conditions: Bioglass 45S5 particles in three size ranges (<38 µm, 63-125 µm, 315-500 µm) at concentrations of 25, 50, and 100 mg/mL for 3 and 72 hours
- Viability Staining:
- FM: FDA/PI staining to distinguish viable and nonviable cells
- FCM: Multiparametric staining (Hoechst, DiIC1, Annexin V-FITC, and PI) to classify viable, apoptotic, and necrotic populations
- Analysis:
- FM: Manual counting or image analysis of multiple fields
- FCM: Automated analysis of >10,000 events per sample
This protocol confirmed a strong correlation between methods but highlighted FCM's enhanced sensitivity, particularly for detecting early apoptotic events and under conditions of high cytotoxic stress where viability plummeted to 0.2% with FCM compared to 9% with FM [29] [4].
Antibody Titration Protocol for Flow Cytometry
Optimal antibody titration is critical for achieving high-resolution data in flow cytometry. The following protocol adapts best practices for cell viability assessment [44]:
Preparation:
- Determine antibody stock concentration from product sheet
- Prepare cells (PBMCs or relevant cell line) at 2 × 10ⶠcells/mL in staining buffer
- Use 96-well V-bottom plates for serial dilutions
Dilution Scheme:
- For antibodies with mg/mL concentration: start at 1000 ng/test in 200µL final volume
- For antibodies with µL/test recommendations: start at double the recommended volume in 300µL
- Perform 8-12 point 2-fold serial dilutions
- Add 100µL cell suspension to each well
Staining Procedure:
- Incubate 20 minutes at room temperature in dark
- Centrifuge 5 minutes at 400×g, decant supernatant
- Wash twice with 200µL staining buffer
- Resuspend in appropriate volume for acquisition
Optimal Titer Determination: Identify the concentration providing highest signal-to-noise ratio by plotting positive cell percentage and fluorescence intensity against concentration [44].
Diagram 1: Antibody Titration Workflow
Fluorochrome Selection Guidelines
Core Principles for Fluorochrome Selection
Effective fluorochrome selection requires consideration of multiple factors to ensure optimal signal detection and minimal interference:
- Microscope Compatibility: Verify excitation and emission spectra align with your instrument's laser lines and filter sets. A 525/50 bandpass filter (FITC filter) can also detect Alexa Fluor 488, GFP, and DyLight 488 with similar emission maxima [45].
- Target Abundance Matching: Assign bright fluorophores to low-abundance antigens and dimmer fluorophores to highly expressed targets. Fluorophore brightness is determined by extinction coefficient (probability of absorbing photons) and quantum yield (photons emitted per absorbed photon) [45] [46].
- Photostability Considerations: Select modern dye families (Alexa Fluor, DyLight, StarBright) over conventional fluorophores (FITC, R-Phycoerythrin) that are susceptible to photobleaching and environmental factors [45] [47].
- Spectral Overlap Management: Use spectral viewers to visualize excitation and emission spectra during selection to minimize bleed-through between channels [45] [48].
- Experimental Control Inclusion: Include biological controls, background staining controls, and secondary antibody-only controls to verify specificity [45].
Fluorochrome Selection for Multiplexed Panels
For multicolor experiments, additional considerations become critical:
- Spectral Separation: Choose fluorophores with distinct emission peaks that can be differentiated by your detection system [48].
- Tandem Dye Considerations: Tandem dyes (e.g., PE-Cy7) combine donor and acceptor fluorophores through FRET, creating expanded emission separation but requiring careful handling as they are susceptible to photobleaching and batch-to-batch variation [48].
- Counterstain Compatibility: Ensure nuclear counterstains (DAPI, Hoechst) are spectrally distinct from other fluorophores in your panel [45].
Diagram 2: Fluorochrome Selection Methodology
Advanced Techniques and Emerging Technologies
Spectral Flow Cytometry
Spectral flow cytometry represents a significant advancement over conventional flow cytometry by capturing the full emission spectrum of fluorophores across a wide wavelength range (typically 32-73 detection channels) rather than using traditional bandpass filters [3]. This approach enables:
- Enhanced Multiplexing: Resolution of fluorophores with highly overlapping emission spectra through spectral unmixing algorithms
- Increased Panel Size: Simultaneous detection of 40+ parameters in a single sample
- Reduced Optical Complexity: Elimination of complex filter configurations through detector arrays [3]
Spectral systems maintain the high-throughput advantages of conventional FCM (>10,000 events per second) while dramatically expanding multiplexing capabilities [3].
Imaging Flow Cytometry
The integration of imaging capabilities with high-throughput flow cytometry has led to the development of imaging flow cytometry (IFC), which combines the morphological assessment of microscopy with the statistical power of flow cytometry [8]. Recent advancements in optofluidic time-stretch (OTS) IFC have pushed throughput boundaries to unprecedented levels exceeding 1,000,000 events per second while maintaining sub-micron resolution [8]. This technology enables high-resolution morphological analysis of extremely rare cell populations in large samples.
Research Reagent Solutions
Table 2: Essential Research Reagents for Flow Cytometry and Fluorescence Microscopy
| Reagent Category | Specific Examples | Function and Application |
|---|---|---|
| Viability Stains | FDA/PI, Hoechst, DiIC1, Annexin V-FITC [29] [33] | Distinguish live/dead cells and apoptotic stages |
| Bright Fluorophores | Alexa Fluor 647, PE, DyLight 650 [45] [46] | Detect low-abundance targets |
| Photostable Dyes | StarBright, Alexa Fluor, DyLight [45] [47] | Maintain signal integrity during prolonged imaging |
| Tandem Dyes | PE-Cy7, PerCP-Cy5.5 [48] | Expand panel size through FRET-based emission shifting |
| Validation Reagents | Posibeads, F(ab')â‚‚ fragments [47] | Verify antibody function and reduce Fc receptor binding |
| Cell Preparation | Fc receptor blocking agents, fixation buffers [44] | Reduce background and preserve cell morphology |
Optimizing antibody titration and fluorochrome selection requires method-specific considerations that align with the broader methodological choice between flow cytometry and fluorescence microscopy. While fluorescence microscopy provides valuable spatial context and remains accessible for basic viability assessment, flow cytometry offers superior sensitivity, multiparametric capability, and statistical power for comprehensive cell death analysis [29] [33] [4]. The emerging technologies of spectral flow cytometry and high-throughput imaging flow cytometry further expand these capabilities, enabling increasingly sophisticated experimental designs [8] [3]. By implementing the detailed protocols and selection guidelines presented in this technical guide, researchers can significantly enhance data quality and reproducibility in cell viability assessment and broader immunophenotyping applications.
In the comparative analysis of cell viability assessment techniques, particularly between flow cytometry and fluorescence microscopy, the implementation of robust experimental controls is fundamental to generating reliable, interpretable data. While both techniques utilize fluorescent probes to discern cellular states, their technical approaches—high-throughput single-cell analysis versus direct visual assessment—demand tailored control strategies. Critical controls, including viability stains, fluorescence-minus-one (FMO), and isotype controls, serve as the foundation for validating staining specificity, identifying spectral overlap, and accurately gating cell populations. For researchers and drug development professionals, selecting the appropriate controls is not merely a technical formality but a critical decision that directly impacts data integrity, especially when differentiating subtle cellular responses in complex experimental systems like biomaterial cytotoxicity assessments [33] [4]. This guide objectively compares the application and performance of these essential controls within the context of viability assessment, providing a structured framework for their implementation.
Experimental Comparison: Flow Cytometry versus Fluorescence Microscopy
A direct comparative study investigating the cytotoxicity of bioactive glass (Bioglass 45S5) on SAOS-2 osteoblast-like cells provides quantitative data on the performance differences between fluorescence microscopy (FM) and flow cytometry (FCM) [33] [29] [4]. The experimental design exposed cells to BG particles of varying sizes (< 38 µm, 63–125 µm, and 315–500 µm) and concentrations (25, 50, and 100 mg/mL) for 3 and 72 hours.
Table 1: Summary of Experimental Staining Protocols
| Technique | Viability Staining Method | Apoptosis/Necrosis Discrimination | Key Staining Reagents |
|---|---|---|---|
| Fluorescence Microscopy | FDA (fluorescein diacetate) and PI (propidium iodide) [33] [4] | No distinction between apoptotic and necrotic death | FDA, PI |
| Flow Cytometry | Multiparametric panel: Hoechst, DiIC1, Annexin V-FITC, and PI [33] [4] | Yes; distinguishes viable, early apoptotic, late apoptotic, and necrotic populations | Hoechst, DiIC1, Annexin V-FITC, PI |
The data, summarized in Table 2, reveal a strong correlation between the two techniques (r = 0.94, R² = 0.8879, p < 0.0001), validating both as viable assessment tools. However, flow cytometry demonstrated superior precision and sensitivity, particularly under high cytotoxic stress. For instance, with the most cytotoxic particles (< 38 µm at 100 mg/mL), FM reported viabilities of 9% (3h) and 10% (72h), while FCM detected more extreme viabilities of 0.2% and 0.7%, respectively [33] [4]. The key differentiator was FCM's ability, via its multiparametric staining panel, to resolve early and late apoptotic events—a nuance FM cannot capture with simple live/dead stains [4].
Table 2: Comparative Viability Results from BG Cytotoxicity Study
| Particle Size & Concentration | Exposure Time | Viability by FM (FDA/PI) | Viability by FCM (Multiparametric) |
|---|---|---|---|
| Control | 3 h & 72 h | > 97% | > 97% |
| < 38 µm at 100 mg/mL | 3 h | 9% | 0.2% |
| < 38 µm at 100 mg/mL | 72 h | 10% | 0.7% |
Detailed Methodologies for Key Experiments
Fluorescence Microscopy Viability Protocol
The FM protocol utilized a binary live/dead staining approach. Cells were stained with fluorescein diacetate (FDA) and propidium iodide (PI) [4]. Viable cells with active esterases convert non-fluorescent FDA into green fluorescent fluorescein, while PI, a nucleic acid stain, only penetrates cells with compromised plasma membranes, producing red fluorescence. Cells were visualized using a conventional widefield fluorescence microscope, and viability was determined by manually or digitally counting the ratio of green (live) to red (dead) cells from several fields of view [33]. This method is limited by a shallow depth of field, potential for photobleaching, and an inability to distinguish stages of cell death [33].
Multiparametric Flow Cytometry Viability Protocol
The FCM protocol employed a multi-dye panel for a more nuanced analysis [33] [4]. The staining and analysis workflow is as follows:
This protocol's power lies in its multi-parameter nature. Hoechst identifies nucleated cells. DiIC1 assesses mitochondrial membrane potential, an indicator of cellular health. Annexin V-FITC binds to phosphatidylserine (PS), which is externalized in early apoptosis. PI indicates loss of plasma membrane integrity, characteristic of late apoptosis and necrosis. The combination of these signals allows for precise discrimination of cell states [4]. The use of FMO controls for Annexin V and PI is critical here to accurately set the boundaries between negative and positive populations.
The Scientist's Toolkit: Essential Research Reagent Solutions
Successful cell analysis relies on a suite of essential reagents, each serving a specific function to ensure data accuracy.
Table 3: Key Research Reagent Solutions for Cell Viability Analysis
| Reagent Category | Specific Examples | Primary Function | Key Considerations |
|---|---|---|---|
| Viability Dyes (DNA-binding) | Propidium Iodide (PI), 7-AAD, DAPI [49] | Penetrate cells with compromised membranes, staining nucleic acids; exclude from viable cells. | Cannot be used with intracellular staining protocols requiring fixation/permeabilization [49]. |
| Viability Dyes (Amine-reactive) | Live/Dead Fixable Stains [49] | Bind to free amines in proteins; penetrate compromised membranes of dead cells. | Compatible with subsequent fixation/permeabilization steps, unlike DNA-binding dyes [49]. |
| Viability Dyes (Vital) | Calcein-AM, FDA [33] [4] | Enzymatically converted in viable cells to produce fluorescent products. | Require functional esterases and intact cells; must be used prior to fixation [49]. |
| Apoptosis Markers | Annexin V (conjugated to FITC, etc.) [33] [4] | Binds to phosphatidylserine (PS) exposed on the outer leaflet of the cell membrane during early apoptosis. | Requires calcium-containing buffer and careful timing, as necrosis also results in PS exposure. |
| Isotype Controls | Host- and isotope-matched non-specific antibodies [50] | Estimate non-specific, Fc-mediated, or "sticky" antibody binding. | Must match the specific antibody's host species, isotype, fluorochrome, and F:P ratio to be meaningful [50]. |
| Compensation Beads | Anti-immunoglobulin Capture Beads [49] | Used to calculate compensation matrices and correct for spectral spillover in flow cytometry. | Must be matched to the animal source of the antibody; cannot be used with non-antibody reagents [49]. |
A Practical Guide to Critical Controls
The logic for selecting and applying the three critical controls based on experimental needs can be summarized as follows:
Viability Stains
The primary function of a viability dye is to identify and subsequently exclude dead cells from analysis. This is critical because dead cells non-specifically bind antibodies, leading to false-positive results and inaccurate data interpretation [50]. The choice of dye depends on the experimental protocol. For simple live/dead discrimination in assays without fixation, DNA-binding dyes like PI are sufficient [49] [4]. However, for intracellular staining requiring fixation and permeabilization, amine-reactive viability dyes are essential, as they remain covalently bound to the cells after these harsh processing steps [49].
Fluorescence-Minus-One (FMO) Controls
FMO controls are indispensable for establishing correct gating boundaries in multicolor flow cytometry experiments. An FMO control contains all antibodies in the panel except for one, allowing researchers to visualize the background fluorescence and "spillover" from all other fluorochromes into the channel of interest [50]. This is particularly important for markers with continuous expression or low fluorescence intensity, where the positive and negative populations are not clearly separated. FMO controls provide a more rigorous and accurate method for setting positive gates than isotype controls, especially for identifying dimly positive populations [50].
Isotype Controls
Isotype controls are designed to measure the level of non-specific antibody binding resulting from Fc receptor interactions or other non-epitope-driven stickiness [50]. The ideal isotype control should be matched to the primary antibody in terms of host species, immunoglobulin isotype and subclass, fluorochrome, and fluorochrome-to-protein (F:P) ratio. However, achieving this ideal is often impractical in reality. Consequently, the field is increasingly moving beyond their use for setting positivity gates. Isotype controls are best used as a qualitative tool to demonstrate that blocking steps (e.g., using Fc receptor blocking reagents) have been effective in minimizing background staining. They should not be used to subtract background or mathematically "correct" data [50].
In the direct comparison of flow cytometry and fluorescence microscopy for viability assessment, flow cytometry's capacity for multiparametric analysis provides deeper insights into the mechanisms of cell death. However, the reliability of data generated by either technique is contingent on the stringent application of critical controls. Viability stains are non-negotiable for eliminating dead cell artifacts. FMO controls are the gold standard for accurate gating in multicolor panels, while isotype controls serve a more limited role in monitoring background staining. For researchers aiming to produce robust, reproducible, and interpretable data in drug development and biomaterial testing, a strategic combination of these controls, tailored to the specific technology and experimental question, is fundamental to success.
Strategies to Minimize Autofluorescence and Dead Cell Interference
In cell viability assessment, autofluorescence and dead cell interference are significant sources of error that can compromise data accuracy. Autofluorescence, the background fluorescence emitted naturally by cells or biomaterials, can obscure specific signals from fluorescent labels [51]. Meanwhile, dead cells can bind dyes and antibodies non-specifically, leading to false positives [52]. The choice of analytical technique—flow cytometry (FCM) or fluorescence microscopy (FM)—profoundly influences how researchers can identify and mitigate these challenges. This guide objectively compares the performance of FCM and FM in managing these interferences, supported by experimental data and detailed protocols.
Technical Comparison: Flow Cytometry vs. Fluorescence Microscopy
The table below summarizes the core technical capabilities of FCM and FM in the context of interference management.
| Feature | Flow Cytometry (FCM) | Fluorescence Microscopy (FM) |
|---|---|---|
| Interference Identification | Directly measures autofluorescence in unstained controls; uses scatter parameters to gate out debris [52]. | Relies on visual identification; background fluorescence can obscure specific signals, making quantification difficult [19] [51]. |
| Dead Cell Exclusion | Robust; uses cell-impermeable dyes (e.g., PI, 7-AAD) to positively identify and gate out dead cells during analysis [19] [52]. | Qualitative; dead cells are stained but not easily excluded from quantification, potentially skewing results [19]. |
| Throughput & Statistical Power | High; rapidly analyzes tens of thousands of cells, providing robust statistical data and revealing rare cell populations [4] [53]. | Low; typically analyzes tens to hundreds of cells, prone to sampling bias and limited statistical power [19] [53]. |
| Spatial Context | None; cells are in suspension, so information on cell morphology and interaction with biomaterials is lost [53]. | Excellent; provides direct visualization of cell location, morphology, and interaction with scaffolds or other cells [54] [53]. |
| Multiparametric Analysis | Excellent; can simultaneously measure multiple viability and apoptosis markers (e.g., Annexin V, PI) for deep subpopulation analysis [19] [4]. | Limited; typically restricted to 1-2 markers (e.g., live/dead) due to spectral overlap, hindering complex phenotype distinction [19]. |
Experimental Data: A Comparative Study
A 2025 study directly compared FCM and FM for assessing the cytotoxicity of bioactive glass (Bioglass 45S5) on SAOS-2 osteoblast-like cells, a context where autofluorescence from biomaterials can be a significant issue [19] [4].
Key Experimental Findings
The study exposed cells to particles of different sizes and concentrations. Both techniques confirmed that smaller particles and higher concentrations caused greater cytotoxicity. However, the methods reported different viability percentages under high-stress conditions, highlighting FCM's superior sensitivity [19] [4].
Table: Measured Cell Viability (%) under High Cytotoxic Stress (<38 µm particles at 100 mg/mL)
| Time Point | Fluorescence Microscopy (FM) | Flow Cytometry (FCM) |
|---|---|---|
| 3 hours | 9% | 0.2% |
| 72 hours | 10% | 0.7% |
Despite the difference in absolute values, a strong correlation was found between the datasets (r = 0.94, R² = 0.8879, p < 0.0001) [19] [4]. Crucially, FCM's multiparametric staining (Hoechst, DiIC1, Annexin V-FITC, PI) allowed it to distinguish between viable, early apoptotic, late apoptotic, and necrotic cells, providing a more nuanced understanding of cell death mechanisms than FM's simple live/dead classification [19] [4].
Experimental Protocols for Interference Management
Protocol 1: Flow Cytometry for Viability and Apoptosis
This protocol is designed to minimize interference through robust controls and multiparametric staining [19] [52].
- Sample Preparation: Create a single-cell suspension. Include an unstained control to measure autofluorescence and a viability dye-only control (e.g., PI) to set compensation and gating [52].
- Fc Receptor Blocking: Incubate cells with an FcR blocking reagent to reduce non-specific antibody binding, especially in immune cells [52].
- Staining: Stain cells with a cocktail containing:
- Hoechst 33342: Stain for 10-15 minutes at 37°C to label all nuclei.
- Annexin V-FITC: Stain in a calcium-containing binding buffer for 15 minutes at room temperature (protected from light) to detect phosphatidylserine exposure (early apoptosis).
- Propidium Iodide (PI): Add just before acquisition to label dead/late apoptotic cells with compromised membranes.
- DiIC1(5): A mitochondrial dye to assess membrane potential, added according to manufacturer's instructions [19].
- Data Acquisition & Analysis: Run samples on the flow cytometer. Use the unstained control to set voltages and the single-stained controls for spectral compensation. Gate on intact cells (using FSC-A/SSC-A), then exclude dead cells (PI-positive) from further analysis of viable and early apoptotic populations [52].
Protocol 2: Fluorescence Microscopy with Autofluorescence Quenching
This protocol enhances FM image quality by chemically suppressing background autofluorescence [54] [51].
- Sample Preparation: Culture cells on coverslips or autofluorescent polymer scaffolds (e.g., PCL, PLGA).
- Pre-culture Autofluorescence Quenching (for polymer scaffolds):
- Prepare a 0.3% (w/v) Sudan Black B (SBB) solution in 70% ethanol.
- Immerse the sterile scaffolds in the SBB solution for 30-60 minutes at room temperature.
- Wash the scaffolds thoroughly with phosphate-buffered saline (PBS) to remove excess dye before cell seeding. This pre-treatment suppresses autofluorescence for up to 28 days without affecting cell viability [54].
- Post-fixation Autofluorescence Quenching (for cells/tissues):
- After cell fixation and staining, incubate samples with a commercial quencher like TrueBlack Lipofuscin Autofluorescence Quencher (diluted 1:50 in PBS) for 30-90 seconds.
- Rinse gently with PBS before mounting. This treatment can reduce autofluorescence intensity by 89-93% [51].
- Staining and Imaging: Perform standard immunofluorescence or live/dead staining (e.g., Calcein-AM for live cells, PI for dead cells). Acquire images using a fluorescence microscope, ensuring the same exposure settings are used for treated and control samples.
Essential Reagent Solutions for Reliable Assays
The table below lists key reagents for managing autofluorescence and dead cell interference.
| Reagent/Solution | Function | Example Application |
|---|---|---|
| Sudan Black B (SBB) | Chemical quencher of broad-spectrum autofluorescence from polymers and lipids [54] [51]. | Pre-treatment of PCL scaffolds before cell seeding to suppress background [54]. |
| TrueBlack Lipofuscin Autofluorescence Quencher | Commercial reagent specifically designed to quench lipofuscin-like autofluorescence in tissues [51]. | Post-fixation treatment of adrenal cortex tissue sections to improve signal-to-noise ratio [51]. |
| Propidium Iodide (PI) | Cell-impermeable DNA dye that labels nuclei of dead cells with compromised membranes [19] [52]. | Used in both FCM and FM to identify and gate out dead cells. |
| Annexin V-FITC | Binds to phosphatidylserine exposed on the outer leaflet of the cell membrane during early apoptosis [19]. | Used in FCM multiparametric panels to distinguish apoptosis from necrosis. |
| Fc Receptor Blocking Reagent | Reduces non-specific binding of antibodies to Fc receptors on immune cells [52]. | Incubation step prior to antibody staining in FCM to minimize false positives. |
| Compensation Beads | Uniform beads used to create single-color controls for accurate spectral compensation in multicolor FCM panels [52]. | Essential for setting up FCM experiments with multiple fluorophores. |
| Time-Gated Imaging Dyes (e.g., ADOTA) | Fluorophores with long lifetimes (~15 ns); allow separation from short-lived autofluorescence via time-gated detection [55]. | Advanced microscopy to eliminate over 96% of autofluorescence by collecting light after a delay [55]. |
Both flow cytometry and fluorescence microscopy are invaluable for cell viability assessment, but their effectiveness in managing autofluorescence and dead cell interference differs significantly. Flow cytometry offers a more robust, quantitative, and high-throughput solution. Its strengths lie in its ability to systematically measure and gate out autofluorescence, precisely exclude dead cells from analysis, and provide a detailed, multiparametric view of cell health. Fluorescence microscopy provides essential spatial context and is improved by chemical quenchers like Sudan Black B, but it remains more susceptible to qualitative bias and offers less statistical power.
The choice between them should be guided by experimental priorities: FCM for high-precision, high-throughput quantification of cell viability and death pathways, and FM for morphological analysis and visualizing cell-material interactions, especially when coupled with effective autofluorescence quenching protocols.
Data-Driven Decision Making: A Direct Comparison of Sensitivity and Precision
In the field of biomaterial research and drug development, accurately assessing cell viability is paramount for evaluating material biocompatibility and treatment efficacy. Two predominant techniques—flow cytometry (FCM) and fluorescence microscopy (FM)—are routinely employed for this purpose. Understanding their comparative performance through quantitative statistical measures, including correlation coefficients and significance testing, provides critical insights for researchers selecting the most appropriate methodology. This guide objectively examines the experimental data quantifying the relationship between these techniques, offering a rigorous statistical framework for their comparison.
Experimental Protocols for Direct Comparison
To ensure a valid performance comparison, studies must implement controlled experimental designs where both techniques analyze the same biological system under identical conditions.
Biomaterial Cytotoxicity Assessment
A 2025 study directly compared FCM and FM for assessing the cytotoxicity of Bioglass 45S5 (BG) on SAOS-2 osteoblast-like cells, providing a robust dataset for correlation analysis [19].
- Cell Culture Model: Human osteosarcoma cell line (SAOS-2), known for its mature osteoblast-like phenotype [19].
- Cytotoxic Stimulus: BG particles of three size ranges (<38 µm, 63–125 µm, and 315–500 µm) at concentrations of 25, 50, and 100 mg/mL. Exposure times were 3 and 72 hours to capture early and late responses [19].
- Staining Protocols:
- Fluorescence Microscopy (FM): Cells were stained with Fluorescein Diacetate (FDA) and Propidium Iodide (PI). FDA is metabolized by live cells to generate green fluorescence, while PI enters dead cells with compromised membranes and intercalates into DNA, emitting red fluorescence [4].
- Flow Cytometry (FCM): A multiparametric staining panel was employed for deeper cell state classification. This included Hoechst (nuclear stain), DiIC1 (membrane potential dye), Annexin V-FITC (binds to phosphatidylserine exposed on the surface of apoptotic cells), and PI (necrosis marker). This panel enables the distinction between viable, early apoptotic, late apoptotic, and necrotic cell populations [19] [4].
Automated vs. Manual Viability Counting
An earlier study (2011) compared an automated microscopic cell counter against both the conventional manual trypan blue exclusion method and flow cytometry, establishing a precedent for methodological correlation [39].
- Sample Preparation: Mononuclear cells (MNCs) were isolated from human blood. To create a viability gradient, viable cells were serially diluted with heat-killed non-viable cells to achieve expected viability levels from 1% to 100% [39].
- Staining and Analysis:
- Manual Trypan Blue: Cells mixed with trypan blue dye and counted on a hemocytometer under a light microscope. Dead cells uptake the blue dye [39].
- Flow Cytometry: Cells stained with Propidium Iodide (PI) and analyzed on a flow cytometer [39].
- Automated Microscopic Counter: Cells were stained with PI and loaded into a microchip. A tabletop inverted microscope system automatically captured fluorescent images and counted viable and non-viable cells based on PI signal [39].
Quantitative Performance Data and Statistical Correlation
The core of the performance comparison lies in the quantitative analysis of the data generated by the two techniques.
The following table synthesizes the major quantitative findings from the comparative studies, highlighting the statistical relationship between FCM and FM.
| Performance Metric | Flow Cytometry (FCM) | Fluorescence Microscopy (FM) | Statistical Correlation & Significance |
|---|---|---|---|
| Viability Measurement (BG 45S5) | Reported ~0.2-0.7% viability for <38µm particles at 100 mg/mL [19] [4] | Reported ~9-10% viability for same conditions [19] [4] | Strong correlation:r = 0.94, R² = 0.8879, p < 0.0001 [19] [4] |
| Precision (CV%) | Superior precision, especially under high cytotoxic stress [19] | Lower precision due to smaller cell count and sampling bias [19] | Not directly compared via a single statistic, but FCM's higher cell count implies greater statistical power [19]. |
| Cell State Discrimination | Can distinguish viable, early/late apoptotic, and necrotic populations [19] [4] | Typically dichotomizes into live/dead states only [4] | FCM provides qualitatively superior, multi-parametric data that FM cannot replicate [19]. |
| Linearity (Automated vs. FCM) | Reference method [39] | Automated microscopic counter showed excellent agreement with FCM [39] | Strong correlation:r = 0.99, p < 0.05 [39] |
Detailed Correlation Data from Comparative Studies
The table below expands on the correlation data, providing context from multiple experimental setups.
| Comparison | Experimental Context | Correlation Coefficient (r) | Coefficient of Determination (R²) | p-value |
|---|---|---|---|---|
| FCM vs. FM (BG 45S5) [19] [4] | Viability of SAOS-2 cells after exposure to particulate bioactive glass | 0.94 | 0.8879 | < 0.0001 |
| Automated Microscopy vs. FCM [39] | Viability of human mononuclear cells across a dilution series | 0.99 | - | < 0.05 |
| Automated Microscopy vs. Manual Trypan Blue [39] | Viability of human mononuclear cells across a dilution series | 0.99 | - | < 0.05 |
Visualizing Experimental Workflows and Decision Pathways
To better understand the experimental flow and the decision process behind choosing a technique, the following diagrams outline the key procedures and logical considerations.
Experimental Workflow for Direct Comparison
Technique Selection Decision Pathway
Essential Research Reagent Solutions
The execution of these viability assays relies on a suite of critical reagents and materials. The table below details key solutions used in the featured experiments.
| Research Reagent / Material | Function in Viability Assessment | Experimental Context |
|---|---|---|
| Propidium Iodide (PI) | DNA-binding dye that stains nuclei of dead cells with compromised membranes; indicates necrosis [19] [39]. | Used in both FCM and FM protocols as a core dead cell marker [19] [4] [39]. |
| Fluorescein Diacetate (FDA) | Cell-permeant esterase substrate metabolized in live cells to fluorescent fluorescein; indicates viability [4]. | Used in FM protocols alongside PI for live/dead staining [4]. |
| Annexin V-FITC | Binds to phosphatidylserine (PS) exposed on the outer leaflet of the cell membrane during early apoptosis [19]. | Used in multiparametric FCM panels to distinguish apoptotic from necrotic cell death [19] [4]. |
| Hoechst Stains | Cell-permeant blue fluorescent dyes that bind DNA in live and dead cells; used as a nuclear counterstain [19]. | Employed in FCM for identifying nucleated cells and analyzing cell cycle [19] [56]. |
| Bioglass 45S5 Particles | Model particulate biomaterial used to induce a controlled, size- and dose-dependent cytotoxic stimulus [19]. | Critical for creating a gradient of cell viability to test the sensitivity and dynamic range of the assessment techniques [19]. |
| Microchip / Microchannel | Disposable device with microfluidic channels for automated cell loading and imaging [39]. | Used in automated microscopic counters to improve precision and throughput over manual hemocytometers [39]. |
The strong statistical correlation (r = 0.94, p < 0.0001) between flow cytometry and fluorescence microscopy confirms that both are valid techniques for cell viability assessment in biomaterial research [19] [4]. The choice between them, therefore, is not a question of absolute accuracy but of experimental requirements. Flow cytometry demonstrates superior performance for high-throughput, quantitative studies requiring precise statistical power and deep cell state phenotyping, such as distinguishing stages of apoptosis. Its higher sensitivity is evident in more extreme cytotoxic conditions [19]. Fluorescence microscopy remains a vital tool for studies where direct visual confirmation, morphological context, and spatial information are paramount, albeit with lower throughput and statistical precision [19] [1]. Ultimately, the selection should be guided by the specific research question, with the understanding that the techniques are often complementary.
In the critical field of biomaterial cytotoxicity assessment, the choice of analytical technique can profoundly influence experimental outcomes and subsequent safety evaluations. A seminal 2025 comparative study examining cell viability after exposure to particulate bioactive glass revealed a striking discrepancy: fluorescence microscopy (FM) reported 9% viability while flow cytometry (FCM) detected a mere 0.2% under identical conditions [19] [4]. This order-of-magnitude difference underscores a significant sensitivity gap between two widely employed methodologies. This guide objectively compares the performance of flow cytometry and fluorescence microscopy for cell viability assessment, providing researchers with experimental data and methodological details to inform their technical selections for preclinical biomaterial evaluation.
Reliable in vitro cytotoxicity assessment is fundamental to preclinical evaluation of biomaterials, with accurate cell viability measurement being a cornerstone metric [19]. Fluorescence microscopy and flow cytometry represent two pillars of cell viability analysis, each with distinct operational principles, capabilities, and limitations. While both techniques utilize fluorescent staining to distinguish viable cells, their analytical approaches differ significantly—FM provides direct morphological visualization while FCM offers high-throughput, single-cell quantification [19].
The observed discrepancy in viability readings (0.2% vs. 9%) highlights a critical methodological concern in particulate biomaterial research, where material-induced interference can compromise analytical accuracy [4]. This comparison guide delves into the experimental conditions underlying this dramatic difference, providing researchers with a comprehensive framework for selecting the appropriate viability assessment technique based on their specific research requirements, material properties, and desired analytical depth.
Experimental Comparison: Methodology and Design
Core Experimental Setup
The comparative data presented herein originates from a controlled investigation utilizing Bioglass 45S5 (BG) particles and SAOS-2 osteoblast-like cells to generate a cytotoxicity gradient [19] [4]. The experimental design varied three key parameters to assess technique performance across different cytotoxic stressors:
- Particle Size Ranges: <38 µm, 63–125 µm, and 315–500 µm
- BG Concentrations: 25, 50, and 100 mg/mL
- Exposure Timepoints: 3 hours and 72 hours
This structured approach enabled direct comparison of FM and FCM under identical biological and material conditions, isolating technique performance as the primary variable [19].
Detection and Staining Protocols
Fluorescence Microscopy Method
The FM protocol employed FDA (fluorescein diacetate) and PI (propidium iodide) staining to differentiate viable and non-viable cells [4]. Metabolically active viable cells convert non-fluorescent FDA into green-fluorescent fluorescein, while PI only penetcells with compromised membranes, binding to DNA and emitting red fluorescence [57]. This dual-staining approach allows visual discrimination of live (green) versus dead (red) populations through microscopic imaging.
Flow Cytometry Method
The FCM approach utilized a sophisticated multiparametric staining panel including Hoechst (DNA content), DiIC1 (membrane potential), Annexin V-FITC (apoptosis marker), and PI (necrosis marker) [19] [4]. This comprehensive staining strategy enabled precise classification of cell populations beyond simple live/dead discrimination, distinguishing viable, early apoptotic, late apoptotic, and necrotic subpopulations through quantitative analysis of thousands of individual cells [4].
The workflow below illustrates the key experimental stages where methodological differences between FM and FCM emerge, contributing to the sensitivity gap.
Results: Quantitative Comparison of Viability Measurements
Dramatic Viability Discrepancy Under High Cytotoxic Stress
The most striking difference between techniques emerged under high cytotoxic stress conditions (<38 µm particles at 100 mg/mL). The table below summarizes the comparative viability measurements across critical experimental conditions [19] [4]:
Table 1: Comparative Viability Measurements (%) Between FM and FCM
| Condition | Time | FM Viability | FCM Viability | Discrepancy |
|---|---|---|---|---|
| <38 µm, 100 mg/mL | 3 h | 9% | 0.2% | 8.8 percentage points |
| <38 µm, 100 mg/mL | 72 h | 10% | 0.7% | 9.3 percentage points |
| Controls | Both | >97% | >97% | Minimal |
Despite this dramatic absolute difference, statistical analysis revealed a strong correlation (r = 0.94, R² = 0.8879, p < 0.0001) between the techniques across the entire dataset, indicating consistent directional trends despite varying absolute values [19] [4].
Technical Performance Specifications
Beyond specific viability measurements, each technique demonstrated distinct operational characteristics that contribute to their differential performance:
Table 2: Technical Specifications and Performance Characteristics
| Parameter | Fluorescence Microscopy | Flow Cytometry |
|---|---|---|
| Analytical Basis | Visual imaging of stained cells | Quantitative single-cell analysis |
| Throughput | Limited fields of view | High-throughput (thousands of cells/sec) |
| Cell State Discrimination | Binary (live/dead) | Multiparametric (viable, early/late apoptotic, necrotic) |
| Sample Preparation | Direct imaging possible | Requires single-cell suspension |
| Material Interference | Susceptible to biomaterial autofluorescence | Less affected by particulate interference |
| Data Output | Qualitative with quantitative potential | Fully quantitative with statistical robustness |
| Optimal Use Case | Initial screening, morphological context | Detailed mechanistic studies, high-precision quantification |
Mechanism of the Sensitivity Gap: Technical Foundations
Analytical Depth and Population Discrimination
The fundamental advantage of FCM lies in its multiparametric staining capacity, which enables discrimination of cellular states that FM categorizes uniformly as "dead" [4]. While FM with FDA/PI provides binary live/dead classification, FCM differentiates:
- Viable cells: Double negative for Annexin V and PI
- Early apoptotic cells: Annexin V positive, PI negative (intact membrane)
- Late apoptotic cells: Annexin V positive, PI positive
- Necrotic cells: Annexin V negative, PI positive [4]
This refined classification is particularly valuable under high cytotoxic stress, where cells undergo progressive degradation rather than immediate lysis.
Sampling Efficiency and Statistical Power
FCM analyzes significantly larger cell populations (typically thousands to tens of thousands of cells) compared to FM, which typically examines hundreds of cells across selected fields of view [19]. This comprehensive sampling reduces statistical variance and enhances detection of rare populations. In high-toxicity conditions where viable cells become exceptionally scarce, FCM's high-throughput capability provides the statistical power to accurately quantify these minimal populations [4].
Mitigation of Material Interference
Particulate biomaterials like Bioglass 45S5 present unique analytical challenges, including autofluorescence and light scattering that can interfere with fluorescence detection [19]. FCM's gating strategies can discriminate between cells and particulate matter based on light scattering properties, potentially reducing false positives that might occur in FM analysis of adherent cells surrounded by fluorescent particles [19].
The diagram below illustrates how the multiparametric approach of flow cytometry enables more precise cell state discrimination compared to fluorescence microscopy.
Essential Research Reagent Solutions
Successful implementation of either viability assessment technique requires appropriate selection of reagents and materials. The following table outlines key solutions employed in the referenced study and their functional significance:
Table 3: Essential Research Reagents for Cell Viability Assessment
| Reagent/Category | Function | Application Context |
|---|---|---|
| FDA (Fluorescein Diacetate) | Viability stain converted to green fluorescent product by cellular esterases | FM: Labels live cells [4] |
| Propidium Iodide (PI) | Membrane-impermeant DNA intercalator that labels dead cells | FM & FCM: Identifies cells with compromised membranes [4] |
| Calcein AM | Esterase substrate producing green fluorescence in viable cells | Alternative FM viability marker [57] |
| Annexin V-FITC | Binds phosphatidylserine externalized during apoptosis | FCM: Detects early apoptotic cells [4] |
| Hoechst Stains | Cell-permeant DNA binding dyes for nuclear staining | FCM: Identifies nucleated cells for accurate gating [4] |
| DiIC1 | Mitochondrial membrane potential indicator | FCM: Assesses metabolic status [4] |
| BG 45S5 Particles | Model particulate biomaterial inducing cytotoxicity | Test material generating viability gradient [19] |
| SAOS-2 Cell Line | Human osteosarcoma-derived osteoblast-like cells | Biologically relevant model for bone biomaterial testing [19] |
The dramatic viability discrepancy between fluorescence microscopy (9%) and flow cytometry (0.2%) under high cytotoxic stress conditions reveals fundamental differences in the sensitivity, specificity, and analytical depth of these widely employed techniques. While FM provides valuable morphological context and serves as an accessible screening tool, FCM offers superior quantitative precision, statistical power, and subpopulation discrimination—particularly valuable in high-stress environments where accurate viability assessment is most critical [19] [4].
These findings have profound implications for biomaterial safety assessment and regulatory evaluation. The demonstrated sensitivity gap suggests that flow cytometry should be prioritized in scenarios requiring precise viability quantification, such as final biocompatibility testing of implantable materials or dose-response studies of cytotoxic agents. Conversely, fluorescence microscopy remains valuable for initial screening, morphological assessment, and research settings where equipment access or technical expertise may be limiting factors [4].
Researchers should carefully consider their specific experimental requirements, material characteristics, and analytical precision needs when selecting between these techniques. For particulate biomaterials specifically, the enhanced precision of flow cytometry under high-stress conditions provides a more robust foundation for safety determinations, potentially mitigating risks in the translational pathway from preclinical development to clinical application.
Reliable in vitro cytotoxicity assessment is a cornerstone of preclinical biomaterial and drug development evaluation. Among the various techniques available, fluorescence microscopy (FM) and flow cytometry (FCM) have emerged as widely adopted methods for quantifying cell viability. However, not all experimental conditions are created equal. Under high-cytotoxicity scenarios—induced by potent toxins, extreme biomaterial concentrations, or aggressive therapeutic candidates—the precision and reliability of these techniques diverge significantly. A groundbreaking 2025 comparative study published in BioMedical Engineering OnLine sheds new light on this critical methodological question, demonstrating that flow cytometry provides superior precision, sensitivity, and resolution when characterizing cellular responses under substantial toxic stress [4].
This technical guide objectively compares the performance of flow cytometry versus fluorescence microscopy for cell viability assessment, with particular emphasis on high-cytotoxicity conditions. Through examination of experimental data, methodological protocols, and technical considerations, we provide researchers, scientists, and drug development professionals with evidence-based insights to inform their analytical decisions.
Experimental Evidence: Quantitative Performance Comparison
Key Findings from Particulate Bioactive Glass Cytotoxicity Study
A rigorous 2025 study directly compared FM and FCM performance when assessing the cytotoxicity of Bioglass 45S5 (BG) on SAOS-2 osteoblast-like cells. The experimental design exposed cells to BG particles of different sizes (<38 µm, 63-125 µm, and 315-500 µm) at concentrations of 25, 50, and 100 mg/mL over 3-hour and 72-hour exposure periods. This created a gradient of cytotoxic stress ideal for method comparison [19].
Table 1: Viability Measurements Under High Cytotoxic Stress (particles <38 µm at 100 mg/mL)
| Time Point | Fluorescence Microscopy Viability | Flow Cytometry Viability |
|---|---|---|
| 3 hours | 9% | 0.2% |
| 72 hours | 10% | 0.7% |
Table 2: Correlation Between FM and FCM Measurements Across All Test Conditions
| Statistical Parameter | Value |
|---|---|
| Correlation Coefficient (r) | 0.94 |
| R-squared (R²) | 0.8879 |
| p-value | <0.0001 |
The data reveals a stark contrast in performance under high-stress conditions. While both techniques detected the severe cytotoxicity induced by smaller particles at high concentrations, FCM demonstrated significantly greater sensitivity, registering near-complete cell death (0.2% viability) where FM still reported 9% viability at the 3-hour mark [4] [19]. This divergence highlights FCM's enhanced ability to detect subtle cellular changes under extreme stress. Despite these differences in absolute values, the strong statistical correlation between the methods validates FM as a useful screening tool, though one with limitations in high-stress scenarios [19].
Technical Advantages of Flow Cytometry in High-Stress Environments
Flow cytometry's superior performance under high-cytotoxicity conditions stems from several technical advantages:
Multiparametric Analysis Capability: While FM typically utilizes FDA/PI staining to dichotomize cells into live or dead populations, the cited study employed a sophisticated FCM panel incorporating Hoechst dye, DiIC1, Annexin V-FITC, and PI. This approach enabled differentiation of viable, early apoptotic, late apoptotic, and necrotic populations, providing a nuanced understanding of cell death mechanisms [4] [19].
Superior Statistical Power: FCM analyzes thousands of cells per second, providing robust statistical sampling that minimizes field selection bias. In contrast, FM typically examines only a few fields of view, potentially missing rare populations or introducing sampling artifacts [19].
Reduced Interference from Particulates: The study specifically noted that biomaterials like bioactive glass can exhibit strong autofluorescence and light scattering that inhibit fluorescence imaging. FCM's gating strategies can exclude such interference more effectively than FM [19] [58].
Enhanced Detection of Early Apoptotic Changes: FCM's multiparametric approach allowed detection of early apoptotic changes prior to cell membrane breakdown, providing earlier indicators of cytotoxic stress than membrane integrity assays alone [4].
Methodological Protocols: Experimental Workflows and Technical Execution
Experimental Workflow for Comparative Viability Assessment
The following diagram illustrates the comprehensive experimental workflow used in the comparative study, highlighting the parallel processes for FM and FCM analysis:
Detailed Methodological Protocols
Fluorescence Microscopy Protocol
The FM protocol followed these key steps [4] [19]:
Staining Procedure: After BG exposure, cells were stained with Fluorescein Diacetate (FDA) and Propidium Iodide (PI). FDA is metabolized by esterases in viable cells to produce green fluorescence, while PI only enters dead cells with compromised membranes, binding to DNA and producing red fluorescence.
Image Acquisition: Multiple fields of view were captured using conventional widefield fluorescence microscopy. Researchers took care to avoid oversaturation and maintain consistent exposure settings across samples.
Cell Counting and Analysis: Viable (FDA-positive) and non-viable (PI-positive) cells were counted manually or using image analysis software. Viability percentage was calculated as: (Number of viable cells / Total number of cells) × 100.
Flow Cytometry Protocol
The FCM protocol employed these specific procedures [4] [19]:
Multiparametric Staining: Cells were stained with a panel of four fluorescent probes:
- Hoechst dye: DNA content assessment and cell cycle analysis
- DiIC1: Mitochondrial membrane potential indicator
- Annexin V-FITC: Detection of phosphatidylserine externalization (early apoptosis)
- Propidium Iodide: Membrane integrity assessment (late apoptosis/necrosis)
Instrumentation and Acquisition: Samples were analyzed using a flow cytometer capable of detecting multiple fluorescence channels. The study analyzed tens of thousands of events per sample to ensure statistical robustness.
Gating Strategy and Analysis:
- Cells were first gated based on forward scatter (FSC) and side scatter (SSC) to exclude debris and focus on intact cells.
- Doublets were excluded using FSC-A versus FSC-H plotting.
- Fluorescence compensation was applied to address spectral overlap between channels.
- Subpopulations were classified as:
- Viable: Annexin V-/PI-
- Early Apoptotic: Annexin V+/PI-
- Late Apoptotic: Annexin V+/PI+
- Necrotic: Annexin V-/PI+
Research Reagent Solutions for Cytotoxicity Assessment
Table 3: Essential Research Reagents for Cell Viability Assessment
| Reagent/Category | Function/Application | Example Uses |
|---|---|---|
| Viability Stains | Distinguish live/dead cells based on membrane integrity | Propidium iodide, FDA, SYTOX stains, LIVE/DEAD fixable dyes [59] |
| Apoptosis Detection | Identify programmed cell death pathways | Annexin V conjugates, caspase substrates (CellEvent Caspase-3/7), apoptosis induction kits [59] |
| Metabolic Activity Probes | Measure cellular metabolic function | CFDA, CTC, Alamar Blue, MTT assays [60] |
| Oxidative Stress Indicators | Detect ROS production and oxidative damage | CellROX reagents, DCFDA, HPF, dihydroethidium [60] [61] |
| Instrument-Specific Kits | Optimized protocols for specific platforms | Attune NxT flow cytometry kits, imaging microscopy kits [59] |
Technical Considerations and Interference Mitigation
Addressing Fluorescence Interference and Artifacts
Both FM and FCM are susceptible to interference that can compromise data quality, particularly in high-cytotoxicity settings:
Autofluorescence: Biomaterials, especially polymers and glasses, can exhibit strong autofluorescence that inhibits fluorescence imaging. FCM's gating strategies can often exclude this interference more effectively than FM [19] [58].
Compound-Mediated Interference: Test compounds may themselves be fluorescent (causing autofluorescence) or act as quenchers, producing artifactual readouts. Statistical analysis of fluorescence intensity data can help identify such interference [58].
Light Scattering Effects: Particulate biomaterials scatter light, potentially creating imaging artifacts in FM and affecting detection in FCM. Appropriate controls and gating strategies are essential [19].
Photobleaching and Phototoxicity: FM is particularly susceptible to photobleaching (fluorescence fading during illumination) and phototoxicity (light-induced cellular damage), which can artifactually reduce viability measurements [19].
Optimized Gating Strategy for Flow Cytometry in High-Stress Conditions
The cited research emphasizes that proper gating is essential for accurate FCM analysis, particularly when measuring reactive oxygen species (ROS) or under high-stress conditions. An optimized four-step gating scheme accounts for [60]:
Morphological Changes: Using forward scatter (FSC) and side scatter (SSC) to identify intact cells and exclude debris.
Background Fluorescence: Establishing thresholds to distinguish true signal from autofluorescence.
DNA Content: Gating based on nucleic acid staining to identify nucleated cells.
Dye Uptake: Verifying successful probe incorporation while excluding cells with aberrant staining.
This comprehensive gating approach minimizes false positives and ensures that observed fluorescence changes truly reflect biological phenomena rather than technical artifacts [60].
The experimental evidence demonstrates that flow cytometry provides significant advantages over fluorescence microscopy for cell viability assessment under high-cytotoxicity conditions. FCM's superior sensitivity (detecting 0.2% vs 9% viability in extreme stress), multiparametric capabilities, and robust statistical power make it particularly valuable for evaluating highly cytotoxic agents, particulate biomaterials, and aggressive therapeutic candidates.
While fluorescence microscopy remains a valuable tool for initial screening and spatial assessment, its limitations in high-stress scenarios—including reduced sensitivity, sampling bias, and difficulty distinguishing apoptosis mechanisms—suggest that critical evaluations should incorporate flow cytometry for definitive viability quantification. The strong correlation between methods (r=0.94) indicates they measure related biological phenomena, but FCM's enhanced precision under stress conditions makes it the preferred technique for rigorous cytotoxicity assessment in demanding research and development applications.
For researchers investigating potent cytotoxic agents, aggressive biomaterials, or novel therapeutic candidates with potentially severe cellular effects, investing in flow cytometry capabilities provides more nuanced, accurate, and biologically insightful viability data essential for informed decision-making in drug development and biomaterial safety assessment.
Conclusion
The choice between flow cytometry and fluorescence microscopy is not merely technical but strategic, hinging on the specific demands of the research. Flow cytometry emerges as the unequivocal leader for high-throughput, quantitative analysis requiring superior sensitivity and the ability to detect subtle cellular subpopulations like early apoptotic cells. This is critically important in advanced fields like biomaterial safety testing and drug development. Fluorescence microscopy remains an invaluable tool for initial screening and when spatial context and cellular morphology are paramount. Future directions point toward the integration of these techniques, leveraging their complementary strengths, and the adoption of standardized, multiparametric flow cytometry panels. This evolution will further solidify its role in developing robust, preclinical safety assessments, ultimately accelerating the translation of safer biomaterials and therapeutics into clinical practice.
References
- 1. Comparing Flow Cytometry with Imaging Cytometry [https://www.labx.com/resources/comparing-flow-cytometry-with-imaging-cytometry/5523]
- 2. Advantages & Limitations of Flow Cytometry [https://lifesciences.danaher.com/us/en/products/flow-cytometers/topics/non-sorting-flow-cytometry.html]
- 3. Spectral Flow Cytometry: The Current State and Future of ... [https://pmc.ncbi.nlm.nih.gov/articles/PMC12193525/]
- 4. Comparing Cell Viability: Flow Cytometry vs. Microscopy [https://bioengineer.org/comparing-cell-viability-flow-cytometry-vs-microscopy/]
- 5. Quantitative assessment of cell viability based on flow cytometry and microscopy - PubMed [https://pubmed.ncbi.nlm.nih.gov/23081720/]
- 6. Quantification of cellular viability by automated microscopy and flow cytometry - PMC [https://pmc.ncbi.nlm.nih.gov/articles/PMC4496231/]
- 7. A Comparative Study Using Fluorescent Confocal Microscopy and Flow Cytometry to Evaluate Chondrocyte Viability in Human Osteochondral Allografts - PMC [https://pmc.ncbi.nlm.nih.gov/articles/PMC9598719/]
- 8. Imaging flow cytometry with a real-time throughput beyond ... [https://www.nature.com/articles/s41377-025-01754-9]
- 9. Fluorescence Microscope: Principle, Parts, Uses, Examples [https://microbenotes.com/fluorescence-microscope-principle-instrumentation-applications-advantages-limitations/]
- 10. Introduction to Fluorescence Microscopy [https://www.microscopyu.com/techniques/fluorescence/introduction-to-fluorescence-microscopy]
- 11. Fluorescence Excitation and Emission Fundamentals [https://evidentscientific.com/en/microscope-resource/knowledge-hub/lightandcolor/fluoroexcitation]
- 12. Fluorescence Microscopy - PMC - PubMed Central - NIH [https://pmc.ncbi.nlm.nih.gov/articles/PMC4711767/]
- 13. Overview of Excitation and Emission Fundamentals [https://micro.magnet.fsu.edu/primer/lightandcolor/fluoroexcitation.html]
- 14. Anatomy of Fluorescence Spectra [https://www.thermofisher.com/us/en/home/life-science/cell-analysis/cell-analysis-learning-center/molecular-probes-school-of-fluorescence/fluorescence-basics/anatomy-fluorescence-spectra.html]
- 15. Fluorescence microscopy: A Basic Introduction [https://www.goldbio.com/blogs/articles/fluorescence-microscopy-a-basic-introduction?srsltid=AfmBOorhVlDJOQAwBLhZsVcE-ssvUwUnzC6XiYm9a001SP3023aWoBgN]
- 16. Anatomy of the Fluorescence Microscope [https://evidentscientific.com/en/microscope-resource/knowledge-hub/techniques/fluorescence/anatomy/fluoromicroanatomy]
- 17. Fluorescence microscope [https://en.wikipedia.org/wiki/Fluorescence_microscope]
- 18. Fluorescence Microscopy: An Easy Guide for Biologists [https://bitesizebio.com/33529/fluorescence-microscopy-the-magic-of-fluorophores-and-filters/]
- 19. Evaluating cell viability assessment techniques [https://pmc.ncbi.nlm.nih.gov/articles/PMC12492793/]
- 20. Beyond the Limits: How Is Spectral Flow Cytometry ... [https://pmc.ncbi.nlm.nih.gov/articles/PMC12248732/]
- 21. Real-time, high-throughput super-resolution microscopy ... [https://www.nature.com/articles/s41467-025-64368-0]
- 22. Cell Viability Assays [https://www.thermofisher.com/us/en/home/life-science/cell-analysis/cell-viability-and-regulation/cell-viability.html]
- 23. Uncovering CAR T Cell Spatial Dynamics and Activation ... [https://cytometry.org/public-admin/mobile/show_presentation.php?abstractno=245]
- 24. proteomics: unveiling the multidimensional landscape of protein... Spatial [https://proteomesci.biomedcentral.com/articles/10.1186/s12953-024-00231-2]
- 25. Frontiers Publishing Partnerships | Advancements in single-cell RNA... [https://www.frontierspartnerships.org/journals/acta-biochimica-polonica/articles/10.3389/abp.2025.13922/full]
- 26. Flow Cytometry, a Unique Biotechnology in Medical Applications [https://pmc.ncbi.nlm.nih.gov/articles/PMC9605404/]
- 27. Fluorescence Microscopy Accessories and Reference ... [https://www.thermofisher.com/us/en/home/references/molecular-probes-the-handbook/tools-for-fluorescence-applications-including-reference-standards-and-optical-filters/fluorescence-microscopy-reference-standards-and-antifade-reagents.html]
- 28. An Overview of the Current State of Cell Viability ... [https://www.mdpi.com/1422-0067/26/1/220]
- 29. Evaluating cell viability assessment techniques [https://pubmed.ncbi.nlm.nih.gov/41044769/]
- 30. Multiparameter Conventional Flow Cytometry - PMC [https://pmc.ncbi.nlm.nih.gov/articles/PMC8054300/]
- 31. From proliferation to mitochondrial membrane potential ... [https://www.nature.com/articles/s41420-025-02391-2]
- 32. Flow Cytometry: An Overview - PMC [https://pmc.ncbi.nlm.nih.gov/articles/PMC5939936/]
- 33. Evaluating cell viability assessment techniques: a comparative ... [https://biomedical-engineering-online.biomedcentral.com/articles/10.1186/s12938-025-01452-y]
- 34. Flow Cytometry: A Blessing and a Curse [https://pmc.ncbi.nlm.nih.gov/articles/PMC8615642/]
- 35. Assessment and Comparison of Viability Assays for ... [https://pmc.ncbi.nlm.nih.gov/articles/PMC10872314/]
- 36. Top Tools for Monitoring Cell Viability and Growth in Real- ... [https://cellculturecollective.com/blog/top-tools-for-monitoring-cell-viability-and-growth-in-real-time/?srsltid=AfmBOopi6i1fsqPY86JAYfKhs1n90fkgpCeuPNoW9D9NKR3djI6vlHI2]
- 37. BestProtocols: Cell Preparation for Flow Cytometry Protocols [https://www.thermofisher.com/us/en/home/references/protocols/cell-and-tissue-analysis/protocols/cell-preparation-flow-cytometery.html]
- 38. Preparing a Single-Cell Suspension for Flow Cytometry [https://fluorofinder.com/preparing-a-single-cell-suspension-for-flow-cytometry/]
- 39. Comparison of the automated fluorescence microscopic ... [https://pmc.ncbi.nlm.nih.gov/articles/PMC6647696/]
- 40. Comparative analysis of RT-qPCR, flow cytometry, and Di ... [https://pmc.ncbi.nlm.nih.gov/articles/PMC12418842/]
- 41. Troubleshooting Flow Cytometry Issues [https://www.bosterbio.com/protocol-and-troubleshooting/flow-cytometry-troubleshooting?srsltid=AfmBOopERCyHHdAJXDwVlTa06pUcgC6bNM-azaxm1sRjOgaLLkYjHYvW]
- 42. Flow Cytometry Troubleshooting Guide [https://fluorofinder.com/flow-cytometry-troubleshooting/]
- 43. Flow Cytometry Tips [https://go.biossusa.com/flow-cytometry-tips]
- 44. The Power of Reagent Titration in Flow Cytometry - PMC [https://pmc.ncbi.nlm.nih.gov/articles/PMC11506663/]
- 45. Guide To Selecting Fluorophores for ICC and IHC [https://fluorofinder.com/fluorophore-selection-icc-ihc/]
- 46. How to Choose Fluorochromes in Multicolor ICC/IF [https://www.bio-techne.com/resources/blogs/rules-for-selection-of-fluorochromes-in-multicolor-icc-if]
- 47. Latest Developments in Flow Cytometry [https://fluorofinder.com/latest-developments-in-flow-cytometry/]
- 48. Choosing the right fluorophores for your experiment [https://www.abcam.com/en-us/technical-resources/guides/fluorescence-guide/choosing-the-right-fluorophores-for-your-experiment]
- 49. Introduction to Multiparametric Flow Cytometry and ... [https://pmc.ncbi.nlm.nih.gov/articles/PMC7868168/]
- 50. When To Use (And Not Use) Flow Cytometry Isotype Controls [https://expertcytometry.com/when-to-use-and-not-use-flow-cytometry-isotype-controls/]
- 51. Characterizing and Quenching Autofluorescence in Fixed ... [https://www.mdpi.com/1422-0067/24/4/3432]
- 52. Recommended controls for flow cytometry [https://www.abcam.com/en-us/technical-resources/guides/flow-cytometry-guide/recommended-controls-for-flow-cytometry]
- 53. Flow Cytometry vs. Fluorescence Microscopy [https://www.news-medical.net/life-sciences/Flow-Cytometry-vs-Fluorescence-Microscopy.aspx]
- 54. Pre-culture Sudan Black B treatment suppresses ... [https://www.nature.com/articles/s41598-017-08723-2]
- 55. Elimination of autofluorescence background from ... [https://pmc.ncbi.nlm.nih.gov/articles/PMC3566262/]
- 56. Imaging Flow Cytometry as a Molecular Biology Tool [https://pmc.ncbi.nlm.nih.gov/articles/PMC12524540/]
- 57. Viability and Cytotoxicity Assay Reagents—Section 15.2 [https://www.thermofisher.com/us/en/home/references/molecular-probes-the-handbook/assays-for-cell-viability-proliferation-and-function/viability-and-cytotoxicity-assay-reagents.html]
- 58. Interference and Artifacts in High-content Screening - NCBI - NIH [https://www.ncbi.nlm.nih.gov/books/NBK615088/]
- 59. Flow Cytometry Assays Information | Thermo Fisher Scientific - US [https://www.thermofisher.com/us/en/home/life-science/cell-analysis/flow-cytometry/flow-cytometry-learning-center/flow-cytometry-assays-information.html]
- 60. Production of Superoxide in Bacteria Is Stress- and Cell State-Dependent: A Gating-Optimized Flow Cytometry Method that Minimizes ROS Measurement Artifacts with Fluorescent Dyes - PMC [https://pmc.ncbi.nlm.nih.gov/articles/PMC5359317/]
- 61. Cytotoxic responses to 405 nm light exposure in ... [https://www.sciencedirect.com/science/article/pii/S0887233316300273]