2-Deoxyglucose (2-DG) Uptake and Metabolic Trapping: A Comprehensive Guide for Research and Therapeutic Development
This article provides a detailed, up-to-date analysis of the molecular mechanisms underlying 2-deoxyglucose (2-DG) cellular uptake and intracellular trapping.
2-Deoxyglucose (2-DG) Uptake and Metabolic Trapping: A Comprehensive Guide for Research and Therapeutic Development
Abstract
This article provides a detailed, up-to-date analysis of the molecular mechanisms underlying 2-deoxyglucose (2-DG) cellular uptake and intracellular trapping. Targeted at researchers, scientists, and drug development professionals, it explores the foundational biology of glucose transporter (GLUT) affinity and hexokinase-mediated phosphorylation. It further examines methodological applications in imaging (e.g., FDG-PET analogs) and cancer therapy, addresses common experimental pitfalls and optimization strategies for in vitro and in vivo studies, and validates the mechanism through comparative analysis with other glucose analogs and metabolic probes. The synthesis offers a critical resource for leveraging 2-DG's unique pharmacokinetics in experimental design and translational research.
The Core Mechanism: How 2-Deoxyglucose Hijacks Cellular Glucose Metabolism
This whitepaper explores the fundamental structural distinction between 2-Deoxy-D-glucose (2-DG) and D-glucose, focusing on the critical absence of the hydroxyl group at the C-2 position. This singular modification underpins its unique mechanism of cellular uptake, phosphorylation, and subsequent metabolic trapping, forming the core of its application in metabolic research and therapeutic investigation. The content is framed within the broader thesis of 2-DG's mechanism as a competitive inhibitor and metabolic disruptor.
Structural Comparison: Quantitative Analysis
The following table summarizes the key structural and biochemical differences stemming from the C-2 modification.
Table 1: Structural & Initial Metabolic Comparison of D-Glucose and 2-Deoxy-D-Glucose
| Property | D-Glucose | 2-Deoxy-D-Glucose (2-DG) |
|---|---|---|
| C-2 Substituent | -OH (Hydroxyl) | -H (Hydrogen) |
| IUPAC Name | (2R,3S,4R,5R)-2,3,4,5,6-Pentahydroxyhexanal | (2R,3S,4R,5R)-2,3,4,5-Tetrahydroxyhexanal |
| Molecular Formula | C₆H₁₂O₆ | C₆H₁₂O₅ |
| Hexokinase Substrate | Yes (Km ~0.1 mM) | Yes (Km ~0.2-0.3 mM) |
| Product of HK/Glucokinase | Glucose-6-Phosphate (G-6-P) | 2-Deoxy-D-glucose-6-Phosphate (2-DG-6-P) |
| Isomerization by GPI | Yes (to Fructose-6-Phosphate) | No (Lacks C-2 OH for catalysis) |
| Further Glycolytic Metabolism | Proceeds to pyruvate | Arrested at 2-DG-6-P |
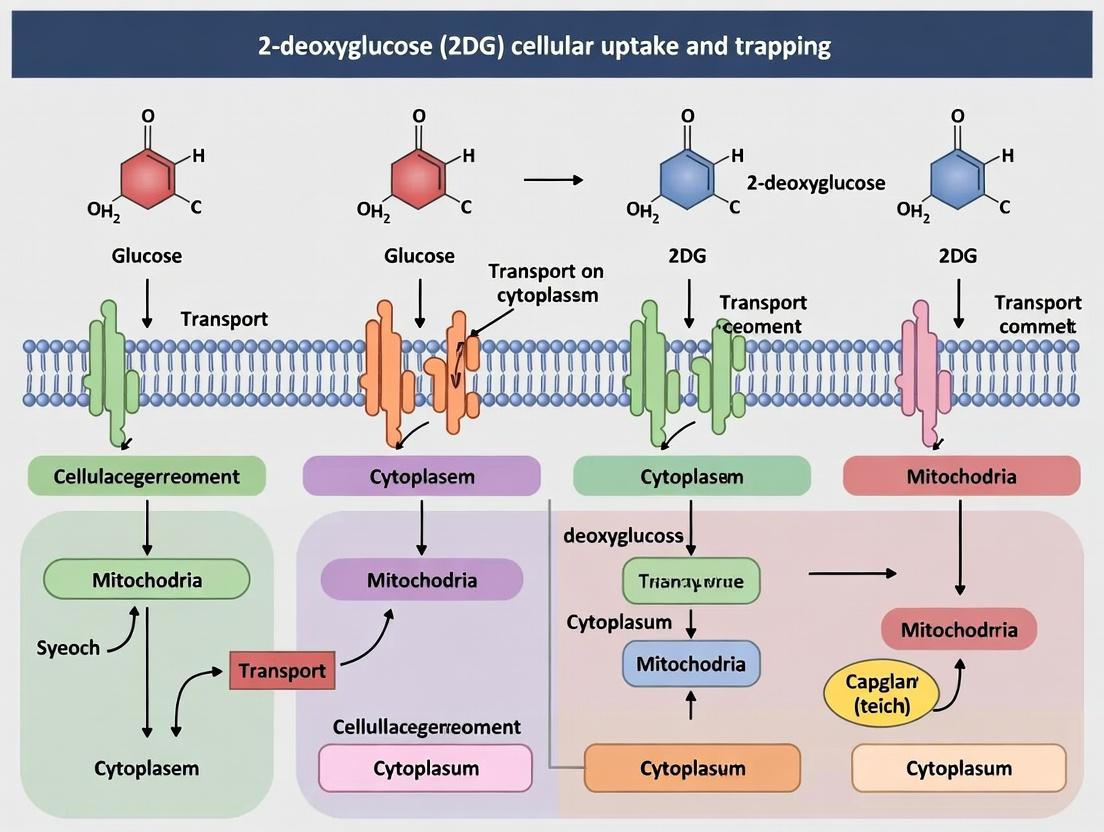
Mechanism of Cellular Uptake and Trapping: A Detailed Workflow
The core thesis of 2-DG action is its competition with glucose for uptake and initial phosphorylation, followed by metabolic trapping. The diagram below illustrates this critical pathway.
Diagram Title: 2-DG Cellular Uptake, Phosphorylation, and Trapping Pathway
Key Experimental Protocols
Radiolabeled Uptake and Trapping Assay
This classic protocol quantifies 2-DG uptake and its intracellular phosphorylation/trapping.
- Objective: Measure the rate of 2-DG accumulation in cells.
- Reagents: [³H]-2-Deoxy-D-glucose, D-Glucose, Phosphate-Buffered Saline (PBS), Cell Lysis Buffer, Scintillation Cocktail.
- Protocol:
- Culture cells in glucose-free media for 1 hour to deplete endogenous glucose.
- Incubate cells with a solution containing a known activity of [³H]-2-DG (e.g., 0.1-1.0 µCi/mL) in Krebs-Ringer buffer.
- Include parallel samples with excess unlabeled D-glucose (e.g., 20 mM) to determine non-specific transport.
- Terminate uptake at timed intervals (e.g., 1, 5, 10, 20 min) by rapid washing with ice-cold PBS.
- Lyse cells with 0.1N NaOH or a suitable detergent-based lysis buffer.
- Measure radioactivity in the lysate via liquid scintillation counting.
- Trapping Analysis: To distinguish phosphorylated 2-DG, wash terminated cell samples with ice-cold ethanol or perchloric acid, which removes free, unphosphorylated 2-DG but not 2-DG-6-P.
Assessment of Glycolytic Inhibition via Extracellular Acidification Rate (ECAR)
- Objective: Quantify the real-time inhibition of glycolysis by 2-DG.
- Reagents: Seahorse XF Glycolysis Stress Test Kit, 2-DG, Glucose, Oligomycin.
- Protocol:
- Seed cells in a Seahorse XF microplate.
- Replace media with Seahorse XF Base Medium supplemented with glucose, L-glutamine, and sodium pyruvate.
- Load sensor cartridge with compounds: Port A - Glucose, Port B - Oligomycin, Port C - 2-DG.
- Run the assay on the Seahorse Analyzer. Baseline ECAR is measured, followed by sequential injections: glucose (to induce glycolysis), oligomycin (to induce maximum glycolytic capacity), and finally 2-DG (to inhibit glycolysis and confirm its dependence on hexokinase activity).
The Scientist's Toolkit: Key Research Reagents
Table 2: Essential Reagents for 2-DG Uptake and Mechanism Studies
| Reagent | Function / Role in 2-DG Research |
|---|---|
| [³H]- or [¹⁴C]-2-Deoxy-D-glucose | Radiolabeled tracer for quantitative measurement of cellular uptake and phosphorylation rates. |
| Unlabeled 2-DG (High Purity) | Primary compound for competition experiments and therapeutic effect studies. |
| Hexokinase Inhibitor (e.g., Lonidamine) | Used as a control to confirm 2-DG phosphorylation is HK-dependent. |
| Glucose Transporter (GLUT) Inhibitors (e.g., Cytochalasin B) | To probe specific transporter involvement in 2-DG uptake. |
| Seahorse XF Glycolysis Stress Test Kit | For real-time, label-free measurement of glycolytic flux and its inhibition by 2-DG. |
| Antibodies for Immunoblotting (p-AMPK, HIF-1α) | To detect downstream cellular stress and signaling responses to 2-DG treatment. |
| ATP Assay Kit (Luminescent) | To quantify the downstream consequence of glycolytic inhibition and ATP depletion. |
Downstream Signaling Consequences
The trapping of 2-DG-6-P and depletion of ATP activate critical cellular stress pathways. The following diagram maps the primary signaling response.
Diagram Title: Key Cellular Stress Pathways Activated by 2-DG
This whitepaper details the affinity and kinetic parameters governing substrate transport through facilitative glucose transporters (GLUTs, SLC2A family). This analysis is foundational for research into the mechanism of cellular uptake and metabolic trapping of 2-deoxyglucose (2-DG), a glucose analog and investigative therapeutic agent. 2-DG competes with glucose for GLUT-mediated influx but, following phosphorylation by hexokinase, cannot be further metabolized, leading to its accumulation. Precise knowledge of GLUT kinetics and affinity is therefore critical for interpreting 2-DG uptake assays, modeling its cellular pharmacokinetics, and developing related therapeutic strategies.
GLUT Family: Isoform-Specific Affinity and Kinetics
Facilitative diffusion via GLUTs follows Michaelis-Menten kinetics. Key parameters are the Michaelis constant (Km, an inverse measure of affinity) and the maximum transport velocity (Vmax, reflecting transporter density and turnover). These vary significantly between isoforms, dictating tissue-specific glucose and analog uptake.
Table 1: Kinetic Parameters of Key GLUT Isoforms for D-Glucose and 2-Deoxyglucose
| GLUT Isoform | Primary Tissue Localization | Substrate (D-Glucose) Km (mM) | Substrate (2-Deoxyglucose) Km (mM) | Notes on 2-DG Transport |
|---|---|---|---|---|
| GLUT1 | Ubiquitous (Erythrocytes, BBB, many cancers) | 1-2 mM | ~1.7 mM | Primary transporter for 2-DG in many cancer cell lines and erythrocytes. |
| GLUT2 | Liver, Pancreatic β-cells, Kidney, Intestine | 15-20 mM (high Km) | ~10-15 mM | Low-affinity, high-capacity transporter. Also transports fructose. |
| GLUT3 | Neurons, Placenta, Testes | ~1 mM (high affinity) | ~1.5 mM | High-affinity neuronal transporter; critical for 2-DG brain uptake studies. |
| GLUT4 | Muscle, Adipose (Insulin-responsive) | ~5 mM | ~5-8 mM | Insulin stimulates Vmax via translocation, not Km. Key for 2-DG uptake in metabolic studies. |
Note: Km values are approximate and can vary based on experimental system (e.g., Xenopus oocytes vs. mammalian cells). 2-DG typically has a similar or slightly higher Km (lower affinity) than D-glucose for a given GLUT isoform.
Experimental Protocols for Measuring GLUT Kinetics
Protocol: Zero-Trans Influx Kinetics Using Radiolabeled Tracers
This standard protocol measures the initial rate of substrate uptake into cells expressing a specific GLUT isoform.
Key Materials:
- Cells (e.g., Xenopus laevis oocytes expressing recombinant GLUT, cultured mammalian cells).
- Radiolabeled substrate: [³H]- or [¹⁴C]-2-Deoxy-D-glucose. [³H]-3-O-Methyl-D-glucose (non-metabolizable) is used for pure transport studies.
- Transport Buffer: Typically Krebs-Ringer HEPES (KRH) buffer, pH 7.4.
- Competitive Inhibitors: Cytochalasin B (general GLUT inhibitor), specific sugar analogs.
- Stop/Wash Solution: Ice-cold KRH buffer containing a high concentration of a GLUT inhibitor (e.g., 500 μM phloretin or 10 μM cytochalasin B).
- Cell lysis/scintillation counting equipment.
Procedure:
- Cell Preparation: Plate or prepare cells in multi-well plates. For oocytes, use groups of 10-15.
- Uptake Initiation: Replace culture medium with pre-warmed transport buffer containing varying concentrations of radiolabeled 2-DG (e.g., 0.1 to 20 mM, with constant specific activity). Perform in triplicate.
- Incubation: Incubate for a precisely timed, short interval (e.g., 1-5 minutes) to ensure measurement of initial linear uptake rates.
- Termination: Rapidly aspirate uptake solution and immediately wash cells 2-3 times with ice-cold stop/wash solution to halt transport.
- Lysis and Quantification: Lyse cells (with 1% SDS or 0.1N NaOH). Transfer lysate to scintillation vials, add cocktail, and count radioactivity.
- Data Analysis: Correct for non-specific uptake (measured in presence of excess cytochalasin B). Plot uptake rate (nmol/min/mg protein) vs. substrate concentration. Fit data to the Michaelis-Menten equation (v = (Vmax * [S]) / (Km + [S])) using non-linear regression to derive Km and Vmax.
Protocol: Assessing 2-DG Metabolic Trapping
This protocol differentiates total cellular accumulation (transport + phosphorylation) from mere membrane transport.
Procedure:
- Perform the standard uptake assay (Steps 1-5 above) using [¹⁴C]-2-DG.
- Parallel Phosphorylation Assay: Following uptake and washes, immediately treat cell lysates with perchloric acid or ethanol to precipitate proteins.
- Separation: Subject the neutralized supernatant to thin-layer chromatography (TLC) or ion-exchange chromatography to separate [¹⁴C]-2-DG from [¹⁴C]-2-DG-6-phosphate.
- Quantification: Quantify the radioactivity in each fraction. The 2-DG-6-P fraction represents the metabolically "trapped" analog, which is the relevant pool for most imaging (e.g., FDG-PET) and therapeutic applications.
Visualization of 2-DG Uptake and Trapping Pathway
Title: 2-DG Uptake & Metabolic Trapping via GLUTs
The Scientist's Toolkit: Key Research Reagent Solutions
Table 2: Essential Reagents for GLUT and 2-DG Uptake Research
| Reagent / Material | Function & Application | Key Consideration |
|---|---|---|
| [³H]- or [¹⁴C]-2-Deoxy-D-glucose | Radiolabeled tracer for quantifying cellular uptake and accumulation kinetics. | [¹⁴C] has longer half-life; [³H] often higher specific activity. Critical for kinetic assays. |
| [³H]-3-O-Methyl-D-glucose (3-OMG) | Non-metabolizable glucose analog. Used to measure pure transport kinetics without complicating phosphorylation. | Ideal for isolating and characterizing GLUT-specific transport parameters (Km, Vmax). |
| Cytochalasin B | Potent, non-specific inhibitor of GLUT-mediated transport. Binds to the cytoplasmic face. | Used to determine non-specific uptake/binding in assays (baseline control) and in stop solutions. |
| Phloretin | Competitive inhibitor of GLUTs, acting on the exofacial side. | Used in wash buffers to stop transport. Less potent but cheaper than cytochalasin B. |
| GLUT Isoform-Selective Inhibitors (e.g., BAY-876 for GLUT1, Fasentin for GLUT4) | Pharmacological tools to dissect the contribution of specific GLUT isoforms in complex systems. | Selectivity should be verified in the specific cellular model used. |
| GLUT Polyclonal/Monoclonal Antibodies | For detection of GLUT protein expression (Western blot, immunofluorescence) and monitoring cellular localization (e.g., GLUT4 translocation). | Isoform specificity and application validation are crucial. |
| Heterologous Expression Systems (Xenopus oocytes, Yeast, Mammalian cell lines) | To study the kinetics and regulation of a single, recombinant GLUT isoform in isolation. | Xenopus oocytes provide a low-background, high-expression platform for precise kinetic analysis. |
| GLUT Knockout/Knockdown Cell Lines (siRNA, shRNA, CRISPR-Cas9) | To define the essential GLUT isoform(s) responsible for basal and stimulated 2-DG uptake in a given cell type. | Essential for target validation in drug discovery. |
1. Introduction Within the broader investigation of the 2-deoxyglucose (2-DG) mechanism of cellular uptake and metabolic trapping, its phosphorylation by hexokinase (HK) represents the decisive, irreversible commitment step. 2-DG, a glucose analog differing by the replacement of the 2-hydroxyl group with hydrogen, enters cells via facilitative glucose transporters (GLUTs). However, it is the cytosolic phosphorylation by HK to 2-deoxyglucose-6-phosphate (2-DG-6-P) that creates the "point of no return." This metabolite cannot be further metabolized via glycolysis or the pentose phosphate pathway and is poorly dephosphorylated, leading to its accumulation. This whitepaper details the enzymatic kinetics, experimental methodologies, and research tools central to studying this critical reaction in the context of cancer metabolism and therapeutic targeting.
2. Hexokinase Kinetics & Competitive Inhibition Hexokinase phosphorylates 2-DG with kinetics similar to, but distinct from, its natural substrate, D-glucose. The reaction is ATP-dependent and yields ADP and 2-DG-6-P. 2-DG acts as a competitive inhibitor of glucose phosphorylation, and its trapping as 2-DG-6-P concurrently depletes cellular ATP pools, contributing to its cytotoxic and radio-sensitizing effects.
Table 1: Comparative Kinetic Parameters for Hexokinase I (Brain) with D-Glucose and 2-Deoxyglucose
| Substrate | Km (mM) | kcat (s⁻¹) | Specificity Constant (kcat/Km) (M⁻¹s⁻¹) | Reference |
|---|---|---|---|---|
| D-Glucose | 0.03 - 0.05 | ~ 70 | ~ 1.4 - 2.3 x 10⁶ | (1, 2) |
| 2-Deoxyglucose | 0.15 - 0.30 | ~ 50 | ~ 0.17 - 0.33 x 10⁶ | (1, 2) |
Table 2: Effects of 2-DG-6-P Accumulation on Key Cellular Metabolites
| Affected Molecule/Pathway | Direction of Change | Proposed Mechanism |
|---|---|---|
| ATP/ADP Ratio | Decrease | Consumption of ATP by HK, insufficient compensatory glycolysis. |
| Glycolytic Flux | Inhibition | Competitive inhibition of HK by 2-DG, allosteric inhibition of HK by 2-DG-6-P. |
| N-Linked Glycosylation | Inhibition | 2-DG-6-P inhibits phosphoglucose isomerase, depleting pools of mannose precursors. |
| AMPK Activity | Activation | Increased AMP:ATP ratio triggers AMPK signaling. |
| mTORC1 Activity | Inhibition | Downstream of AMPK activation and/or glycosylation inhibition. |
3. Core Experimental Protocols
3.1. In Vitro Hexokinase Activity Assay (Spectrophotometric)
- Objective: Determine the kinetic parameters (Km, Vmax) of hexokinase for 2-DG vs. glucose.
- Reagents: Recombinant HK isoform, D-Glucose, 2-DG, ATP, NADP⁺, Glucose-6-phosphate dehydrogenase (G6PD), MgCl₂, Tris-HCl buffer (pH 8.0).
- Protocol:
- Prepare a master mix containing 50 mM Tris-HCl (pH 8.0), 10 mM MgCl₂, 2 mM ATP, 1 mM NADP⁺, and 2 U/ml G6PD.
- Aliquot the master mix into a 96-well plate. Add varying concentrations of D-glucose or 2-DG (e.g., 0.01 - 5 mM).
- Initiate the reaction by adding HK to a final concentration of 0.01-0.05 U/ml.
- Immediately monitor the increase in absorbance at 340 nm (A340) for 10-15 minutes at 30°C, corresponding to NADPH production (1:1 stoichiometry with glucose-6-P/2-DG-6-P formed).
- Calculate initial velocities. Fit data to the Michaelis-Menten equation using nonlinear regression to derive Km and Vmax.
3.2. Cellular 2-DG Uptake and Trapping Assay (Radioactive)
- Objective: Quantify the uptake and phosphorylation of 2-DG in cultured cells.
- Reagents: [³H]-2-deoxyglucose, unlabeled 2-DG, cell culture of interest, PBS, lysis buffer (e.g., 1% SDS), scintillation fluid.
- Protocol:
- Culture cells in 24-well plates to ~80% confluency. Wash twice with warm, serum-free, glucose-free buffer.
- Incubate with assay buffer containing a trace amount of [³H]-2-DG (e.g., 0.1-1 μCi/ml) and a known total 2-DG concentration (e.g., 0.1 mM).
- After a set time (e.g., 10 min), rapidly aspirate the buffer and wash cells 3x with ice-cold PBS.
- Lyse cells in 1% SDS. Transfer lysate to a scintillation vial, add scintillation fluid, and count radioactivity (Total Cell-Associated ²H).
- To differentiate transported vs. phosphorylated 2-DG, parallel wells are washed and then treated with a stop solution containing a potent HK inhibitor (e.g., mannoheptulose) or subjected to a post-incubation "efflux" period in cold, substrate-free medium. The phosphorylated fraction is trapped intracellularly.
4. The Scientist's Toolkit: Research Reagent Solutions
Table 3: Essential Reagents for 2-DG/HK Research
| Reagent / Material | Function / Purpose | Example Vendor / Cat. No. |
|---|---|---|
| 2-Deoxy-D-glucose (high purity) | Primary research molecule; competitive HK substrate & metabolic inhibitor. | Sigma-Aldrich, D6134 |
| [³H]-2-Deoxy-D-glucose | Radiolabeled tracer for quantitative uptake and phosphorylation assays. | PerkinElmer, NET328A |
| Recombinant Hexokinase Isoforms (I, II, IV) | In vitro enzymatic studies of isoform-specific kinetics and inhibition. | ProSpec, ENZ-287 |
| Glucose-6-Phosphate Dehydrogenase (G6PD) | Coupling enzyme for spectrophotometric HK activity assays. | Roche, 10127647001 |
| Mannoheptulose | Specific, competitive inhibitor of HK; used as a control in trapping assays. | Cayman Chemical, 19953 |
| 2-DG-6-Phosphate (sodium salt) | Analytical standard for mass spectrometry or as a control in downstream assays. | Carbosynth, FD66281 |
| Anti-AMPKα (Phospho-Thr172) Antibody | Immunoblotting to detect AMPK activation downstream of 2-DG-6-P accumulation. | Cell Signaling Technology, #2535 |
5. Visualizing the 2-DG Trapping Pathway & Experimental Workflow
Title: 2-DG Cellular Uptake & Metabolic Trapping Pathway
Title: Workflow for Measuring Cellular 2-DG Uptake & Phosphorylation
Within the broader thesis on 2-deoxyglucose (2-DG) mechanism of cellular uptake and trapping, a critical juncture is the metabolic fate of its phosphorylated form, 2-deoxyglucose-6-phosphate (2-DG-6-P). Unlike glucose-6-phosphate (G6P), 2-DG-6-P represents a definitive metabolic dead-end. This whitepaper provides an in-depth technical analysis of the structural and enzymatic reasons preventing its metabolism by key enzymes: phosphohexose isomerase (G6P isomerase) and glucose-6-phosphatase (G6Pase).
Structural Comparison and Core Mechanism
The trapping of 2-DG hinges on its structural mimicry of glucose, allowing uptake via glucose transporters (GLUTs) and phosphorylation by hexokinase (HK) or glucokinase (GCK). However, the critical deviation—the absence of the 2-hydroxyl group—becomes insurmountable after phosphorylation.
Chemical Structure Comparison
Table 1: Structural Comparison of Glucose-6-Phosphate and 2-Deoxyglucose-6-Phosphate
| Feature | Glucose-6-Phosphate (G6P) | 2-Deoxyglucose-6-Phosphate (2-DG-6-P) | Consequence for Metabolism |
|---|---|---|---|
| C2 Position | Hydroxyl group (-OH) | Hydrogen atom (-H) | Prevents isomerization to fructose-6-phosphate; eliminates substrate for phosphatases. |
| Phosphorylation | At C6 by HK/GCK. | At C6 by HK/GCK. | Enables initial metabolic mimicry and intracellular trapping. |
| Ring Form | Predominantly pyranose (6-membered). | Predominantly pyranose (6-membered). | Maintains overall ring structure recognition by kinases. |
| Charge at Physiological pH | Negative (phosphate group). | Negative (phosphate group). | Does not affect transport or initial phosphorylation. |
The Isomerase Block: Absence of the 2-OH Group
Phosphohexose isomerase (PGI) catalyzes the reversible conversion of G6P (an aldose) to fructose-6-phosphate (F6P, a ketose). This reaction is essential for glycolysis and the pentose phosphate pathway.
Mechanistic Detail: The isomerization proceeds via an enediolate intermediate. The enzyme abstracts the proton from the C2 carbon, requiring the electronegative oxygen at that position to stabilize the developing negative charge in the transition state. The absence of the 2-hydroxyl group in 2-DG-6-P makes this proton abstraction and subsequent electron stabilization impossible. 2-DG-6-P binds to the active site of PGI but cannot undergo catalysis, acting as a competitive inhibitor.
Experimental Protocol 1: Demonstrating Inhibition of Phosphohexose Isomerase by 2-DG-6-P
Objective: To measure the kinetic parameters (Km, Vmax) of recombinant human PGI with G6P as a substrate and determine the inhibition constant (Ki) for 2-DG-6-P.
Materials:
- Purified recombinant human Phosphohexose Isomerase (PGI).
- Substrate: D-Glucose-6-phosphate (disodium salt).
- Inhibitor: 2-Deoxyglucose-6-phosphate (sodium salt).
- Reaction Coupling Enzymes: Glucose-6-phosphate dehydrogenase (G6PDH) from Leuconostoc mesenteroides (preferred for NAD+ reduction).
- Cofactor: β-Nicotinamide adenine dinucleotide (NAD+).
- Buffer: 50 mM Tris-HCl, 1 mM EDTA, pH 8.0.
- Spectrophotometer capable of measuring absorbance at 340 nm.
Procedure:
- Prepare a master mix containing 50 mM Tris-HCl (pH 8.0), 1 mM EDTA, 2.5 mM MgCl₂, 0.2 mM NAD+, and 2 U/mL G6PDH.
- Aliquot the master mix into cuvettes. Add PGI enzyme to a final concentration of 10 nM.
- Variable Substrate Experiment: To one set of cuvettes, add G6P at final concentrations ranging from 0.1 to 5x its estimated Km (e.g., 0.05, 0.1, 0.2, 0.5, 1.0 mM). Initiate the reaction with PGI, monitor NADH production at 340 nm for 3 minutes, and calculate initial velocities (v0).
- Inhibition Experiment: Repeat Step 3, but include 2-DG-6-P at three fixed concentrations (e.g., 0.1, 0.5, 1.0 mM) in separate reaction sets.
- Analysis: Plot v0 vs. [G6P] for each inhibitor concentration. Fit data to the Michaelis-Menten equation with competitive inhibition to determine Km, Vmax, and Ki for 2-DG-6-P.
Expected Outcome: Apparent Km for G6P will increase with increasing [2-DG-6-P], while Vmax remains unchanged, confirming competitive inhibition. Ki values are typically in the low micromolar range, demonstrating high-affinity binding without turnover.
Figure 1: PGI Catalysis Block by 2-DG-6-P
The Phosphatase Block: Lack of a Recognition Determinant
Glucose-6-phosphatase (G6Pase), located in the endoplasmic reticulum (ER) membrane, hydrolyzes G6P to glucose and inorganic phosphate (Pi), a final step in gluconeogenesis and glycogenolysis.
Mechanistic Detail: The G6Pase catalytic unit (G6PC) requires specific interactions with the substrate's phosphate group and the hydroxyl groups at C1, C2, and C4 for proper orientation and catalysis. The 2-hydroxyl group is a key hydrogen bond donor/acceptor in the substrate-binding pocket. Its absence in 2-DG-6-P disrupts this precise binding geometry, rendering it a very poor substrate. Reported catalytic efficiency (kcat/Km) for 2-DG-6-P is less than 0.1% of that for G6P.
Experimental Protocol 2: Assessing 2-DG-6-P as a Substrate for Glucose-6-Phosphatase
Objective: To measure phosphate release from G6P and 2-DG-6-P by microsomal fractions containing G6Pase activity.
Materials:
- Rat liver microsomal fraction (source of G6Pase).
- Substrates: G6P (disodium salt) and 2-DG-6-P (sodium salt).
- Stop/Detection Reagent: Malachite Green Phosphate Assay Kit.
- Buffer: 50 mM HEPES, pH 7.0, containing 2 mM EDTA.
- Water bath at 37°C.
- Plate reader for measuring absorbance at 620-650 nm.
Procedure:
- Prepare microsomal suspension in HEPES buffer on ice.
- Set up reactions containing 50 µg of microsomal protein and varying concentrations of G6P or 2-DG-6-P (e.g., 0.5, 1, 2, 5, 10 mM) in a final volume of 100 µL. Include a no-substrate control.
- Incubate at 37°C for 15 minutes.
- Terminate the reaction by adding 100 µL of Malachite Green reagent (prepared per kit instructions).
- After 10-30 minutes incubation at room temperature, measure absorbance at 620-650 nm.
- Calculate liberated phosphate using a standard curve of inorganic phosphate. Plot reaction velocity vs. substrate concentration.
Expected Outcome: A clear Michaelis-Menten saturation curve will be observed for G6P. In contrast, phosphate release from 2-DG-6-P will be minimal, even at high concentrations, confirming its incompetence as a substrate.
Table 2: Kinetic Parameters for G6Pase Activity on G6P vs. 2-DG-6-P (Representative Data)
| Substrate | Km (mM) | Vmax (nmol Pi/min/mg protein) | kcat/Km (Relative % Activity) |
|---|---|---|---|
| Glucose-6-Phosphate | 1.2 ± 0.2 | 48 ± 5 | 100% (Reference) |
| 2-Deoxyglucose-6-Phosphate | >50 (Poor binding) | ~0.05 (Extremely low) | < 0.1% |
Integrated View: The Metabolic Dead-End in Cellular Context
The combined blocks at isomerase and phosphatase enzymes lead to the irreversible accumulation of 2-DG-6-P within the cell.
Figure 2: 2-DG Cellular Trapping Pathway
The Scientist's Toolkit: Research Reagent Solutions
Table 3: Essential Reagents for 2-DG/2-DG-6-P Mechanistic Research
| Reagent/Material | Function & Application | Key Consideration |
|---|---|---|
| 2-Deoxy-D-glucose (2-DG) | Primary research compound. Used in cell culture and in vivo to study glucose deprivation mimicry, stress responses, and cytotoxicity. | Ensure high purity (>98%). Radioactive [³H]-2-DG or [¹⁴C]-2-DG variants are available for precise uptake/trapping assays. |
| 2-Deoxy-D-glucose-6-phosphate (2-DG-6-P) (sodium salt) | Direct substrate for in vitro enzyme studies (PGI, G6Pase inhibition/kinetics). Critical for validating the dead-end hypothesis. | Labile compound. Requires storage at ≤ -20°C, desiccated. Purity verified by HPLC/MS. |
| Recombinant Human Proteins: Hexokinase I/II, Glucokinase, Phosphohexose Isomerase, Glucose-6-phosphatase catalytic subunit (G6PC). | For standardized, reproducible in vitro kinetic and structural studies (e.g., X-ray crystallography, ITC). | Source from reputable suppliers with documented specific activity. Use appropriate storage buffers to maintain activity. |
| Malachite Green Phosphate Assay Kit | Sensitive colorimetric detection of inorganic phosphate (Pi) released in phosphatase or ATPase assays. | Follow kit protocol precisely; avoid phosphate contamination from buffers or glassware. |
| Glucose-6-Phosphate Dehydrogenase (G6PDH) | Coupling enzyme for spectrophotometric assays of PGI and HK activity (measures NADPH production). | Choose bacterial (L. mesenteroides) G6PDH for use with NAD+ or mammalian for NADP+. |
| Liver Microsomal Fractions | Source of native, membrane-associated G6Pase complex for physiological substrate profiling. | Prepare fresh or purchase commercially prepared, characterized lots. Store at -80°C. |
| GLUT-Specific Inhibitors (e.g., Cytochalasin B, BAY-876) | To confirm and dissect 2-DG uptake pathways via specific GLUT isoforms. | Determine IC50 in your cell model, as potency varies by GLUT type and cell background. |
| Anti-2-DG-6-P Antibody | For immunodetection of trapped 2-DG-6-P in fixed cells or tissue sections (IHC, IF). | Specificity validation is crucial; must not cross-react with G6P or other phospho-metabolites. |
This whitepaper details the core cellular consequences of 2-Deoxy-D-glucose (2DG) exposure, a foundational research tool and therapeutic candidate. The mechanistic understanding begins with 2DG's uptake via glucose transporters (GLUTs) and subsequent phosphorylation by hexokinase to 2DG-6-phosphate. Unlike glucose-6-phosphate, 2DG-6-phosphate cannot be isomerized or further metabolized glycolytically, leading to its intracellular accumulation ("trapping"). This molecular trapping initiates a cascade of interconnected cellular stress pathways—ATP depletion, glycolytic inhibition, and ER stress—which are the subject of this technical guide. Elucidating this cascade is critical for research in cancer metabolism, neurodegeneration, and metabolic disease.
Core Mechanisms & Quantitative Data
ATP Depletion and Glycolytic Inhibition
2DG-6-phosphate competitively inhibits hexokinase and glucose-6-phosphate isomerase, halting glycolysis at its initial steps. This directly reduces the net yield of ATP from glycolysis, a crucial energy source, especially for highly glycolytic cells like cancer cells. The degree of depletion is time- and concentration-dependent.
Table 1: Quantification of Cellular ATP Depletion and Glycolytic Inhibition by 2DG
| Cell Line / Model | 2DG Concentration | Exposure Time | ATP Reduction (% of Control) | Glycolytic Rate Reduction (e.g., ECAR) | Key Measurement Method |
|---|---|---|---|---|---|
| MCF-7 Breast Cancer | 10 mM | 4 hours | 70-80% | ~85% | Luminescent ATP assay, Seahorse |
| Glioblastoma U87 | 5 mM | 6 hours | 60-70% | ~75% | Luminescent ATP assay, Seahorse |
| Primary Neurons | 2 mM | 24 hours | 40-50% | ~60% | HPLC, Luminescent assay |
| HCT116 Colon Carcinoma | 20 mM | 2 hours | >90% | >95% | Bioluminescence, 2-NBDG uptake |
Induction of Endoplasmic Reticulum (ER) Stress
ATP depletion disrupts protein glycosylation and folding within the ER, leading to the accumulation of unfolded proteins. This triggers the Unfolded Protein Response (UPR), a tripartite signaling cascade mediated by IRE1α, PERK, and ATF6.
Table 2: Markers of ER Stress/UPR Induction by 2DG Treatment
| UPR Arm | Key Sensor | Downstream Event | Measurable Marker | Typical Fold-Increase (e.g., 5mM 2DG, 8h) |
|---|---|---|---|---|
| IRE1α | IRE1α | XBP1 mRNA splicing, RIDD | sXBP1, CHOP (indirect) | sXBP1: 3-5x |
| PERK | PERK | eIF2α phosphorylation, ATF4 translation | p-eIF2α, ATF4, CHOP | p-eIF2α: 2-4x; CHOP: 10-15x |
| ATF6 | ATF6 | ATF6 cleavage and nuclear translocation | Cleaved ATF6 (p50), GRP78/BiP | GRP78: 4-6x |
Experimental Protocols
Protocol: Measuring ATP Levels Post-2DG Treatment
Objective: Quantify intracellular ATP depletion using a luminescent assay. Reagents: CellTiter-Glo 2.0 Assay Kit, 2DG stock solution (1M in PBS), cell culture media. Procedure:
- Seed cells in a white-walled 96-well plate at optimal density. Incubate overnight.
- Prepare serial dilutions of 2DG in complete medium (e.g., 0, 2.5, 5, 10, 20 mM).
- Aspirate old medium, add 100µL of 2DG-containing medium per well. Include triplicates for each condition.
- Incubate for desired time (e.g., 2, 4, 8, 24h) at 37°C, 5% CO₂.
- Equilibrate CellTiter-Glo 2.0 reagent to room temperature.
- Add 100µL of reagent to each well. Mix on an orbital shaker for 2 minutes to induce cell lysis.
- Incubate at RT for 10 minutes to stabilize luminescent signal.
- Record luminescence using a plate reader. Plot RLU vs. 2DG concentration.
Protocol: Monitoring ER Stress via Western Blot (PERK arm)
Objective: Detect phosphorylation of eIF2α and induction of CHOP. Reagents: RIPA lysis buffer, protease/phosphatase inhibitors, anti-p-eIF2α (Ser51), anti-total eIF2α, anti-CHOP, anti-β-actin antibodies. Procedure:
- Treat cells in 6-well plates with 2DG (e.g., 5 mM) for 4, 8, and 12 hours.
- Lyse cells on ice with 150µL RIPA buffer containing inhibitors. Scrape, vortex, incubate on ice for 15 min.
- Centrifuge at 14,000 x g for 15 min at 4°C. Transfer supernatant to a new tube.
- Determine protein concentration using a BCA assay.
- Prepare samples with Laemmli buffer, denature at 95°C for 5 min.
- Load 20-30 µg protein per lane on a 4-20% gradient SDS-PAGE gel. Run at 120V.
- Transfer to PVDF membrane using wet transfer apparatus (100V, 60 min).
- Block membrane with 5% BSA in TBST for 1 hour.
- Incubate with primary antibodies (diluted in 5% BSA/TBST) overnight at 4°C.
- Wash 3x with TBST, incubate with HRP-conjugated secondary antibody for 1 hour at RT.
- Wash 3x, develop with ECL substrate, and image using a chemiluminescence system.
Signaling Pathway Diagrams
Title: 2DG Mechanism Leading to ATP Depletion and ER Stress
The Scientist's Toolkit: Key Research Reagent Solutions
Table 3: Essential Reagents and Kits for Investigating 2DG Mechanisms
| Reagent / Kit Name | Supplier Examples | Primary Function in 2DG Research |
|---|---|---|
| 2-Deoxy-D-glucose (2DG) | Sigma-Aldrich, Cayman Chem | The core molecule; induces metabolic blockade. Use radiolabeled [³H]-2DG for uptake/trapping studies. |
| CellTiter-Glo 2.0 Assay | Promega | Luminescent measurement of cellular ATP levels post-2DG treatment. |
| Seahorse XF Glycolysis Stress Test Kit | Agilent Technologies | Direct real-time measurement of extracellular acidification rate (ECAR) to quantify glycolytic inhibition. |
| 2-NBDG (Fluorescent Glucose Analog) | Thermo Fisher | Flow cytometry or microscopy to visualize and semi-quantify glucose transporter activity and inhibition. |
| Thapsigargin | Tocris Bioscience | Positive control for ER stress induction; acts via SERCA inhibition. |
| Antibody: Phospho-eIF2α (Ser51) | Cell Signaling Technology | Key marker for PERK pathway activation in ER stress by Western blot. |
| Antibody: CHOP (DDIT3) | Santa Cruz Biotechnology | Reliable marker for integrated ER stress response and pro-apoptotic signaling. |
| XBP1 Splicing Assay Kit | BioVision | Detects the spliced form of XBP1 (sXBP1), a specific marker for IRE1α arm activation. |
| D-glucose (Standard Control) | Various | Essential control to demonstrate competition and specificity of 2DG effects. |
Harnessing the Trap: Research and Therapeutic Applications of 2-DG Uptake
This whitepaper details the mechanistic foundation of 2-Deoxyglucose (2-DG) as the archetype for metabolic imaging radiotracers, specifically Fluorodeoxyglucose (FDG) for Positron Emission Tomography (PET). Within the broader thesis on 2-DG's cellular uptake and trapping, we explore how its biochemical principles were logically and successfully translated into the premier clinical and research imaging tool, FDG-PET. Understanding this prototype-to-application pipeline remains critical for researchers developing novel radiotracers targeting other metabolic pathways.
Biochemical Mechanism: Uptake and Trapping
Comparative Metabolism of Glucose, 2-DG, and FDG
The foundational principle relies on the structural analogy to glucose, enabling competitive uptake via glucose transporters (GLUTs), followed by intracellular phosphorylation by hexokinase (HK). The critical design feature is the subsequent metabolic blockade.
Table 1: Comparative Metabolic Pathways of Glucose, 2-DG, and FDG
| Step | Glucose | 2-Deoxyglucose (2-DG) | Fluorodeoxyglucose (FDG) |
|---|---|---|---|
| Transport | Via GLUTs (e.g., GLUT1, GLUT4) | Same as glucose. Competitive uptake. | Same as glucose. Uptake reflects GLUT expression & activity. |
| Phosphorylation | By Hexokinase/Glucokinase → Glucose-6-Phosphate (G6P) | By Hexokinase → 2-Deoxyglucose-6-Phosphate (2-DG-6-P) | By Hexokinase → FDG-6-Phosphate (FDG-6-P) |
| Next Metabolic Fate | G6P is isomerized by G6P Isomerase and proceeds through glycolysis or PPP. | 2-DG-6-P is NOT a substrate for G6P Isomerase. It cannot be metabolized further. | FDG-6-P is NOT a substrate for G6P Isomerase. It is metabolically trapped. |
| De-phosphorylation | Regulated by Glucose-6-Phosphatase (in liver, kidney). | 2-DG-6-P is a poor substrate for G6P phosphatase. Slow reversal. | FDG-6-P is a very poor substrate for G6P phosphatase. Effectively irreversible trapping in most tissues. |
| Detection | N/A (endogenous) | Measured via radioactivity (³H or ¹⁴C) in autoradiography. | Detected via positron emission (¹⁸F) in PET. |
Key Signaling and Metabolic Pathway
Diagram 1: Mechanism of 2-DG and FDG Metabolic Trapping (76 chars)
Foundational 2-DG Experimental Protocols
Protocol 1: In Vitro Cellular Uptake and Trapping Assay (Radioactive 2-DG)
This classic protocol measures the rate of 2-DG accumulation in cultured cells.
Objective: Quantify glucose transporter activity and hexokinase activity in cells under various experimental conditions (e.g., insulin stimulation, hypoxia, drug treatment).
Materials:
- Cultured cells (e.g., cancer cell lines, adipocytes).
- Krebs-Ringer Phosphate (KRP) or HEPES-buffered assay medium, low glucose.
- [³H] or [¹⁴C] labeled 2-Deoxy-D-glucose (specific activity ~10-15 Ci/mmol).
- Unlabeled 2-DG and/or D-glucose for competition.
- Phloretin or Cytochalasin B (transport inhibitor).
- Phosphate-Buffered Saline (PBS), ice-cold.
- Cell lysis buffer (e.g., 0.1% SDS in 0.1N NaOH).
- Scintillation cocktail and vials.
Procedure:
- Cell Preparation: Plate cells in multi-well plates. Prior to assay, wash cells 2x with warm, glucose-free assay medium. Serum-starve if required.
- Pre-treatment: Incubate cells with experimental modifiers (e.g., insulin, inhibitors) for specified time in assay medium.
- Uptake Phase: Replace medium with assay medium containing 0.1-1.0 µCi/mL [³H]2-DG and a known concentration of unlabeled 2-DG (e.g., 0.1 mM). For transport-specific measurement, include a parallel set with 10-50 µM Cytochalasin B.
- Incubation: Incubate at 37°C for a precise time (e.g., 5, 10, 20 minutes). Linear uptake must be confirmed.
- Termination: Rapidly aspirate radiolabeled medium. Wash cells 3x rapidly with ice-cold PBS to stop transport.
- Lysis: Lyse cells in 0.1% SDS/0.1N NaOH. Transfer lysate to scintillation vials.
- Quantification: Add scintillation fluid, mix, and count radioactivity in a liquid scintillation counter. Normalize counts to total cellular protein (BCA assay).
Protocol 2: Quantitative Autoradiography (QAR) with [¹⁴C]2-DG in Animal Models
The seminal Sokoloff protocol, enabling regional metabolic mapping in vivo.
Objective: Measure the local cerebral metabolic rate for glucose (LCMRglc) in animal brain sections.
Materials:
- Animal model (rat, mouse).
- [¹⁴C]2-Deoxy-D-glucose.
- Timed infusion setup (iv bolus + constant infusion).
- Arterial catheter for blood sampling.
- Microtome/Cryostat.
- [¹⁴C] standards (calibrated to tissue equivalence).
- X-ray film or phosphor imaging plates.
- Densitometry/Image analysis software.
Procedure:
- Surgical Prep: Implant arterial catheter under anesthesia. Maintain physiological parameters.
- Tracer Administration: Administer a precise intravenous bolus of [¹⁴C]2-DG (~20-40 µCi/100g). Start timed arterial blood sampling immediately (frequent early samples, then less frequent over 45 min).
- Blood Analysis: Measure plasma [¹⁴C]2-DG concentration and plasma glucose concentration in each sample.
- Termination & Tissue Prep: At 45 minutes, decapitate animal. Rapidly remove brain, freeze in isopentane at -45°C. Section brain coronally (20 µm thickness) in a cryostat at -20°C.
- Autoradiography: Mount sections on slides. Expose, along with calibrated [¹⁴C] standards, to X-ray film or phosphor imaging plates for 7-14 days.
- Quantitative Analysis:
- Digitize film/images.
- Convert optical density in each brain region to tissue [¹⁴C] concentration (nCi/g) using the standard curve.
- Calculate LCMRglc using the operational equation derived from a kinetic model that accounts for plasma input function and rate constants for transport/phosphorylation.
Translation to FDG-PET: From Prototype to Clinical Tool
The direct translation involved replacing the ²H or ¹⁴C with the positron-emitting isotope ¹⁸F at the 2-position, creating ²-[¹⁸F]Fluoro-2-deoxy-D-glucose. The biochemical principle is identical, but the detection modality shifted to PET coincidence detection.
Table 2: Key Translational Steps from 2-DG to FDG-PET
| Aspect | 2-DG (Prototype) | FDG (Application) | Significance of Translation |
|---|---|---|---|
| Detection Isotope | ³H, ¹⁴C (Beta-emitters) | ¹⁸F (Positron-emitter, 110 min half-life) | Enabled external, tomographic, quantitative imaging in vivo. |
| Primary Method | Autoradiography (ex vivo), Liquid Scintillation Counting (in vitro). | Positron Emission Tomography (PET) (in vivo). | Non-invasive, repeatable, applicable to humans. Provides 3D maps. |
| Temporal Resolution | Single time-point (typically 45 min post-injection). | Dynamic scanning possible over time. | Allows full kinetic modeling (Patlak analysis) for precise quantification of metabolic rate. |
| Spatial Resolution | Microscopic (~10-50 µm) but ex vivo. | Macroscopic (3-5 mm in clinical PET; ~1 mm in preclinical). | Enables whole-body scanning and longitudinal studies in the same subject. |
| Key Kinetic Model | Sokoloff Operational Equation (3-rate constants). | Compartmental Models (e.g., 3-compartment, 4-rate constants) + Patlak Plot. | Accounts for FDG-6-P dephosphorylation (k₄), critical in tissues like liver. |
The Scientist's Toolkit: Research Reagent Solutions
Table 3: Essential Reagents and Materials for 2-DG/FDG Mechanism Research
| Item | Function/Description | Example/Catalog Context |
|---|---|---|
| [³H]2-Deoxy-D-glucose | Radiolabeled tracer for in vitro uptake assays. High specific activity is crucial for sensitivity. | PerkinElmer NET328A; ARC 0112A. |
| [¹⁴C]2-Deoxy-D-glucose | Radiolabeled tracer for in vivo QAR studies and some in vitro work. Longer half-life than ¹⁸F. | American Radiolabeled Chemicals ARC 0114. |
| 2-Deoxy-D-glucose (unlabeled) | Competitive inhibitor of glucose metabolism. Used in control experiments and to define specific uptake. | Sigma Aldrich D8375; used at 0.1-100 mM depending on assay. |
| Cytochalasin B | Potent inhibitor of facilitative glucose transporters (GLUTs). Used to define transporter-mediated component of uptake. | Tocris Bioscience 1233; typical use 10-50 µM. |
| Phloretin | Alternative GLUT inhibitor. Less specific but useful. | Sigma Aldrich P7912. |
| 2-Fluoro-2-deoxy-D-glucose (unlabeled FDG) | Cold standard for HPLC analysis of radiochemical purity of [¹⁸F]FDG and for competition studies. | ABX 0280. |
| Hexokinase Assay Kit | Measures hexokinase enzymatic activity in cell/tissue lysates, a key parameter influencing tracer trapping. | Sigma Aldrich MAK091; colorimetric. |
| GLUT Isoform-Specific Antibodies | For Western blot or immunofluorescence to correlate tracer uptake with transporter protein expression levels. | Various suppliers (e.g., MilliporeSigma, Cell Signaling Tech). |
| Calibrated [¹⁴C] Standards for QAR | Essential for converting optical density to tissue radioactivity concentration in autoradiography. | American Radiolabeled Chemicals ARC 146. |
| FDG-PET Kinetic Modeling Software | For quantitative analysis of dynamic PET data (e.g., PMOD, MIAKAT). Implements compartmental and Patlak analyses. | Commercial and academic platforms. |
This technical guide details in vitro assays for quantifying glycolytic metabolism within the context of researching 2-deoxyglucose (2DG), a glucose analog used to probe cellular glucose utilization. 2DG is phosphorylated by hexokinase to 2DG-6-phosphate but cannot be further metabolized, leading to its accumulation and inhibition of glycolysis. Understanding its cellular uptake and trapping mechanisms is central to its application as a metabolic probe and therapeutic agent in cancer and other diseases.
Table 1: Comparative Analysis of Core Glycolytic Assays
| Assay Parameter | Glycolytic Flux (ECAR) | Glucose Uptake (2-NBDG) | Cell Viability (MTT) |
|---|---|---|---|
| Primary Readout | Extracellular acidification rate (mpH/min) | Fluorescence intensity (RFU) | Formazan absorbance (570 nm) |
| Typical Assay Time | 60-120 minutes | 10-30 minute uptake | 1-4 hour incubation |
| Key Instrument | Seahorse XF Analyzer | Flow cytometer / Plate reader | Microplate reader |
| Information Gained | Real-time rate of glycolysis | Specific glucose transporter activity | Mitochondrial dehydrogenase activity (proxy for viability) |
| Impact of 2DG | Acute inhibition of ECAR | Competitive inhibition of 2-NBDG uptake | Reduced absorbance under prolonged treatment |
Table 2: Characteristic 2-DG Pharmacological Parameters
| Parameter | Typical Range | Experimental Context |
|---|---|---|
| Ki for Hexokinase | 0.05 - 0.2 mM | Competitive inhibition vs. glucose |
| Cellular Uptake Km | ~1 - 5 mM (via GLUTs) | Varies by cell type & GLUT expression |
| Therapeutic in vitro dose | 0.5 - 10 mM | Often combined with other agents |
| IC50 for proliferation | 2 - 20 mM | Highly cell line dependent |
Experimental Protocols
Protocol 1: Measuring Glycolytic Flux via Extracellular Acidification Rate (ECAR)
Principle: Real-time measurement of extracellular pH change, primarily driven by lactate production during glycolysis. Materials: Seahorse XF Analyzer, XF96 cell culture microplate, XF assay medium (pH 7.4), 2DG, oligomycin, glucose. Procedure:
- Seed cells in XF96 plate (e.g., 20,000 cells/well) and culture for 24h.
- Replace medium with unbuffered XF assay medium supplemented with 10 mM glucose. Incubate for 1h at 37°C, non-CO2.
- Load plate into Seahorse Analyzer for calibration.
- Perform a Glycolytic Rate Test: Baseline ECAR is recorded, then sequential injections of:
- Oligomycin (1.5 µM): Inhibits mitochondrial ATP synthase, forcing ATP production through glycolysis.
- 2DG (50 mM): Competitive inhibitor of glycolysis. The drop in ECAR confirms glycolysis is acidification source.
- Data Analysis: Calculate glycolytic capacity (post-oligomycin ECAR) and glycolytic reserve.
Protocol 2: Quantifying Glucose Uptake using Fluorescent 2-NBDG
Principle: 2-(N-(7-Nitrobenz-2-oxa-1,3-diazol-4-yl)Amino)-2-Deoxyglucose (2-NBDG) is a fluorescent glucose analog competitively inhibited by 2DG. Materials: 2-NBDG stock solution, glucose-free buffer, flow cytometer or fluorescence plate reader. Procedure:
- Serum-starve cells (e.g., in 0.5% FBS medium) for 4-6 hours to upregulate GLUTs.
- Wash cells with warm, glucose-free PBS or uptake buffer.
- Pre-treatment (for 2DG studies): Incubate cells with varying doses of 2DG (e.g., 0-20 mM) for 15-30 minutes.
- Add 2-NBDG (final conc. 100-300 µM) to cells and incubate for 10-20 minutes at 37°C.
- Immediately place cells on ice and wash 3x with ice-cold PBS to stop uptake.
- Quantification:
- For flow cytometry: Analyze fluorescence intensity (FITC channel) for 10,000 events.
- For plate reader: Lyse cells in 1% Triton-X100, measure fluorescence (Ex/Em ~485/535 nm).
- Control: Include wells with cytochalasin B (GLUT inhibitor) to define non-specific uptake.
Protocol 3: Assessing Cell Viability Post-2DG Treatment (MTT Assay)
Principle: Metabolically active cells reduce yellow MTT to purple formazan crystals, proportional to mitochondrial activity. Materials: MTT reagent (3-(4,5-dimethylthiazol-2-yl)-2,5-diphenyltetrazolium bromide), DMSO, microplate reader. Procedure:
- Seed cells in a 96-well plate. After adherence, treat with a dose range of 2DG (e.g., 0-50 mM) for 24-72h.
- Add MTT reagent (0.5 mg/mL final concentration) to each well. Incubate for 2-4 hours at 37°C.
- Carefully aspirate the medium. Dissolve the formed formazan crystals in 100 µL DMSO.
- Shake plate gently for 10 minutes and measure absorbance at 570 nm (reference ~650 nm).
- Data Analysis: Calculate % viability relative to untreated control. IC50 values can be determined using nonlinear regression.
The Scientist's Toolkit
Table 3: Essential Research Reagent Solutions
| Reagent / Material | Function / Role | Key Consideration |
|---|---|---|
| 2-Deoxy-D-glucose (2DG) | Competitive substrate for hexokinase; traps as 2DG-6-P, inhibiting glycolysis. | High-purity grade required; prepare fresh in serum-free medium. |
| 2-NBDG | Fluorescent glucose analog for real-time uptake measurement. | Light-sensitive; optimize concentration per cell type. |
| Seahorse XF Glycolytic Stress Test Kit | Standardized reagents for ECAR assay (glucose, oligomycin, 2DG). | Ensures assay reproducibility and comparability. |
| Oligomycin | ATP synthase inhibitor; forces glycolytic metabolism. | Toxic compound; requires careful handling. |
| Cytochalasin B | Potent inhibitor of facilitative glucose transporters (GLUTs). | Used as a negative control for glucose uptake assays. |
| XF Assay Medium (Agilent) | DMEM-based, unbuffered medium for Seahorse assays. | Must be pH-adjusted to 7.4 on day of use. |
Visualizations
Title: 2DG Uptake, Trapping, and Metabolic Inhibition Mechanism
Title: Glycolytic Flux Assay Experimental Workflow
Title: Logical Flow Integrating 2DG Thesis with Core Assays
The therapeutic targeting of cancer metabolism remains a cornerstone of oncology research. A central thesis in this field posits that the therapeutic efficacy of 2-Deoxy-D-glucose (2-DG) is fundamentally governed by its specific mechanism of cellular uptake and subsequent metabolic trapping. This guide elaborates on this thesis, detailing how 2-DG's competition with glucose for transporters (primarily GLUTs) and hexokinase-mediated phosphorylation to 2-DG-6-phosphate (which cannot be further metabolized) leads to intracellular accumulation. This process inhibits glycolysis, induces energetic and ER stress, and disrupts N-linked glycosylation. The exploration of 2-DG, both alone and in combination, hinges on quantitatively understanding this uptake-trapping dynamic across varied tumor contexts.
Mechanism of Action: Uptake, Trapping, and Downstream Consequences
2-DG exploits the Warburg effect, wherein cancer cells exhibit heightened glycolysis even under normoxic conditions. The sequential mechanism is as follows:
- Uptake: 2-DG enters cells via facilitative glucose transporters (GLUTs), primarily GLUT1 and GLUT3, which are frequently overexpressed in cancers.
- Phosphorylation & Trapping: Hexokinase II (HK-II), also overexpressed and mitochondria-bound in many cancers, phosphorylates 2-DG to 2-DG-6-phosphate (2-DG-6P). This metabolite is not a substrate for glucose-6-phosphate isomerase, causing it to accumulate and inhibit HK-II through product feedback.
- Dual Pathway Inhibition:
- Glycolytic Inhibition: Competition with glucose and HK-II inhibition reduce ATP production.
- N-Glycosylation Inhibition: 2-DG-6P can be incorporated into oligosaccharide chains, disrupting proper protein folding in the endoplasmic reticulum (ER).
Diagram: 2-DG Mechanism of Action and Cellular Impact
2-DG as a Monotherapy: Efficacy and Limitations
As a single agent, 2-DG has shown variable antitumor efficacy in vitro and in preclinical models. Its success is highly context-dependent, often requiring specific metabolic vulnerabilities.
Table 1: Monotherapy Efficacy of 2-DG in Preclinical Models
| Cancer Type (Model) | Dose Range | Key Outcome Metric | Reported Efficacy | Proposed Sensitivity Factor |
|---|---|---|---|---|
| Glioblastoma (In vivo, U87 MG xenograft) | 500 mg/kg, i.p., daily | Tumor Volume Inhibition | ~50% reduction vs. control | High basal GLUT1/HK-II expression |
| Breast Cancer (In vitro, MDA-MB-231) | 5-20 mM | Cell Viability (IC₅₀) | IC₅₀ ≈ 8 mM | Glycolytic dependency |
| Prostate Cancer (In vivo, TRAMP model) | 250 mg/kg in diet | Tumor Incidence | 30% reduction | Androgen receptor status |
| Pancreatic Cancer (In vitro, MIA PaCa-2) | 10-40 mM | Clonogenic Survival | Significant reduction at >20 mM | Low glucose microenvironment |
| Non-Small Cell Lung Cancer (In vitro, A549) | 2-10 mM | Apoptosis Induction | ~25% apoptosis at 10 mM | EGFR mutation status |
Key Limitation: The high concentrations (often mM) required in vitro and the modest single-agent efficacy in vivo highlight issues with potency, systemic toxicity (including cardiotoxicity at high doses), and compensatory metabolic rewiring by cancer cells.
Combinatorial Regimens: Rationale and Synergy
The mechanistic thesis informs rational combination strategies. 2-DG-induced stresses create vulnerabilities that can be exploited by other agents.
- With Ionizing Radiation (IR): 2-DG inhibits glycolysis, reducing the tumor's ability to recover from radiation-induced damage via anaerobic metabolism in hypoxic regions. It may also inhibit DNA repair.
- With Chemotherapy: Combining with agents like Doxorubicin or Paclitaxel can enhance apoptosis by exacerbating energy stress.
- With Targeted Therapies: Synergy is observed with PI3K/AKT/mTOR inhibitors, as this pathway regulates GLUT expression and glycolysis. Dual targeting crushes metabolic adaptation.
- With Proteasome Inhibitors: 2-DG-induced ER stress increases the burden of misfolded proteins; proteasome inhibitors (e.g., Bortezomib) block their clearance, leading to catastrophic ER stress.
- With Autophagy Inhibitors: 2-DG-induced energy stress can trigger pro-survival autophagy. Inhibiting autophagy (e.g., with Chloroquine) forces cells into apoptosis.
Table 2: Exemplary Combinatorial Regimens with 2-DG
| Combination Partner | Cancer Model | Mechanistic Rationale | Reported Synergy (CI<1) | Key Experimental Readout |
|---|---|---|---|---|
| Radiation Therapy | Glioblastoma (U251) | Reduced post-radiation metabolic recovery & NHEJ repair | Yes, CI ~0.7 | Clonogenic survival assay |
| Doxorubicin | Breast Cancer (MCF-7) | Enhanced energy crisis & DNA damage | Yes, CI ~0.6 | Caspase-3/7 activity, ATP levels |
| PI3K Inhibitor (LY294002) | Ovarian Cancer (SKOV3) | Concurrent inhibition of glycolysis and its upstream driver | Yes, CI ~0.5 | p-AKT(S473) blot, viability |
| Bortezomib | Multiple Myeloma (RPMI 8226) | Convergent induction of unresolved ER stress | Yes, CI ~0.3 | CHOP/GADD153 expression, viability |
| Chloroquine (Autophagy Inhib.) | Pancreatic Cancer (PANC-1) | Blockade of 2-DG-induced pro-survival autophagy | Yes, CI ~0.8 | LC3-II accumulation (immunoblot) |
Diagram: Logical Framework for 2-DG Combination Therapy
Detailed Experimental Protocols
Protocol 1: Measuring 2-DG Uptake and Trapping via Radiolabeled [³H]-2-DG Assay
- Objective: Quantify the rate of 2-DG uptake and phosphorylation in cultured cancer cells.
- Reagents: [³H]-2-DG, unlabeled 2-DG, glucose-free medium, PBS, cell lysis buffer (20 mM Tris, 1% Triton X-100), scintillation fluid.
- Procedure:
- Plate cells in 24-well plates and grow to 80% confluence.
- Wash cells twice with warm, glucose-free medium.
- Incubate with glucose-free medium containing 0.5 µCi/mL [³H]-2-DG ± excess unlabeled 2-DG (for non-specific binding) for desired time points (e.g., 1, 5, 10, 30 min) at 37°C.
- Terminate uptake by rapid washing with ice-cold PBS.
- Lyse cells with lysis buffer for 30 min.
- Transfer lysate to scintillation vials, add scintillation fluid, and count radioactivity (DPM) in a scintillation counter.
- Trapping Assay Variation: After uptake and washing, incubate cells with medium containing high glucose for 5 min to efflux non-phosphorylated 2-DG before lysis. The remaining radioactivity represents trapped 2-DG-6P.
- Data Analysis: Calculate specific uptake (total DPM - non-specific DPM), normalize to protein content, and express as pmol/min/mg protein.
Protocol 2: Assessing Combination Synergy via Chou-Talalay Method
- Objective: Determine if the effect of 2-DG combined with another drug is additive, antagonistic, or synergistic.
- Reagents: 2-DG, combination drug, cell viability reagent (e.g., MTT, Resazurin), DMSO.
- Procedure:
- Seed cells in 96-well plates.
- The next day, treat with a matrix of serial dilutions of 2-DG and the combination drug (e.g., 4x4 concentrations).
- Incubate for 72 hours.
- Add viability reagent (e.g., MTT) according to manufacturer's protocol, incubate, and measure absorbance.
- Perform the experiment in triplicate.
- Data Analysis: Use software like CompuSyn. Input dose and fraction affected (Fa = 1 - viability fraction) for each single agent and combination. The software will calculate the Combination Index (CI): CI < 1 = synergy, CI = 1 = additive, CI > 1 = antagonism.
The Scientist's Toolkit: Key Research Reagent Solutions
| Reagent/Material | Supplier Examples | Function in 2-DG Research |
|---|---|---|
| 2-Deoxy-D-Glucose (2-DG), high purity | Sigma-Aldrich, Cayman Chemical, MedChemExpress | The core investigational compound for treatment experiments. |
| [³H]-2-Deoxy-D-Glucose | American Radiolabeled Chemicals, PerkinElmer | Radiolabeled tracer for quantitative studies of cellular uptake and transport kinetics. |
| GLUT1 / GLUT3 Antibodies | Cell Signaling Technology, Abcam | Detect protein expression levels of primary 2-DG transporters via immunoblot or IHC. |
| Phospho-Hexokinase II (Ser774) Antibody | Cell Signaling Technology | Assess HK-II activity and regulation in response to 2-DG and other stressors. |
| ATP Assay Kit (Luminescence) | Promega, Abcam, Cayman Chemical | Quantify cellular ATP levels to measure glycolytic inhibition and energy stress. |
| ER Stress Antibody Sampler Kit (CHOP, BiP, etc.) | Cell Signaling Technology | Monitor activation of the unfolded protein response (UPR) via immunoblot. |
| Seahorse XF Glycolysis Stress Test Kit | Agilent Technologies | Profile real-time glycolytic function (ECAR) in live cells before/after 2-DG treatment. |
| LC3B Antibody | Novus Biologicals, Sigma-Aldrich | Detect LC3-II conversion as a marker of autophagy induction following 2-DG treatment. |
| AMPKα (phospho-Thr172) Antibody | Cell Signaling Technology | Assess activation of the AMPK energy-sensing pathway. |
| Matrigel Matrix | Corning | For establishing 3D tumor spheroid cultures, which may better mimic in vivo metabolic gradients for 2-DG testing. |
This whitepaper examines the strategic exploitation of host cell metabolic dependencies for antiviral and anti-parasitic therapy, with a specific focus on the research context of 2-deoxyglucose (2DG) cellular uptake and trapping. The core principle involves targeting metabolic pathways that are essential for pathogen replication but dispensable for host cell survival under therapeutic conditions. The repurposing of glycolytic inhibitors like 2DG, which acts as a competitive antagonist of glucose, demonstrates proof-of-concept for this approach.
Intracellular pathogens, including viruses and protozoan parasites, are obligate hijackers of host cell machinery. Their replication is critically dependent on the host's metabolic provisioning of energy (ATP), biosynthetic precursors (nucleotides, amino acids, lipids), and reducing equivalents (NADPH). This dependency creates a therapeutic vulnerability: by selectively modulating host metabolic pathways that are disproportionately utilized by the pathogen, one can suppress infection with a high therapeutic index.
Core Mechanistic Context: The 2-Deoxyglucose (2DG) Paradigm
2DG serves as a foundational model for this strategy. Its mechanism involves:
- Uptake: Transport into cells via glucose transporters (GLUTs).
- Phosphorylation: Conversion to 2DG-6-phosphate by hexokinase.
- Metabolic Trapping: 2DG-6-phosphate is not a substrate for phosphohexose isomerase, causing it to accumulate and inhibit glycolysis.
- Downstream Effects: Depletion of ATP, disruption of N-linked glycosylation via mannose metabolism inhibition, and induction of ER stress/unfolded protein response (UPR).
This dual action—energy depletion and disruption of protein maturation—is particularly deleterious to pathogens with high metabolic and glycoprotein synthesis demands.
Host Metabolic Dependencies in Viral Infections
Viruses lack intrinsic metabolic pathways and therefore extensively reprogram host metabolism to support replication.
Key Viral Targets and Intervention Strategies
- Glycolysis & Glutaminolysis: Many viruses (e.g., HSV, HCMV, Influenza, SARS-CoV-2) upregulate aerobic glycolysis and glutamine catabolism. Inhibitors like 2DG, lonidamine, or glutaminase inhibitors (CB-839) show antiviral activity.
- Fatty Acid Synthesis (FAS): Essential for viral envelope formation. FAS inhibitors (e.g., TVB-3166, C75) inhibit HCV, Dengue, and HIV replication.
- Nucleotide Synthesis: Required for viral genomic replication. Dihydroorotate dehydrogenase (DHODH) inhibitors (e.g., brequinar) block pyrimidine synthesis and show broad-spectrum antiviral effects.
- Hexosamine Biosynthesis Pathway (HBP): Provides UDP-GlcNAc for glycosylation. Its inhibition impairs viral glycoprotein function.
Quantitative Data: Antiviral Effects of Metabolic Modulators
Table 1: Efficacy of Metabolic Inhibitors Against Representative Viruses
| Pathogen | Metabolic Target | Inhibitor | Experimental Model | Key Outcome (e.g., EC₅₀ / % Inhibition) | Citation (Year) |
|---|---|---|---|---|---|
| SARS-CoV-2 | Glycolysis | 2-Deoxy-D-glucose (2DG) | Vero E6 cells | EC₅₀ ~ 4.5 mM; 90% plaque reduction at 10 mM | J. Biol. Chem. (2021) |
| Human Cytomegalovirus (HCMV) | Fatty Acid Synthesis | TVB-3166 | Human fibroblasts (HFFs) | EC₅₀ = 0.13 µM; >99% reduction in viral yield | mBio (2018) |
| Influenza A Virus | Glycolysis & N-Glycosylation | 2-Deoxy-D-glucose (2DG) | A549 cells | 2 log reduction in titer at 10 mM | Virology (2018) |
| Dengue Virus | Pyrimidine Synthesis | Brequinar (DHODH inhib.) | Huh-7 cells | EC₅₀ = 12.3 nM | Nature Microbiol. (2019) |
| Herpes Simplex Virus 1 (HSV-1) | Glycolysis | 2-Deoxy-D-glucose (2DG) | HeLa cells | 95% reduction in plaque formation at 5 mM | J. Virol. (2015) |
Detailed Protocol: Assessing Antiviral Efficacy of 2DG via Plaque Assay
Objective: To quantify the reduction in infectious viral particles following treatment with 2DG. Materials: Confluent monolayer of permissive cells (e.g., Vero E6), virus stock, 2DG stock solution (1M in PBS), maintenance medium (low-glucose recommended), agarose overlay, fixation solution (10% formalin), staining solution (0.1% crystal violet). Procedure:
- Seed cells in 12-well plates to achieve 100% confluency at time of infection.
- Treat cells with serial dilutions of 2DG (e.g., 0.5 mM to 20 mM) in low-glucose maintenance medium for 1 hour prior to infection.
- Infect wells with ~50-100 plaque-forming units (PFU) of virus. Adsorb for 1 hour with gentle rocking every 15 minutes.
- Remove inoculum and replace with maintenance medium containing the corresponding concentration of 2DG and 1% agarose.
- Incubate plates at appropriate temperature (e.g., 37°C, 5% CO₂) for 48-72 hours until plaques are visible.
- Fix and Stain: Add 10% formalin on top of the overlay for 2 hours. Remove agarose plug and fixative, then stain with crystal violet for 15 minutes. Rinse and air dry.
- Quantify: Count plaques manually. Calculate percentage inhibition and EC₅₀ using non-linear regression analysis (e.g., in GraphPad Prism).
Host Metabolic Dependencies in Protozoan Parasitic Infections
Intracellular parasites like Plasmodium, Toxoplasma, and Leishmania possess their own metabolic networks but remain reliant on scavenging specific host metabolites.
Key Parasite Targets and Intervention Strategies
- Glucose and Glutamine: Plasmodium falciparum consumes host glucose at high rates. 2DG and glutamine antagonists can suppress growth.
- Lipid Scavenging: Toxoplasma gondii cannot synthesize cholesterol and scavenges it from host low-density lipoproteins (LDL). Modulation of host LDL uptake is a potential strategy.
- Host Arginine Metabolism: Leishmania parasites are auxotrophic for arginine, relying on host cationic amino acid transporters (CATs). Depleting extracellular arginine or inhibiting CAT-1 impairs parasite viability.
Quantitative Data: Anti-Parasitic Effects of Host-Directed Metabolic Modulators
Table 2: Efficacy of Host-Directed Metabolic Modulators Against Protozoan Parasites
| Parasite | Host Metabolic Target | Modulator/Strategy | Experimental Model | Key Outcome (e.g., IC₅₀ / % Growth Inhibition) | Citation (Year) |
|---|---|---|---|---|---|
| Plasmodium falciparum | Glycolysis | 2-Deoxy-D-glucose (2DG) | In vitro culture (RBCs) | IC₅₀ ~ 8.2 mM; synergy with artemisinin | Antimicrob. Agents Chemother. (2018) |
| Toxoplasma gondii | LDL-derived Cholesterol | Probucol (LDL inhibitor) | Human fibroblasts (HFFs) | 80% reduction in parasite replication at 10 µM | mSphere (2020) |
| Leishmania donovani | Arginine Transport | Host CAT-1 siRNA knockdown | Murine macrophages | ~70% reduction in intracellular amastigotes | PLOS Pathog. (2019) |
| Trypanosoma cruzi | Autophagy Induction | Rapamycin (mTOR inhibitor) | Cardiomyocytes | 65% reduction in amastigote load at 100 nM | Cell. Microbiol. (2021) |
Detailed Protocol: Evaluating Anti-PlasmodiumActivity of 2DG via SYBR Green Assay
Objective: To measure growth inhibition of Plasmodium falciparum in human erythrocytes treated with 2DG. Materials: Synchronized P. falciparum culture (ring stage), human O+ erythrocytes, complete RPMI 1640 medium, 2DG stock, 96-well black plates, SYBR Green I nucleic acid stain, lysis buffer (20 mM Tris, 5 mM EDTA, 0.008% saponin, 0.08% Triton X-100), sorbitol. Procedure:
- Set Up Culture: Adjust parasitemia to 0.5-1.0% ring stage and hematocrit to 2% in complete medium.
- Drug Treatment: Add 100 µL of culture to wells containing serial dilutions of 2DG (in triplicate). Include drug-free control wells.
- Incubate: Place plates in a gas mixture (5% O₂, 5% CO₂, 90% N₂) at 37°C for 72 hours.
- Lysis and Staining: Freeze plates at -80°C for 30 min, then thaw. Add 100 µL of SYBR Green I solution (diluted 1:5000 in lysis buffer) to each well. Incubate in the dark for 1 hour.
- Measurement: Read fluorescence (excitation 485 nm, emission 530 nm) using a plate reader.
- Analysis: Calculate percentage growth inhibition relative to untreated controls. Determine IC₅₀ values using dose-response curve fitting.
Visualization of Core Pathways and Workflows
Diagram 1: Mechanism of 2DG Action and Downstream Effects (76 Chars)
Diagram 2: Host-Directed Metabolic Drug Discovery Workflow (74 Chars)
The Scientist's Toolkit: Essential Research Reagents
Table 3: Key Reagent Solutions for Metabolic Host-Directed Therapy Research
| Reagent / Kit Name | Primary Function / Target | Brief Explanation of Use in Context |
|---|---|---|
| 2-Deoxy-D-Glucose (2DG) | Competitive hexokinase inhibitor / Glycolysis | Gold-standard probe for inducing glycolytic inhibition and energy stress; used to validate pathogen dependence on host glycolysis. |
| Seahorse XF Glycolysis Stress Test Kit | Real-time ECAR measurement | Profiles glycolytic function of host cells pre- and post-infection to quantify pathogen-induced metabolic reprogramming. |
| 13C6-Glucose (or 13C5-Glutamine) | Stable isotope tracer | Used with LC-MS or GC-MS to map carbon fate through central metabolism (glycolysis, TCA, HBP) in infected vs. uninfected cells. |
| CB-839 (Telaglenastat) | Glutaminase inhibitor (GLS1) | Probes dependence on glutaminolysis. Useful for viruses/cancers reliant on glutamine for anapleurosis and biosynthesis. |
| TVB-3166 / C75 | Fatty Acid Synthase (FASN) inhibitor | Tests pathogen reliance on host de novo lipogenesis for membrane formation (e.g., viral envelopes, parasite membranes). |
| Brequinar Sodium | Dihydroorotate Dehydrogenase (DHODH) inhibitor | Blocks host pyrimidine synthesis, limiting nucleotide availability for viral genome replication. |
| 6-Diazo-5-oxo-L-norleucine (DON) | Broad-spectrum glutamine antagonist | Inhibits multiple glutamine-utilizing enzymes; a potent tool to assess glutamine addiction. |
| Rapamycin | mTORC1 inhibitor | Induces autophagy; used to test if enhanced host catabolism can limit intracellular parasite resources. |
| SYBR Green I Nucleic Acid Stain | Fluorescent DNA intercalator | High-throughput measurement of parasite (e.g., Plasmodium) or viral DNA replication in cell-based assays. |
| CAT-1/SLC7A1 siRNA | Knockdown of cationic amino acid transporter | Genetically validates host transporter dependency for parasites auxotrophic for arginine (e.g., Leishmania). |
This technical guide details advanced neurobiological applications framed within the ongoing research on the 2-deoxyglucose (2DG) mechanism of cellular uptake and trapping. 2DG, a glucose analog, is phosphorylated by hexokinase to 2DG-6-phosphate but not metabolized further, leading to its accumulation (trapping) within cells. This principle is foundational for mapping regional brain energy consumption and investigating metabolic disruptions in neurodegeneration. Current research leverages this mechanism to quantify neuronal activity and probe the bioenergetic deficits characteristic of diseases like Alzheimer's and Parkinson's.
Table 1: Key Metabolic Parameters of Glucose vs. 2-Deoxyglucose
| Parameter | Glucose | 2-Deoxyglucose (2DG) | Notes / Implications |
|---|---|---|---|
| Hexokinase Km | ~0.05 mM | ~0.1 mM | 2DG has lower affinity, requiring higher concentrations for similar phosphorylation rates. |
| Phosphorylated Product | Glucose-6-Phosphate (G6P) | 2-Deoxyglucose-6-Phosphate (2DG-6-P) | G6P enters glycolysis; 2DG-6-P is not a substrate for phosphohexose isomerase, leading to trapping. |
| Metabolic Fate | Glycolysis, TCA Cycle, PPP | Metabolic Dead-End (Trapped) | Accumulation is proportional to the rate of glucose uptake/phosphorylation. |
| Blood-Brain Barrier Transport | Via GLUT1 (High) | Via GLUT1 (High) | Comparable transport kinetics allow 2DG to serve as a valid proxy for glucose. |
| Isotope Common Labels | [¹⁴C], [³H], [¹⁸F] (FDG) | [¹⁴C], [³H], [¹⁸F] (FDG) | Radiolabeled versions enable autoradiography ([¹⁴C]2DG) and PET imaging ([¹⁸F]FDG). |
| Lumped Constant (LC) | 1 (by definition) | Typically 0.3-0.8 (species/region-dependent) | LC corrects for kinetic differences between 2DG and glucose; critical for quantitative CMRglc calculation. |
Table 2: Representative Cerebral Metabolic Rates (CMRglc) in Health and Neurodegeneration
| Brain Region / Condition | CMRglc (µmol/100g/min) | Method | Key Finding |
|---|---|---|---|
| Rat Sensorimotor Cortex (Rest) | ~80-100 | [¹⁴C]2DG Autoradiography | Baseline metabolic activity. |
| Rat Sensorimotor Cortex (Activated) | ~150-200 | [¹⁴C]2DG Autoradiography | ~2-fold increase with stimulation. |
| Human Cortex (Healthy Adult) | ~25-35 | [¹⁸F]FDG-PET | Lower than rodents due to scaling. |
| Alzheimer's Disease (Temporoparietal) | ~15-20 (↓30-40%) | [¹⁸F]FDG-PET | Hypometabolism pattern is a diagnostic biomarker. |
| Parkinson's Disease (Posterior Cortex) | ~20-25 (↓20-30%) | [¹⁸F]FDG-PET | Correlates with cognitive decline. |
Detailed Experimental Protocols
Protocol 1: [¹⁴C]2DG Quantitative Autoradiographyin vivo
This protocol quantifies local cerebral glucose utilization (LCGU) in rodent models.
I. Materials & Pre-experiment
- Animal Preparation: Freely moving or physiologically monitored (arterial/venous cannulation) rodent.
- Tracer Solution: High-specific-activity [¹⁴C]2DG (e.g., 100-300 mCi/mmol) in saline.
- Equipment: Arterial blood sampling catheters, rapid freeze apparatus (isopentane/liquid N₂), cryostat microtome, phosphor-imaging plates or X-ray film, calibrated radioactivity standards.
II. Procedure
- Administer a precise intravenous bolus of [¹⁴C]2DG (e.g., 100 µCi/kg).
- Timed Arterial Sampling: Collect ~15-20 blood samples over 45 minutes post-injection. Process to determine plasma [¹⁴C]2DG and glucose concentrations over time.
- At t=45 min, euthanize the animal via rapid decapitation or focused microwave irradiation to instantly halt metabolism.
- Extract the brain, rapidly freeze in isopentane chilled to -40°C, and store at -80°C.
- Section brain coronally (20 µm thickness) in a cryostat at -20°C. Mount sections on glass slides.
- Expose sections, along with calibrated [¹⁴C] standards, to a phosphor-imaging plate for 5-7 days.
III. Data Analysis & Calculation
- Digitize autoradiographs. Convert optical density/pixel values to local tissue [¹⁴C] concentration (nCi/g) using the calibration curve from standards.
- Calculate Local Cerebral Glucose Utilization (LCGU) using the operational equation derived by Sokoloff et al.:
LCGU = (C*ₜ - k₁·e^{-(k₂+k₃)t}∫₀ᵗ Cₚ·e^{(k₂+k₃)s} ds) / (LC·[∫₀ᵗ (Cₚ/Cg) ds])Where: C*ₜ = tissue ¹⁴C concentration; Cₚ = plasma [¹⁴C]2DG; Cg = plasma glucose; k₁, k₂, k₃ = rate constants; LC = lumped constant. - Rate constants (k₁-k₄) and the LC are derived from separate kinetic experiments for the specific species and brain region.
Protocol 2: In Vitro 2DG Uptake & Trapping Assay in Cultured Neurons
This protocol measures 2DG uptake kinetics and trapping efficiency in primary neurons or cell lines, useful for screening metabolic modulators.
I. Materials & Pre-experiment
- Cells: Primary cortical/hippocampal neurons (DIV 10-14) or relevant neural cell lines.
- Assay Buffer: Krebs-Ringer HEPES Buffer (KRHB): 130 mM NaCl, 5 mM KCl, 1.3 mM CaCl₂, 1.3 mM MgSO₄, 10 mM HEPES (pH 7.4).
- Tracer: [³H]2DG (or non-radioactive 2DG with a downstream detection kit).
- Inhibitors: Optional: Cytochalasin B (GLUT inhibitor), specific kinase inhibitors.
- Equipment: Cell culture plates, multi-well aspirator, cell lysis buffer, scintillation counter/plate reader.
II. Procedure
- Deprivation & Wash: Wash cells 2x with warm, glucose-free KRHB. Incubate in glucose-free KRHB for 30-60 min to deplete intracellular glucose.
- Uptake Phase: Replace medium with KRHB containing 0.1-1.0 mM 2DG (spiked with [³H]2DG, ~1 µCi/mL) and a known glucose concentration (often 0-10 mM for competition studies). Incubate for a precise time (e.g., 10 min) at 37°C.
- Stop & Wash: Rapidly aspirate tracer solution and immediately wash cells 3x with ice-cold PBS (containing phloretin or cytochalasin B to block further GLUT activity).
- Lysis: Lyse cells in 0.1N NaOH or suitable lysis buffer. Transfer lysate to a scintillation vial or plate.
- Quantification: Add scintillation cocktail and count [³H] activity. Normalize to total protein content (BCA assay).
III. Data Analysis
- Calculate uptake (pmol/min/mg protein). Use Cytochalasin B-treated wells to define non-specific transport.
- Kinetic analysis (e.g., Michaelis-Menten) can be performed by varying 2DG concentration.
- Trapping Index: Compare total accumulated [³H] after a standard uptake/wash to that after an additional 30-60 min chase period in tracer-free, high-glucose medium. Retained fraction represents trapped 2DG-6-P.
Visualizations: Pathways & Workflows
Title: The 2DG Uptake and Trapping Mechanism
Title: [¹⁴C]2DG Autoradiography Workflow
The Scientist's Toolkit: Research Reagent Solutions
Table 3: Essential Materials for 2DG-Based Metabolic Research
| Item / Reagent | Function & Rationale |
|---|---|
| [¹⁴C]2-Deoxy-D-Glucose | Gold-standard radiotracer for quantitative autoradiography. High specific activity is critical for precise kinetic measurements. |
| [¹⁸F]Fluorodeoxyglucose (FDG) | Positron-emitting analog for PET imaging in humans and large animals. Enables translational and clinical metabolic studies. |
| [³H]2-Deoxy-D-Glucose | Lower-energy beta emitter used for in vitro cellular uptake assays due to safety and handling advantages in cell culture labs. |
| Cytochalasin B | Potent, non-specific inhibitor of facilitative glucose transporters (GLUTs). Used to define non-specific background in uptake assays. |
| Hexokinase Activity Assay Kit | Measures hexokinase enzymatic activity. Crucial for confirming the phosphorylation step of 2DG trapping in cell/tissue lysates. |
| 2-Deoxyglucose (Unlabeled) | Used as a metabolic inhibitor in control experiments and for establishing standard curves in non-radioactive assay kits. |
| Phloretin | Alternative GLUT inhibitor. Useful for washing steps to instantly halt transport during in vitro assays. |
| Phosphor-Imaging Plates & Scanner | Digital replacement for X-ray film in autoradiography. Offers a wider linear dynamic range for quantifying ¹⁴C concentration. |
| Calibrated [¹⁴C] Radioactive Standards | Microscale strips with known ¹⁴C concentrations. Essential for converting optical density to nCi/g tissue in autoradiography. |
| Sokoloff Rate Constant Set (k₁, k₂, k₃, LC) | Species- and region-specific kinetic constants. Must be obtained from foundational literature for accurate LCGU calculation. |
Overcoming Experimental Challenges: Optimizing 2-DG Use in Research
Within the investigation of 2-Deoxyglucose (2DG) as a metabolic inhibitor and potential therapeutic agent, its cellular mechanism hinges on facilitated transport via glucose transporters (GLUTs) and subsequent intracellular phosphorylation by hexokinase to 2DG-6-phosphate, which is not metabolized further, leading to "trapping" and glycolytic inhibition. The reproducibility and interpretation of such research are critically dependent on three core experimental parameters: the concentration of 2DG, the incubation time with cells, and the composition of the nutrient media. This guide details the optimization of these parameters for reliable data generation in uptake and trapping studies.
The following tables consolidate key quantitative findings from recent literature on optimizing 2DG experiments.
Table 1: Effect of 2DG Concentration on Cellular Parameters
| 2DG Concentration (mM) | Hexokinase Inhibition (IC₅₀ approx.) | Glucose Uptake Reduction (%) | ATP Depletion Onset | Cytotoxicity (Cell Line Dependent) |
|---|---|---|---|---|
| 0.1 - 1 | Partial | 20-40% | >24h | Low |
| 2 - 5 | Significant | 60-80% | 6-12h | Moderate |
| 10 - 50 | Near-complete | >90% | 1-4h | High (Apoptosis/Necrosis) |
Table 2: Incubation Time Course for 2DG (5 mM) Effects
| Incubation Time | 2DG-6-P Accumulation | Glycolytic Flux (% of Control) | Compensatory Pathway Activation (e.g., OXPHOS) | Primary Readout Suitability |
|---|---|---|---|---|
| 15 - 30 min | Linear increase | ~50% | Minimal | Initial uptake/transport kinetics |
| 1 - 4 h | Plateau phase | <20% | Detectable | Metabolic trapping, short-term signaling |
| 8 - 24 h | Steady state | <10% | Significant | Cell viability, autophagy, ER stress |
Table 3: Impact of Media Composition on 2DG Efficacy
| Media Component | Standard High Glucose (25 mM) | Low Glucose (5 mM) | Glucose-Free (with Pyruvate/Glutamine) | No Carbon Sources (PBS-based) |
|---|---|---|---|---|
| 2DG Uptake Competition | High (competes with D-Glucose) | Moderate | Low | None |
| 2DG-6-P Trapping Efficiency | Reduced | High | Very High | Maximal, but non-physiological |
| Cell Stress Induction | Delayed | Accelerated | Context-dependent | Rapid (starvation) |
| Recommended Use | Baseline cytotoxicity assays | Mechanistic uptake/trapping studies | Studying metabolic flexibility | In vitro transport assays only |
Detailed Experimental Protocols
Protocol 1: Quantifying 2DG Uptake and Trapping Using Radiolabeled [³H]-2DG
Objective: To measure the time- and concentration-dependent cellular accumulation of 2DG and its phosphorylated product. Key Reagents: [³H]-2DG, unlabeled 2DG, glucose-free assay buffer, cell lysis buffer, scintillation cocktail, anion-exchange columns (or alternative separation method). Procedure:
- Cell Preparation: Seed cells in 24-well plates. Prior to assay, rinse twice with warm, glucose-free assay buffer (e.g., Krebs-Ringer-HEPES).
- Incubation: Add assay buffer containing a defined concentration of [³H]-2DG (e.g., 0.1-10 µCi/mL) mixed with unlabeled 2DG to achieve the desired final concentration (e.g., 0.1 mM to 10 mM). Incubate at 37°C for a precise time (e.g., 10, 30, 60 min).
- Termination & Lysate Collection: Aspirate radioactive media. Rapidly rinse wells 3x with ice-cold PBS. Lyse cells with 0.1% SDS or 0.1M NaOH. Transfer lysate to a scintillation vial for total radioactivity measurement (represents total uptake).
- Separation of 2DG-6-P: Apply an aliquot of the lysate to a pre-conditioned anion-exchange column (e.g., Dowex-1 chloride form). Neutral 2DG is eluted with water, while negatively charged 2DG-6-P is retained and later eluted with 0.1M HCl or NaCl solution. Measure radioactivity in both fractions via scintillation counting.
- Calculation: Trapped 2DG = radioactivity in 2DG-6-P fraction. Free intracellular 2DG = radioactivity in neutral fraction. Total uptake = sum of both.
Protocol 2: Assessing Metabolic Impact via Extracellular Acidification Rate (ECAR)
Objective: To determine the real-time inhibition of glycolysis by 2DG under different media conditions. Key Reagents: Seahorse XF base medium, 2DG stock, glucose, oligomycin, cell culture miniplates. Procedure:
- Cell Culture: Seed cells in a Seahorse XF cell culture microplate. Culture overnight.
- Media Equilibration: One hour before assay, replace growth media with unbuffered Seahorse XF base medium supplemented with specific nutrients (e.g., 2 mM glutamine, and either 10 mM glucose or 0 mM glucose as required). Incubate at 37°C in a non-CO₂ incubator.
- Sensor Cartridge Loading: Load 2DG (e.g., 100mM stock) and other modulators (e.g., oligomycin) into designated ports of the sensor cartridge.
- Assay Run: Calibrate the Seahorse XF Analyzer. Run a standard Glycolytic Rate Assay or a custom program. Typically, after baseline ECAR measurements, inject 2DG (final concentration 50-100 mM is often used for complete inhibition) and monitor the rapid drop in ECAR, confirming glycolytic blockade. The magnitude of drop is context-dependent on basal media glucose.
Diagrams
Diagram Title: 2DG Uptake, Trapping & Metabolic Impact
Diagram Title: Experimental Workflow for 2DG Uptake Studies
The Scientist's Toolkit: Key Research Reagent Solutions
| Reagent / Material | Function in 2DG Research | Key Considerations |
|---|---|---|
| 2-Deoxy-D-glucose (2DG) | The core investigational molecule. Competes with glucose for uptake and metabolism. | Source high-purity, sterile-filtered stock solutions. Verify solubility and stability in aqueous buffer. |
| [³H]- or [¹⁴C]-2DG | Radiolabeled tracer for precise, sensitive quantification of uptake and phosphorylation kinetics. | Handle per radiation safety protocols. Specific activity determines required concentration in assay. |
| Glucose-Free Assay Buffer (e.g., KRB or HEPES-based) | Provides a controlled ionic environment without competing glucose during the uptake assay. | Must be warmed to 37°C and pH-adjusted. May include salts to maintain osmolarity. |
| Anion-Exchange Resin (e.g., Dowex-1, Chloride form) | Separates negatively charged 2DG-6-phosphate from neutral 2DG in cell lysates for trapping assays. | Requires pre-conditioning. Batch-to-batch consistency is critical for reproducible separation. |
| Seahorse XF Glycolytic Rate Assay Kit | Measures extracellular acidification rate (ECAR) to directly assess real-time glycolytic inhibition by 2DG. | Requires specialized instrument (Seahorse Analyzer). Media composition is integral to the assay design. |
| Hexokinase Activity Assay Kit | Measures the enzymatic activity of hexokinase, the target of 2DG phosphorylation and potential feedback inhibition. | Useful for determining if observed effects are due to direct enzyme inhibition vs. substrate competition. |
| AMPK & Stress Pathway Antibodies (p-AMPK, CHOP, LC3) | Immunoblotting reagents to confirm downstream metabolic stress responses induced by 2DG treatment. | Validates the biological consequence of glycolytic inhibition and ATP depletion. |
| Defined Nutrient Media (High/Low/No Glucose, with Glutamine) | Systematically varies the competitive and metabolic context for 2DG action. | Use serum-free or dialyzed FBS to control for unknown serum components. Pyruvate can be an alternative energy source. |
2-Deoxy-D-glucose (2-DG) is a glucose analog widely used to study cellular glucose metabolism and induce metabolic stress. Its primary mechanism involves competitive uptake via glucose transporters (GLUTs) and subsequent phosphorylation by hexokinase to 2-DG-6-phosphate, which is not efficiently metabolized further, leading to its accumulation and inhibition of glycolysis. However, experimental outcomes from 2-DG treatment are frequently conflated with those of general glucose deprivation. This guide delineates the distinct and overlapping molecular consequences of 2-DG versus glucose starvation, providing a framework for accurate experimental design and data interpretation in mechanistic research.
Core Mechanisms: Uptake, Trapping, and Inhibition
Cellular Uptake: 2-DG enters cells predominantly through facilitative GLUTs (e.g., GLUT1, GLUT4), with kinetics similar to D-glucose (Km values typically 1-10 mM). Intracellularly, hexokinase phosphorylates 2-DG to 2-DG-6-phosphate (2-DG-6P). This phosphorylation is irreversible under physiological conditions due to the extremely low affinity of glucose-6-phosphatase for 2-DG-6P, leading to "metabolic trapping."
Key Inhibitory Actions:
- Glycolysis Inhibition: 2-DG-6P competitively inhibits hexokinase (Ki ~50-100 µM), reducing the phosphorylation of native glucose.
- N-Linked Glycosylation Disruption: 2-DG can be incorporated into oligosaccharide chains, impairing proper protein folding and function.
- ATP Depletion: Resultant from inhibited glycolysis, especially in glycolytically-dependent cells.
Contrast with Glucose Starvation: Simple removal of glucose from media leads to depletion of the substrate, not accumulation of an inhibitory metabolite. Key differences arise in the kinetics of ATP depletion, activation patterns of nutrient-sensing pathways, and the absence of glycosylation defects.
Quantitative Comparison of Cellular Responses
The table below summarizes differential effects based on current literature.
Table 1: Comparative Effects of 2-DG Treatment vs. Glucose Starvation
| Parameter | 2-DG Treatment | Glucose Starvation |
|---|---|---|
| Glycolytic Rate | Rapid inhibition (minutes), due to direct hexokinase inhibition and product feedback. | Gradual decline (hours), dependent on depletion of intracellular and medium glucose pools. |
| Intracellular Metabolite | Accumulation of 2-DG-6-phosphate (can reach millimolar levels). | Depletion of glucose-6-phosphate, fructose-6-phosphate, and downstream glycolytic intermediates. |
| ATP/ADP Ratio | Often a sharp, early decrease due to futile cycling and inhibition of ATP production. | A more gradual decrease correlating with substrate exhaustion. |
| AMPK Activation | Strong and rapid activation due to ADP/AMP increase from hexokinase-mediated ATP consumption. | Activation occurs, but kinetics may differ; primarily via LKB1 in response to ATP depletion. |
| mTORC1 Inhibition | Rapid, via AMPK-dependent and independent mechanisms. | Slower, primarily via AMPK and regulation of Rag GTPases. |
| ER Stress & UPR | Pronounced induction due to disruption of N-linked glycosylation and protein misfolding. | Mild induction, primarily from ATP depletion affecting protein folding capacity. |
| Autophagy Induction | Strong induction via AMPK/mTORC1 and ER stress pathways. | Induction primarily via AMPK/mTORC1 and sirtuin pathways. |
| Redox State (NADPH/NADP+) | May decrease due to inhibition of the pentose phosphate pathway (PPP) at the glucose-6-phosphate step. | Decreases due to lack of PPP substrate (G6P). |
| Lactate Production | Abruptly halts. | Gradually declines. |
Essential Experimental Protocols for Distinction
Protocol 1: Validating 2-DG Uptake and Trapping
Objective: Confirm intracellular accumulation of 2-DG-6-phosphate. Method:
- Treat cells with 10 mM 2-DG containing trace amounts of [³H]-2-DG for 15-60 min.
- Rapidly wash cells with ice-cold PBS.
- Lyse cells in 80% ethanol. Centrifuge to remove protein.
- Analyze the supernatant by thin-layer chromatography (TLC) or ion-exchange chromatography to separate 2-DG from 2-DG-6P.
- Quantify radioactivity in each fraction. A high ratio of phosphorylated to non-phosphorylated compound confirms efficient trapping.
Protocol 2: Dissecting Glycosylation Inhibition
Objective: Differentiate 2-DG-specific ER stress from general nutrient stress. Method:
- Treatments: Set up three conditions: a) Control (high glucose), b) Glucose-free media, c) 2-DG (in high glucose media).
- Duration: 4-8 hours.
- Analysis: Perform western blotting for ER stress markers.
- 2-DG Specific: Look for strong induction of markers like ATF4 and CHOP, and phosphorylation of PERK and eIF2α.
- Common Marker: BiP/GRP78 may be induced in both conditions.
- Confirmatory Assay: Use a mobility shift assay (western blot) for a glycoprotein like LAMP1 or EGFR. 2-DG treatment causes faster migration due to under-glycosylation, while glucose starvation does not.
Protocol 3: Metabolic Profiling Kinetics
Objective: Compare the temporal dynamics of metabolic perturbation. Method:
- Use a Seahorse XF Analyzer or similar platform.
- Measurement: Treat cells in real-time and monitor the Extracellular Acidification Rate (ECAR, proxy for glycolysis) and Oxygen Consumption Rate (OCR).
- Expected Results:
- 2-DG: Immediate, sharp drop in ECAR within minutes. OCR may show a transient change.
- Glucose Starvation: Gradual, linear decline in ECAR over 1-2 hours. OCR may adapt or decrease gradually.
Signaling Pathway Diagrams
Table 2: Essential Research Reagent Solutions
| Reagent / Material | Function & Application | Key Consideration |
|---|---|---|
| 2-Deoxy-D-Glucose (2-DG) | Primary experimental compound. Competes with glucose for uptake and metabolism. | Use in presence of normal glucose media to isolate inhibitory effect from substrate deprivation. |
| [³H]- or [¹⁴C]-2-DG | Radiolabeled tracer for quantifying cellular uptake and phosphorylation/trapping efficiency (see Protocol 1). | Requires specific facilities for handling and disposal of radioactive materials. |
| Galactose Media | Substrate for oxidative metabolism. Forces cells to rely on mitochondria, providing a "glucose-free" control without total energy stress. | Helps isolate glycolytic inhibition effects from general starvation. |
| AMPK Inhibitor (e.g., Compound C) | Pharmacological tool to inhibit AMPK. Used to determine if observed effects are AMPK-dependent. | Can have off-target effects; use siRNA/shRNA knockdown for validation. |
| Thapsigargin/Tunicamycin | Positive control inducers of ER stress. Allows comparison of 2-DG-induced UPR to canonical pathways. | |
| Seahorse XF Glycolysis Stress Test Kit | Standardized assay to measure glycolytic function (ECAR) in real-time before and after 2-DG addition. | Critical for kinetic analysis (Protocol 3). |
| Anti-phospho-AMPK (Thr172) Antibody | Key reagent for detecting AMPK activation via western blot. | Must be paired with total AMPK antibody for normalization. |
| Endoglycosidase H (Endo H) | Enzyme that cleaves high-mannose N-glycans. Sensitivity to Endo H indicates under-glycosylation, a hallmark of 2-DG effect. | Used in gel mobility shift assays (Protocol 2). |
Within the critical research on the 2-deoxyglucose (2DG) mechanism of cellular uptake and trapping, the reliability of experimental data hinges on the integrity of the tracer itself. 2DG, a glucose analog, is a foundational tool for probing cellular glucose metabolism via uptake assays. Its utility depends on its specific biochemical behavior—competitive uptake via glucose transporters (GLUTs) and phosphorylation by hexokinase, followed by metabolic trapping due to the inability of 2-deoxyglucose-6-phosphate to proceed through glycolysis. Any impurity or instability in the radiolabeled (e.g., [³H]-2DG, [¹⁴C]-2DG) or fluorescently tagged 2DG tracer directly compromises assay results, leading to inaccurate quantification of uptake rates and erroneous biological conclusions. This guide details the technical challenges and solutions for ensuring tracer purity and stability to uphold data fidelity in 2DG-based research.
The Impact of Tracer Degradation on 2DG Uptake Assays
Degradation of 2DG tracers manifests in several ways, each introducing specific artifacts:
- Radiolysis: For radioactive 2DG, radiolysis from emitted particles damages the molecule, creating chemical impurities that can be taken up by cells through non-specific mechanisms.
- Chemical/Enzymatic Degradation: Hydrolysis or oxidation can alter the 2DG molecule. The presence of even small amounts of glucose as an impurity is particularly pernicious, as it competes directly for uptake and phosphorylation, underestimating true 2DG uptake.
- Impact on Kinetics: Impurities alter the apparent Michaelis-Menten constants (Km and Vmax) for transport and phosphorylation, skewing the mechanistic interpretation of cellular metabolic capacity.
Table 1: Common Impurities in 2DG Tracer Stocks and Their Effects
| Impurity Type | Potential Source | Impact on Uptake Assay |
|---|---|---|
| D-Glucose | Synthesis residue, hydrolysis | Competitive inhibition, leading to underestimated uptake rates. |
| 2-Deoxyglucose-6-Phosphate | Pre-formed in stock or from degradation | Falsely elevates "trapped" product measurement in some assay formats. |
| Radiolytic Fragments ([³H]/[¹⁴C]) | Radiation-induced decomposition | Non-specific cellular binding or uptake, increasing background noise. |
| Oxidation Products | Exposure to air/oxidants | Unknown pharmacological activity, potential cytotoxicity. |
Protocols for Assessing Tracer Purity and Stability
Analytical Chromatography for Purity Verification
Method: High-Performance Liquid Chromatography (HPLC) coupled with radiometric or UV/RI detection.
- Column: Aminopropyl-silica (NH2) or strong anion exchange (SAX) column for sugar separation.
- Mobile Phase: Acetonitrile:Water (75:25, v/v) isocratic or with a gradient for NH2 columns; Buffered phosphate or borate for SAX.
- Procedure: Dilute tracer stock in mobile phase. Inject and run against pure standards of 2DG, glucose, and 2DG-6-P. Integrate peak areas. Purity >95% is typically required for quantitative assays. For radiotracers, HPLC effluent is fractionated and analyzed with a liquid scintillation counter.
Stability Monitoring Under Storage Conditions
Method: Accelerated Stability Testing.
- Procedure: Aliquot tracer stocks into anticipated storage conditions (e.g., -80°C in aqueous solution, -20°C in ethanol/water). At defined time points (e.g., 0, 1, 3, 6 months), remove aliquots and analyze via HPLC as above. Track the emergence of new peaks and the decrease of the parent 2DG peak.
- Key Metric: Determine the time point at which purity falls below the 95% threshold. For radioactive tracers, specific activity (Ci/mmol) should also be monitored over time.
Table 2: Recommended Storage Conditions for 2DG Tracers
| Tracer Form | Recommended Storage | Stability Expectation | Key Risk |
|---|---|---|---|
| Lyophilized [¹⁴C]-2DG | -20°C or below, desiccated | >3 years | Minimal; reconstitution is critical step. |
| Aqueous [³H]-2DG Solution | -80°C in small, single-use aliquots | 6-12 months | Radiolysis and hydrolysis. |
| Fluorescent 2DG Conjugate (e.g., 2-NBDG) | -20°C in dark, desiccated | Manufacturer dependent (~1 year) | Photobleaching and hydrolysis. |
Experimental Protocol: A Rigorous 2DG Uptake Assay with Purity Controls
This protocol integrates verification steps to account for tracer integrity.
Title: In vitro 2DG Uptake Assay in Adherent Cell Lines
- Tracer Preparation: Thaw a single aliquot of radiolabeled 2DG. Spot-check purity via TLC or analytical HPLC on the day of the experiment. Dilute in assay buffer (e.g., Krebs-Ringer HEPES) to working concentration. A parallel sample spiked with excess cold 2DG or glucose serves as a control for non-specific uptake.
- Cell Preparation: Plate cells in 24-well plates to reach 80-90% confluence. Prior to assay, wash cells twice with warm, serum-free, glucose-free assay buffer.
- Uptake Phase: Add assay buffer containing the purified 2DG tracer to wells. Incubate for a precise, short time (e.g., 5-10 min) at 37°C to measure initial uptake rate.
- Termination & Trapping: Rapidly remove tracer solution and wash wells 3x with ice-cold PBS. Cells now contain free intracellular 2DG and 2DG-6-P.
- Analysis: Lyse cells with 0.1M NaOH or SDS lysis buffer. Use one aliquot for protein quantification (Bradford assay) and another for scintillation counting (radiolabeled tracer) or fluorescence reading (for 2-NBDG).
- Data Normalization: Uptake is expressed as pmol or nmol of 2DG per mg of cellular protein per minute, corrected for non-specific binding (determined from inhibitor control wells).
The Scientist's Toolkit: Research Reagent Solutions
| Item | Function & Relevance to Tracer Integrity |
|---|---|
| HPLC System with RI/UV Detector | Gold-standard for verifying chemical purity of 2DG stocks, separating it from glucose and phosphorylated derivatives. |
| Radio-HPLC Detector or Fraction Collector | Essential for assessing radiochemical purity of [³H]- or [¹⁴C]-2DG, identifying radiolytic breakdown products. |
| Liquid Scintillation Counter & Cocktail | For quantifying radioactivity in samples from uptake assays and HPLC fractions. |
| Anion Exchange (SAX) Cartridges | Used for quick solid-phase extraction to separate neutral 2DG from anionic 2DG-6-P in cell lysates. |
| Stable, Low-Activity [¹⁴C]-2DG | [¹⁴C] labels are more stable than [³H] due to lower energy emission, reducing radiolysis risk for long-term studies. |
| High-Purity, Cold 2DG Standard | Used for creating standard curves in HPLC, as a competitive inhibitor in control experiments, and for diluting high-activity stocks. |
| Oxygen-Free, Amber Vials | Minimizes oxidative and photolytic degradation during tracer storage. |
| Cryogenic Vials for Aliquoting | Prevents repeated freeze-thaw cycles of tracer stocks, a major source of instability. |
Pathways and Workflow Visualization
Diagram Title: Tracer Integrity Workflow in 2DG Uptake Assays
Diagram Title: 2DG Cellular Uptake and Trapping Mechanism
In the precise mechanistic study of 2-deoxyglucose uptake, the tracer is not merely a reagent but the central probe whose behavior defines the experiment. Systematic validation of its chemical and radiochemical purity, coupled with stringent storage and handling protocols, is a non-negotiable prerequisite. By integrating the purity assessments and controls outlined in this guide, researchers can ensure that their observed data reflect true biological variation in glucose transport and metabolism, rather than artifacts of a decaying tool, thereby solidifying the foundation of their research in cancer metabolism, neurology, and drug development.
The utility of 2-Deoxyglucose (2-DG) as a metabolic probe and potential therapeutic agent hinges upon its cellular uptake and subsequent phosphorylation. This process is governed by two principal, cell-type-specific determinants: the expression profile of facilitative glucose transporter (GLUT/SLC2A) isoforms and the activity of hexokinase (HK). This whitepaper provides an in-depth technical guide on these variables, framed within the context of 2-DG mechanism research, to inform targeted experimental design and therapeutic development.
Core Principles: 2-DG Uptake and Trapping
2-DG enters cells via facilitative GLUTs. Intracellularly, it is phosphorylated by hexokinase to 2-deoxyglucose-6-phosphate (2-DG-6-P). This phosphorylated analog is not a substrate for glucose-6-phosphate isomerase, nor is it efficiently dephosphorylated, leading to its accumulation ("metabolic trapping"). The rate of this trapping is thus a function of both GLUT-mediated influx and HK activity, both of which exhibit significant tissue and cell-type specificity.
GLUT Isoform Expression and Kinetics
The human GLUT family comprises 14 isoforms (GLUT1-14). Their expression patterns and kinetic parameters critically influence 2-DG uptake capacity.
Table 1: Key GLUT Isoforms Relevant to 2-DG Research
| Isoform | Primary Tissues/Cell Types | Km for Glucose (mM) | Notes for 2-DG Research |
|---|---|---|---|
| GLUT1 | Ubiquitous; high in erythrocytes, blood-brain barrier endothelium, proliferating cells. | 1-2 | High-affinity, constitutive transporter. Major route in many cancers and stem cells. |
| GLUT2 | Liver, pancreatic β-cells, renal tubular cells, intestinal epithelium. | 15-20 | Low-affinity, high-capacity transporter. Also transports fructose. |
| GLUT3 | Neurons, placenta, testes. | ~1 | Very high affinity. Principal neuronal glucose transporter. |
| GLUT4 | Adipose tissue, skeletal & cardiac muscle (insulin-responsive). | ~5 | Insulin-stimulated translocation to plasma membrane. Key in metabolic studies. |
| GLUT5 | Small intestine, sperm, some cancers. | (Fructose transporter) | Does not transport glucose/2-DG significantly. |
Data synthesized from current literature via live search.
Experimental Protocol: Assessing GLUT Isoform Expression
Method: Quantitative Reverse Transcription PCR (qRT-PCR) & Western Blotting.
- Cell Lysis & RNA/Protein Extraction: Homogenize tissue or cultured cells in TRIzol (for concurrent RNA/protein) or separate buffers.
- qRT-PCR:
- Reverse Transcription: Synthesize cDNA from 1 µg total RNA using a high-capacity cDNA reverse transcription kit.
- Primer Design: Use isoform-specific primers (e.g., for GLUT1: F-5'-CTTCCTGCTCATCAACCGCT-3', R-5'-CCAGCCACAGTGGAAGAAGC-3').
- Quantification: Perform SYBR Green-based qPCR. Normalize cycle threshold (Ct) values to a housekeeping gene (e.g., β-actin, GAPDH). Calculate relative expression via the 2^(-ΔΔCt) method.
- Western Blotting:
- Separation: Resolve 20-40 µg of total protein on a 10% SDS-PAGE gel.
- Transfer: Electroblot to PVDF membrane.
- Blocking & Incubation: Block with 5% non-fat milk; incubate with primary antibodies specific to each GLUT isoform (e.g., Rabbit anti-GLUT1, ab115730) overnight at 4°C.
- Detection: Incubate with HRP-conjugated secondary antibody; develop with ECL substrate and image.
Hexokinase Activity and Isoforms
Hexokinase catalyzes the ATP-dependent phosphorylation of 2-DG. Mammals express four major isoforms (HK1-HK4) with distinct properties.
Table 2: Hexokinase Isoforms and Properties
| Isoform | Primary Tissues | Subcellular Localization | Km for Glucose | Regulation / Notes |
|---|---|---|---|---|
| HK1 | Ubiquitous; high in brain, erythrocytes. | Mitochondrially bound. | ~0.03 mM | Very high affinity. Product-inhibited by G-6-P. |
| HK2 | Insulin-sensitive tissues (muscle, fat), many cancers. | Mitochondrial & cytosolic. | ~0.03 mM | High affinity. Overexpressed in tumors, key for Warburg effect. |
| HK3 | Widely distributed at lower levels. | Cytosolic. | ~30 mM | Low affinity. |
| HK4 (Glucokinase) | Liver parenchyma, pancreatic β-cells. | Cytosolic, nucleus (regulated). | ~8 mM | Low affinity, cooperative kinetics. Not inhibited by G-6-P. |
Data synthesized from current literature via live search.
Experimental Protocol: Measuring Hexokinase Activity
Method: Spectrophotometric Kinetic Assay.
- Prepare Reaction Mix: 50 mM Tris-HCl (pH 8.0), 5 mM MgCl₂, 1 mM ATP, 0.5 mM NADP⁺, 1 U/mL Glucose-6-phosphate dehydrogenase (G6PDH), and cell/tissue lysate (10-50 µg protein).
- Initiate Reaction: Add D-Glucose or 2-DG to a final concentration of 0.5-5.0 mM (substrate concentration should be chosen based on the specific HK isoform being studied).
- Monitor Continuously: The HK reaction produces G-6-P or 2-DG-6-P. G6PDH converts G-6-P and NADP⁺ to 6-phosphogluconolactone and NADPH. Follow the increase in absorbance at 340 nm (A₃₄₀) due to NADPH formation for 5-10 minutes.
- Calculate Activity: Hexokinase activity (U/mg protein) = (ΔA₃₄₀/min * Vtotal) / (ε * d * Vsample * [Protein]), where ε(NADPH)=6.22 mM⁻¹cm⁻¹, d=pathlength (cm), V=volume.
- For direct 2-DG phosphorylation, a coupled assay using purified yeast G6PDH (which can utilize 2-DG-6-P, albeit inefficiently) or a radioassay with [³H]-2-DG is required.
Integration in 2-DG Research: The Cellular Determinants
The cell-type-specific action of 2-DG depends on the interplay between transporter expression and hexokinase activity. The following diagram illustrates the core mechanism and its determinants.
Diagram Title: Mechanism of 2-DG Cellular Uptake and Metabolic Trapping
The Scientist's Toolkit: Essential Research Reagent Solutions
Table 3: Key Reagents for Investigating 2-DG Uptake and Trapping
| Reagent / Material | Function / Application | Example & Notes |
|---|---|---|
| 2-Deoxy-D-Glucose (2-DG) | Core metabolic probe. Competes with glucose for uptake and phosphorylation. | Radiolabeled [³H]-2-DG or [¹⁴C]-2-DG for quantitative flux studies. Unlabeled for inhibition assays. |
| GLUT Isoform-Specific Inhibitors | Pharmacologically dissect contribution of specific GLUTs. | BAY-876: Potent, selective GLUT1 inhibitor. Cytochalasin B: Broad GLUT inhibitor. KL-11743: Selective GLUT4 inhibitor. |
| Hexokinase Inhibitors | Probe the phosphorylation step in trapping. | 2-Deoxyglucose (itself): Competitive substrate. Lonidamine: Targets mitochondrial HK. 3-Bromopyruvate (3-BP): Alkylating agent inhibiting HK2. |
| GLUT & HK Isoform Antibodies | Detect protein expression levels via Western Blot, IHC, IF. | Validated primary antibodies: Essential for specificity. e.g., Anti-GLUT1 (Abcam ab115730), Anti-HK2 (CST #2867). |
| Glucose/Uptake Assay Kits | Measure real-time or endpoint glucose/2-DG uptake. | Fluorescent (2-NBDG) or colorimetric/fluorimetric kits coupled to enzyme reactions. |
| Cellular Fractionation Kits | Study subcellular localization (e.g., HK1/2 bound to mitochondria). | Mitochondrial isolation kits to separate cytosolic and mitochondrially-bound HK pools. |
| Stable Cell Lines (Knockout/Overexpression) | Isolate the role of a single isoform. | CRISPR-Cas9 generated GLUT/HK KO lines or lentiviral overexpression lines. |
Experimental Workflow for Cell-Type Specificity Analysis
A comprehensive analysis of cell-type-specific 2-DG trapping involves a multi-modal approach.
Diagram Title: Integrated Workflow to Analyze 2-DG Uptake Determinants
The efficacy of 2-DG as a research tool and its potential therapeutic window are intrinsically linked to the cell-type-specific expression of GLUT isoforms and hexokinase activity. A precise understanding of these variables, enabled by the methodologies and reagents outlined, is critical for designing experiments that accurately interpret 2-DG uptake data and for developing targeted strategies in diseases like cancer, where metabolic dependencies are often exploited.
This whitepaper provides a technical examination of the in vivo behavior of 2-Deoxyglucose (2DG), framed within the broader context of its established mechanism of cellular uptake and metabolic trapping via hexokinase phosphorylation to 2DG-6-phosphate. While its in vitro actions are well-characterized, successful translation to therapeutic applications—particularly in oncology and virology—requires a rigorous understanding of its pharmacokinetic (PK) profile, absolute bioavailability, and systemic toxicity risks.
Pharmacokinetics of 2-Deoxyglucose
The PK profile of 2DG is fundamentally shaped by its structural similarity to glucose, leading to competition for shared transport and metabolic pathways.
Absorption & Distribution
2DG is primarily administered intravenously in clinical research to ensure complete and reproducible systemic delivery. Oral administration results in variable absorption due to competition with dietary glucose and potential saturation of intestinal sodium-glucose co-transporters (SGLT1). Once in systemic circulation, 2DG rapidly distributes to tissues via glucose transporters (GLUTs), with highest uptake in metabolically active organs: brain, heart, and tumors.
Metabolism & Elimination
The core of 2DG's action is its intracellular metabolism. It is phosphorylated by hexokinase to 2DG-6-phosphate (2DG-6-P), which is not a substrate for glucose-6-phosphate isomerase, leading to accumulation ("trapping"). A small fraction is metabolized via glycolysis to 2-deoxy-6-phosphogluconate, but the primary route of elimination is renal excretion of the unchanged parent compound. Its plasma half-life is relatively short.
Table 1: Key Pharmacokinetic Parameters of 2DG from Preclinical and Clinical Studies
| Parameter | Preclinical (Rodent) Data | Clinical Data (Estimated) | Notes |
|---|---|---|---|
| Bioavailability (Oral) | 20-40% | 10-30% | High variability; food-dependent. |
| Plasma Half-life (t½) | ~30-45 min | ~45-90 min | Biphasic elimination. |
| Volume of Distribution (Vd) | 0.3-0.5 L/kg | ~0.4-0.6 L/kg | Similar to total body water. |
| Primary Clearance Route | Renal (>80%) | Renal (>80%) | Active tubular secretion suspected. |
| Cmax after IV dose (45 mg/kg) | ~1.2 mM | N/A | Dose-proportional in tested range. |
Bioavailability
The oral bioavailability of 2DG is low and erratic. Concurrent glucose intake can drastically reduce absorption and accelerate clearance by competitive inhibition. This necessitates controlled fasting states during administration and makes IV infusion the preferred route for dose-critical applications like adjuvant cancer therapy.
Experimental Protocol for Assessing Oral Bioavailability:
- Animal Model: Cannulated rats or mice (n=6-8/group) after an overnight fast.
- Dosing: Administer 2DG (e.g., 100 mg/kg) via oral gavage and intravenous tail-vein injection in separate cohorts.
- Sampling: Serial blood samples collected via cannula at pre-dose, 5, 15, 30, 60, 120, 180, and 240 minutes post-dose.
- Analysis: Plasma concentration of 2DG quantified via LC-MS/MS.
- Calculation: Bioavailability (F) = (AUCoral * DoseIV) / (AUCIV * Doseoral) * 100%.
Potential Systemic Toxicity
The primary toxicity of 2DG arises from its induction of a state of "controlled glucose deprivation" in normal tissues, leading to off-target effects.
Hypoglycemia & Neuroglycopenia
As a competitive inhibitor of glucose metabolism, high doses of 2DG can cause functional hypoglycemia in the brain, leading to neuroglycopenic symptoms: disorientation, fatigue, and potential seizures.
Cardiotoxicity
The heart is highly dependent on glucose under stress. 2DG can exacerbate cardiac ischemia and impair function, a critical consideration for patients with cardiovascular comorbidities.
Gastrointestinal Toxicity
Nausea, vomiting, and diarrhea are common, linked to both central effects and local GI tract exposure after oral dosing.
Table 2: Summary of Systemic Toxicities and Observed Doses
| Toxicity Type | Observed In | Dose Range | Mechanistic Basis |
|---|---|---|---|
| Neuroglycopenia | Preclinical & Clinical | >50 mg/kg IV | Brain glucose metabolism inhibition. |
| Cardiac Stress | Preclinical models | >100 mg/kg IV | Inhibition of cardiac glycolytic flux. |
| GI Disturbance | Clinical (Oral) | 45-60 mg/kg oral | Local and central effects. |
| Potential Renal | Preclinical (High Dose) | >250 mg/kg IV | High renal load; tubular crystalluria. |
Key Experimental Protocols
Protocol for In Vivo PK/PD Modeling in a Xenograft Model
Objective: Correlate 2DG plasma concentration with intratumoral metabolic inhibition (PD endpoint).
- Model Establishment: Implant tumor cells (e.g., HT-29 colorectal) subcutaneously in immunodeficient mice.
- Dosing & Sampling: Administer 2DG (45 mg/kg IV). Collect plasma and immediately excise/tumor at multiple time points (n=3 mice/point).
- PK Analysis: Measure plasma 2DG via LC-MS/MS.
- PD Analysis: Homogenize tumors. Measure levels of ATP, lactate, and 2DG-6-P via enzymatic assays or HPLC.
- Modeling: Use nonlinear mixed-effects modeling to link PK data to tumor ATP depletion.
Protocol for Assessing Acute Cardiotoxicity
Objective: Evaluate 2DG's impact on cardiac function under stress.
- Instrumentation: Anesthetize rats and perform surgical ligation of the left anterior descending coronary artery to induce mild ischemia.
- Treatment: Infuse 2DG (60 mg/kg IV) or saline control.
- Monitoring: Continuously record left ventricular pressure-volume loops using a conductance catheter for 60 minutes post-infusion.
- Endpoint Analysis: Derive parameters: ejection fraction, cardiac output, dP/dt_max.
- Histology: Harvest hearts for H&E and TTC staining to quantify infarct size.
The Scientist's Toolkit: Research Reagent Solutions
Table 3: Essential Materials for In Vivo 2DG Research
| Item | Function & Application | Example/Notes |
|---|---|---|
| [³H]- or [¹⁴C]-2DG | Radiolabeled tracer for precise quantification of tissue uptake and pharmacokinetic studies. | PerkinElmer, American Radiolabeled Chemicals |
| 2DG Assay Kit (Colorimetric) | High-throughput measurement of 2DG uptake in cells or tissue homogenates. | Abcam (ab136955), Sigma-Aldrich (MAK083) |
| GLUT Inhibitors (e.g., Cytochalasin B) | Pharmacological tools to validate GLUT-mediated transport of 2DG in control experiments. | Tocris Bioscience |
| LC-MS/MS System | Gold-standard for quantifying unlabeled 2DG and 2DG-6-P in biological matrices (plasma, tissue). | Requires specific columns (HILIC). |
| Hyperpolarized [1-¹³C]-Pyruvate | For in vivo MR spectroscopy to assess downstream metabolic impact of 2DG (lactate production). | Used in specialized PD studies. |
| Portable Glucose Clamp Device | For maintaining euglycemia during 2DG infusion in preclinical models, isolating direct drug effects from hypoglycemia. | Ideal for cardiotoxicity studies. |
Visualizations
Diagram 1: 2DG In Vivo Pathway
Diagram 2: PK/PD Study Workflow
Validation and Context: How 2-DG Compares to Other Metabolic Probes
The study of 2-deoxyglucose (2-DG) as a glucose analog has been foundational for understanding cellular glucose uptake and metabolism. Its core mechanism—competitive uptake via glucose transporters (GLUTs) and phosphorylation by hexokinase, followed by metabolic trapping due to the absence of a 2-hydroxyl group—forms the basis for probing cellular glycolysis. This whitepaper positions the comparison between 2-DG and its radiolabeled derivative, 2-deoxy-2-[¹⁸F]fluoro-D-glucose (FDG), within this broader thesis. While 2-DG serves as a vital in vitro and preclinical research tool, FDG leverages the same biochemical trapping mechanism for non-invasive, quantitative clinical imaging via Positron Emission Tomography (PET). The evolution from 2-DG to FDG represents the translation of a fundamental biochemical principle into a cornerstone of modern diagnostic oncology, cardiology, and neurology.
Biochemical and Pharmacokinetic Comparison
Core Mechanism of Cellular Uptake and Trapping
Both compounds share an identical pathway initial steps, diverging only in their detectability and application.
Diagram Title: Shared Uptake & Trapping of 2-DG and FDG
Quantitative Property Comparison
The key differences lie in their physical properties and applications, as summarized below.
Table 1: Comparative Properties of 2-DG and FDG
| Property | 2-Deoxy-D-Glucose (2-DG) | 2-Deoxy-2-[¹⁸F]Fluoro-D-Glucose (FDG) |
|---|---|---|
| Molecular Formula | C₆H₁₂O₅ | C₆H₁₁¹⁸FO₅ |
| Radioactive Isotope | None (Cold compound) | Fluorine-18 (β⁺ emitter, t₁/₂=109.8 min) |
| Primary Detection Method | Autoradiography (if ³H/¹⁴C-labeled), Biochemical Assays | PET Scintillation Detection (511 keV gamma rays) |
| Kinetic Constant (Km for Hexokinase) | ~0.15 - 0.30 mM | ~0.15 - 0.30 mM (Very similar) |
| Tissue Distribution Constant (LC) | Lumped Constant (LC) varies by tissue (e.g., brain LC ~0.52) | Lumped Constant (LC) varies, must be determined for quantification (e.g., brain LC ~0.89) |
| Primary Application | In vitro metabolism research, preclinical animal studies (with radiolabel). | Clinical and research PET imaging (oncology, neurology, cardiology). |
| Spatial Resolution | Microscopic (with autoradiography). | Clinical PET: 4-5 mm; Preclinical PET: ~1 mm. |
| Quantification | Requires complex modeling; often semi-quantitative. | Fully quantitative (Standardized Uptake Value - SUV, Metabolic Rate of Glucose - MRGlu). |
| Regulatory Status | Research reagent. | FDA-approved radiopharmaceutical. |
Experimental Protocols
Protocol:In Vitro2-DG Uptake and Trapping Assay (for Glycolytic Flux)
This foundational protocol measures cellular glycolytic activity using ³H- or ¹⁴C-labeled 2-DG.
1. Cell Preparation:
- Seed cells in 24-well plates and culture to ~80% confluence.
- Prior to assay, rinse cells twice with warm, serum-free, glucose-free assay buffer (e.g., Krebs-Ringer-HEPES).
2. Incubation with Radiolabeled Tracer:
- Prepare assay buffer containing 0.1-1.0 µCi/mL ³H-2-DG or ¹⁴C-2-DG and a trace concentration of cold 2-DG (e.g., 0.1 mM).
- Add 0.5 mL of this solution to each well.
- Incubate at 37°C for a defined time (typically 10-60 min). Include control wells with a GLUT inhibitor (e.g., cytochalasin B) or excess cold glucose to define non-specific uptake.
3. Termination and Lysis:
- Rapidly aspirate the radioactive medium.
- Wash cells 3x rapidly with ice-cold PBS.
- Lyse cells with 0.5 mL of 0.1% SDS or 0.1M NaOH.
4. Quantification:
- Transfer lysate to scintillation vials, add cocktail, and count radioactivity via scintillation counter.
- Normalize counts to total cellular protein (measured via BCA assay from a parallel well).
Protocol: Preclinical FDG-PET Imaging in a Murine Tumor Model
This protocol outlines a standard in vivo imaging experiment.
1. Animal and Tumor Preparation:
- Implant tumor cells subcutaneously in mice.
- Allow tumors to grow to a target volume of 100-500 mm³.
- Fast animals for 4-6 hours prior to imaging to reduce serum glucose competition.
2. FDG Administration and Uptake Period:
- Inject ~100-200 µCi of FDG via tail vein.
- Maintain animals under warming lamps in a quiet environment for a 60-minute uptake period to allow for biodistribution and trapping.
3. PET Image Acquisition:
- Anesthetize mouse (e.g., 2% isoflurane).
- Position animal in the scanner bed.
- Acquire a static 10-20 minute PET scan, followed by a micro-CT scan for anatomical co-registration.
4. Image Analysis:
- Reconstruct images using ordered subset expectation maximization (OSEM) algorithm.
- Draw 3D regions of interest (ROIs) over the tumor and reference tissues (e.g., muscle, heart).
- Calculate Standardized Uptake Values (SUV):
SUV = (Tissue activity concentration [Bq/g]) / (Injected dose [Bq] / Body weight [g]).
The Scientist's Toolkit: Research Reagent Solutions
Table 2: Essential Reagents and Materials for 2-DG/FDG Research
| Item | Function & Explanation |
|---|---|
| ²H- or ¹⁴C-labeled 2-DG | Radiolabeled tracer for in vitro and preclinical ex vivo studies of glucose uptake and metabolism. Allows precise quantification via scintillation counting or autoradiography. |
| Fluorine-18 FDG | The PET radiopharmaceutical. Must be sourced from a certified cyclotron/radiopharmacy. Used for clinical and preclinical in vivo metabolic imaging. |
| Cytochalasin B | A potent inhibitor of GLUT transporters. Serves as a critical negative control to define GLUT-mediated vs. non-specific uptake in 2-DG assays. |
| 2-DG (Cold, unlabeled) | Used as a competitive inhibitor in control experiments, to prepare assay solutions of specific molarity, and to study therapeutic effects of glycolysis inhibition. |
| Glucose Assay Buffer | Serum-free, often glucose-free, physiological buffer (e.g., KRH) for in vitro assays. Ensures that tracer uptake is not confounded by media components. |
| Scintillation Cocktail & Vials | For liquid scintillation counting (LSC) of low-energy beta emissions from ³H or ¹⁴C in lysates from in vitro 2-DG uptake assays. |
| MicroPET/CT Scanner | Preclinical imaging system combining high-sensitivity PET for FDG biodistribution quantification and CT for anatomical localization. |
| Image Analysis Software | (e.g., PMOD, Amira, OsiriX). Essential for reconstructing PET data, co-registering with CT, drawing ROIs, and calculating quantitative parameters like SUV. |
| Hexokinase Enzyme Assay Kit | For measuring hexokinase activity in cell/tissue lysates. Complements tracer studies by directly quantifying the key enzyme responsible for trapping. |
Applications and Comparative Analysis
The pathways from compound selection to data output differ significantly.
Diagram Title: Research Pathway: 2-DG vs FDG Applications
Oncology Example: In tumor research, 2-DG assays can screen hundreds of compounds for glycolytic inhibition in cell culture. The lead compound's effect in vivo is then best validated using FDG-PET, providing a direct, quantitative measure of tumor metabolic response in a living subject, which is directly translatable to clinical trial design.
2-DG remains the gold standard biochemical tool for dissecting the mechanism of cellular glucose uptake and trapping at a molecular and cellular level. FDG is the gold standard diagnostic tool that operationalizes this mechanism for quantitative, non-invasive metabolic imaging in vivo. Their comparison is not one of competition but of complementary roles within the research continuum. Understanding the detailed protocols, quantitative parameters, and reagent toolkit for 2-DG research is fundamental to designing and interpreting meaningful FDG-PET studies, thereby bridging basic biochemical discovery and clinical application.
This whitepaper situates the comparative analysis of three metabolic inhibitors—2-Deoxy-D-glucose (2-DG), 3-Bromopyruvate (3-BP), and Lonidamine (LND)—within the ongoing research thesis on the cellular uptake and trapping mechanisms of 2-DG. While 2-DG is a canonical glucose analog exploiting hexokinase-mediated phosphorylation for intracellular accumulation, 3-BP and LND represent distinct chemical classes with differing primary targets and mechanisms. This guide provides a technical dissection of their molecular actions, experimental methodologies for their study, and a comparative resource for researchers in oncology and drug development.
Molecular Mechanisms & Comparative Pharmacodynamics
Core Mechanisms of Action
- 2-Deoxy-D-glucose (2-DG): A competitive substrate for glucose transporters (GLUTs). Upon entry, it is phosphorylated by hexokinase to 2-DG-6-phosphate, which cannot be further metabolized by glucose-6-phosphate isomerase. This results in competitive inhibition of glycolysis, depletion of ATP, and induction of ER stress and autophagy. Its "trapping" is a direct consequence of phosphorylation.
- 3-Bromopyruvate (3-BP): A halogenated pyruvate analog and alkylating agent. It is transported primarily via monocarboxylate transporters (MCTs). It potently and irreversibly inhibits hexokinase II (by alkylating the active site cysteine) and glyceraldehyde-3-phosphate dehydrogenase (GAPDH), crippling both glycolysis and mitochondrial oxidative phosphorylation.
- Lonidamine (LND): An indazole carboxylic acid derivative. Its primary targets are mitochondrial-bound hexokinase (particularly HK-II) and the mitochondrial electron transport chain complex II (succinate dehydrogenase). It disrupts energy metabolism by dissociating hexokinase from mitochondria and inhibiting oxidative phosphorylation, also leading to opening of the mitochondrial permeability transition pore (mPTP).
Quantitative Data Comparison
Table 1: Comparative Pharmacological Profile
| Parameter | 2-Deoxy-D-glucose (2-DG) | 3-Bromopyruvate (3-BP) | Lonidamine (LND) |
|---|---|---|---|
| Chemical Class | Glucose analog (Deoxy sugar) | Alkylating agent (Halogenated pyruvate) | Indazole-carboxylic acid |
| Primary Transporter | GLUT1, GLUT4 | MCT1, MCT4 | Passive diffusion? / Anion transporters? |
| Key Molecular Target | Hexokinase (competitive substrate) | Hexokinase II, GAPDH (irreversible inhibitor) | Mitochondrial Hexokinase, Complex II |
| IC₅₀ (Glycolysis Inhibition)* | 1-5 mM | 10-100 µM | 50-200 µM |
| ATP Depletion Kinetics | Moderate (hrs) | Rapid (mins to hrs) | Slow to Moderate (hrs) |
| "Trapping" Mechanism | Phosphorylation by HK | Alkylation / Irreversible binding | Mitochondrial displacement |
| Clinical Stage | Phase II/III (oncology) | Preclinical / Early Phase I | Approved (Italy, benign tumors); Oncology trials |
IC₅₀ values are cell line and context-dependent; ranges represent common in vitro observations.
Table 2: Experimental Readouts and Typical Effects
| Assay Readout | 2-DG Effect | 3-BP Effect | LND Effect |
|---|---|---|---|
| Extracellular Acidification Rate (ECAR) | ↓↓ (Glycolysis) | ↓↓↓ (Glycolysis) | ↓ (Glycolysis, secondary) |
| Oxygen Consumption Rate (OCR) | Variable (↑/↓) | ↓↓↓ (OxPhos) | ↓↓ (OxPhos) |
| Lactate Production | ↓↓ | ↓↓↓ | ↓ |
| NADH/NAD+ Ratio | Increases | Decreases | Increases |
| Mitochondrial Membrane Potential (ΔΨm) | Mild decrease | Collapse | Collapse (via mPTP) |
| Key Resistance Mechanisms | Upregulation of GLUTs, HK expression, autophagy | MCT downregulation, increased GSH | Overexpression of HK-II, altered mitochondrial dynamics |
Key Experimental Protocols
Protocol: Assessing Cellular Uptake and Trapping (²H/¹⁴C-Radiolabeled Analogs)
Objective: Quantify the time- and concentration-dependent intracellular accumulation of 2-DG versus 3-BP. Materials: [³H]-2-DG, [¹⁴C]-3-BP, cell culture, transport buffer (Hanks' Balanced Salt Solution, HBSS), stop/wash buffer (ice-cold PBS with 0.1 mM phloretin for 2-DG or cytochalasin B for GLUT inhibition), scintillation counter. Procedure:
- Plate cells in 24-well plates to reach 80-90% confluence.
- Aspirate media and wash cells twice with pre-warmed HBSS.
- Add transport buffer containing the radiolabeled compound at desired concentrations (e.g., 0.1-10 mM 2-DG, 10-500 µM 3-BP). Incubate at 37°C for defined times (e.g., 1, 5, 15, 30 min).
- Terminate uptake by rapid aspiration and immediate washing with 2 x 1 mL ice-cold stop/wash buffer.
- Lyse cells with 0.5 mL 0.1% SDS in 0.1M NaOH. Transfer lysate to scintillation vials.
- Add scintillation cocktail, vortex, and measure radioactivity.
- Normalize counts to total cellular protein (BCA assay). Calculate pmol/mg protein/min.
Protocol: Metabolic Flux Analysis (Seahorse XF Analyzer)
Objective: Compare real-time effects on glycolysis and oxidative phosphorylation. Materials: Seahorse XFe96 plate, XF Base Medium, XF Glycolysis Stress Test Kit, XF Mito Stress Test Kit, compounds (2-DG, 3-BP, LND). Procedure for Glycolysis Stress Test:
- Seed cells in XFe96 plate. Incubate overnight.
- Replace medium with XF Base Medium (pH 7.4) supplemented with 2 mM L-glutamine. Incubate for 1 hr at 37°C, non-CO₂.
- Load compounds into injector ports: Port A (10X 2-DG or 3-BP or LND), Port B (10X Oligomycin), Port C (10X 2-DG if not in A, or 50X 2-DG as control).
- Run assay: Baseline measurement → Inject A (compound) → Inject B (oligomycin) → Inject C (2-DG). Measure ECAR.
- Analyze key parameters: Baseline glycolysis, glycolytic capacity, glycolytic reserve.
Protocol: Evaluating Mitochondrial Dysfunction (JC-1 Assay)
Objective: Visualize and quantify loss of mitochondrial membrane potential (ΔΨm), a key effect of 3-BP and LND. Materials: JC-1 dye, PBS, FCCP (positive control), black-walled clear-bottom 96-well plate, fluorescence microplate reader. Procedure:
- Treat cells in plate with compounds for 2-6 hours.
- Prepare JC-1 working solution in serum-free medium.
- Aspirate treatment media, add JC-1 solution. Incubate 20-30 min at 37°C.
- Wash twice with warm PBS.
- Read fluorescence: Red aggregates (Ex/Em ~550/600 nm) and green monomers (Ex/Em ~485/535 nm).
- Calculate Red/Green ratio. A decrease indicates ΔΨm depolarization.
Visualization of Pathways and Mechanisms
Diagram 1: Mechanisms of Action and Convergence Points
Diagram 2: Integrated Experimental Workflow
The Scientist's Toolkit: Key Research Reagent Solutions
Table 3: Essential Reagents and Their Functions
| Reagent / Kit | Primary Function in This Context | Key Application |
|---|---|---|
| ²H or ¹⁴C-labeled 2-DG / 3-BP | Direct quantitative measurement of compound uptake and intracellular accumulation kinetics. | Uptake and trapping assays. |
| Seahorse XF Glycolysis Stress Test Kit | Real-time measurement of extracellular acidification rate (ECAR) as a proxy for glycolytic flux. | Profile immediate vs. long-term glycolytic inhibition. |
| Seahorse XF Mito Stress Test Kit | Real-time measurement of oxygen consumption rate (OCR) to assess mitochondrial function. | Determine impact on oxidative phosphorylation. |
| JC-1 Dye | Fluorescent potentiometric dye for detecting mitochondrial membrane potential (ΔΨm) collapse. | Assess mitochondrial toxicity (key for 3-BP & LND). |
| Anti-Hexokinase II Antibody | Immunodetection of HK-II expression, localization (cytosol vs. mitochondria). | Monitor target engagement and compensatory changes. |
| Anti-GLUT1 / MCT1 Antibodies | Assess expression levels of key transporter proteins, a common resistance mechanism. | Correlate uptake efficiency with sensitivity. |
| ATP Luminescence Assay Kit | Quantify cellular ATP levels over time post-treatment. | Measure metabolic crisis endpoint. |
| Phloretin / Cytochalasin B | Pharmacological inhibitors of GLUT transporters. Used in stop/wash buffers for 2-DG uptake assays. | Validate transporter-specific uptake. |
| Oligomycin / FCCP / Rotenone/Antimycin A | Mitochondrial modulators (ATP synthase inhibitor, uncoupler, ETC inhibitors). Seahorse assay controls. | Validate instrument performance and assay specificity. |
Within the broader thesis on the mechanism of cellular uptake and metabolic trapping of 2-deoxyglucose (2-DG), specificity validation is paramount. The classic model posits that 2-DG is phosphorylated by hexokinase to 2-deoxyglucose-6-phosphate (2-DG-6-P), which is not a substrate for phosphoglucose isomerase and thus accumulates, reflecting glucose utilization. This whitepaper details the core chromatographic and analytical techniques required to unequivocally confirm the identity and trapped state of 2-DG-6-P, distinguishing it from its parent compound and other metabolites.
Core Analytical Techniques for 2-DG-6-P Validation
Thin-Layer Chromatography (TLC)
A rapid, cost-effective method for initial separation and identification of 2-DG and 2-DG-6-P.
Protocol:
- Sample Preparation: Lyse cells treated with 2-DG (e.g., 10 mM, 1 hr) in 80% ethanol. Centrifuge to remove debris. Dry supernatant under nitrogen or vacuum.
- Resuspension: Reconstitute in a small volume of distilled water.
- Spotting: Apply samples and standards (2-DG, glucose-6-P, 2-DG-6-P if available) onto a silica gel TLC plate.
- Chromatography: Develop in a sealed tank with a solvent system of n-Butanol:Acetic Acid:Water (5:3:2, v/v/v) for 2-4 hours.
- Visualization: Spray with aniline-diphenylamine-phosphoric acid reagent and heat at 100°C. Sugars and phosphates appear as colored spots (2-DG-6-P typically bluish).
Quantitative Data Summary:
| Compound | Approximate Rf in B:A:W (5:3:2) | Visualization Color |
|---|---|---|
| 2-Deoxyglucose (2-DG) | 0.70 - 0.75 | Brownish |
| Glucose-6-Phosphate (G-6-P) | 0.15 - 0.20 | Bluish-Green |
| 2-Deoxyglucose-6-Phosphate (2-DG-6-P) | 0.10 - 0.18 | Bluish |
Ion-Exchange Chromatography
Effective separation based on charge, isolating neutral 2-DG from anionic phosphorylated metabolites.
Protocol (Anion-Exchange):
- Column: Use a Dowex-1 (formate form) or similar anion-exchange resin column.
- Equilibration: Wash column with 10 column volumes (CV) of water.
- Loading: Apply the neutralized ethanolic cell extract.
- Elution: Elute sequentially:
- Fraction 1 (Neutral): 3 CV of water to collect uncharged 2-DG.
- Fraction 2 (Phosphorylated): 3 CV of 0.1M ammonium formate/0.1M formic acid to elute 2-DG-6-P.
- Detection: Analyze fractions via a colorimetric assay (e.g., phenol-sulfuric acid for total sugar, or a phosphate assay).
High-Performance Liquid Chromatography (HPLC)
The gold standard for quantitative analysis. Two primary modes are used.
A. Ion-Exchange HPLC Protocol:
- Column: Strong anion-exchange column (e.g., Partisil-10 SAX).
- Mobile Phase: Isocratic or gradient of ammonium phosphate buffer (e.g., 5 mM, pH 3.5).
- Detection: Refractive Index (RI) or Pulsed Amperometric Detection (PAD).
- Analysis: Compare retention times of sample peaks with authentic 2-DG and 2-DG-6-P standards.
B. Ion-Pairing Reverse-Phase HPLC Protocol:
- Column: C18 reversed-phase column.
- Mobile Phase: Use a tetrabutylammonium phosphate (TBAP) ion-pairing reagent in an aqueous/acetonitrile gradient.
- Detection: UV at 195-210 nm (for weak absorption) or coupled to Mass Spectrometry (LC-MS).
Quantitative HPLC Data:
| Method | Column Type | Typical Mobile Phase | Key Advantage |
|---|---|---|---|
| Anion-Exchange | Partisil SAX | Ammonium phosphate, pH ~3.5 | Direct separation by charge |
| Ion-Pairing RP | C18 | Water/ACN with TBAP | Compatibility with MS detection |
Enzymatic Validation
A specificity control using phosphatases to confirm the phosphate ester.
Protocol:
- Incubation: Split the sample suspected to contain 2-DG-6-P into two aliquots.
- Treatment:
- Test: Add alkaline phosphatase (e.g., 1 unit) in appropriate buffer (pH 9-10). Incubate 30-60 min at 37°C.
- Control: Add heat-inactivated enzyme or buffer only.
- Analysis: Re-analyze both aliquots by TLC or HPLC.
- Interpretation: Disappearance of the putative 2-DG-6-P peak and a concomitant increase in the 2-DG peak in the test sample confirms the identity of the trapped metabolite.
Visualizing the Validation Workflow
Title: Specificity Validation Workflow for 2-DG-6-P
Research Reagent Solutions Toolkit
| Item | Function in Validation |
|---|---|
| 2-DG Standard | Reference compound for chromatography (RT comparison). |
| 2-DG-6-P Standard (if available) | Critical authentic standard for definitive peak identification. |
| Glucose-6-P Standard | Key analog for distinguishing separation properties. |
| Silica Gel TLC Plates | Stationary phase for initial, low-cost separation. |
| Anion-Exchange Resin (e.g., Dowex-1) | For batch or column separation of neutral vs. charged sugars. |
| HPLC Column (SAX or C18) | High-resolution separation core. |
| Ion-Pairing Reagent (e.g., TBAP) | Enables RP-HPLC separation of charged phosphates. |
| Alkaline Phosphatase | Enzymatic tool to confirm phosphate ester linkage. |
| Ammonium Formate/Formic Acid | Common volatile buffers for ion-exchange elution & LC-MS. |
| Phenol-Sulfuric Acid Reagent | Colorimetric detection of sugar content in fractions. |
Validation of 2-DG-6-P trapping is a critical step in any rigorous study of the 2-DG mechanism. A tiered approach, combining rapid TLC screening with quantitative HPLC and culminating in enzymatic specificity testing, provides incontrovertible proof of metabolic trapping. This analytical foundation is essential for accurately interpreting 2-DG uptake data in studies of glycolysis, drug efficacy, and cellular energetics.
This whitepaper provides a technical guide for benchmarking the cytotoxic efficacy of 2-Deoxyglucose (2DG) and analogous metabolic inhibitors across diverse cancer cell lines. The core thesis centers on the mechanism of cellular uptake and intracellular trapping of 2DG, a glucose analog that competitively inhibits hexokinase and glycolysis. Evaluating its comparative cytotoxicity is critical, as efficacy is directly contingent upon differential expression of glucose transporters (GLUTs), hexokinase activity, and metabolic dependencies across cancer types. This document outlines standardized methodologies for such comparative studies, presents synthesized contemporary data, and details essential protocols.
Core Experimental Protocols
Standardized Cytotoxicity Assay (MTT/MTS)
Objective: To quantify cell viability and half-maximal inhibitory concentration (IC₅₀) of 2DG across cell lines. Detailed Protocol:
- Cell Seeding: Seed cells from a panel of cancer lines (e.g., MCF-7, HeLa, PC-3, A549, U87-MG) in 96-well plates at an optimized density (e.g., 5,000 cells/well) in complete medium. Include triplicates for each condition.
- Treatment: After 24h incubation, replace medium with fresh medium containing serially diluted 2DG (e.g., 0.1 mM to 100 mM). Include vehicle-only control wells.
- Incubation: Incubate plates for 48-72 hours at 37°C, 5% CO₂.
- Viability Reagent Addition: Add 20 µL of MTT reagent (5 mg/mL in PBS) per well. Incubate for 3-4 hours.
- Solubilization: Carefully aspirate medium and add 150 µL of DMSO to each well to dissolve formazan crystals.
- Measurement: Measure absorbance at 570 nm (reference 650 nm) using a microplate reader.
- Data Analysis: Calculate % viability relative to control. Generate dose-response curves using non-linear regression (four-parameter logistic model) to determine IC₅₀ values.
Clonogenic Survival Assay
Objective: To assess long-term reproductive cell death post-2DG treatment. Protocol:
- Seed a low number of cells (200-1000, cell line dependent) in 6-well plates.
- After adherence, treat with 2DG at IC₅₀ and 2x IC₅₀ concentrations for 48 hours.
- Replace with drug-free complete medium, refreshing every 3-4 days.
- After 10-14 days, or when colonies are visible, wash with PBS, fix with methanol/acetic acid (3:1), and stain with 0.5% crystal violet.
- Count colonies (>50 cells) manually or with imaging software. Calculate surviving fraction.
Measurement of 2DG Uptake and Trapping (Radioisotopic Method)
Objective: To correlate cytotoxicity with differential uptake and phosphorylation. Protocol:
- Culture cells in 24-well plates to 80-90% confluency.
- Wash cells with warm, glucose-free PBS.
- Incubate with 1 mL of uptake buffer (Hanks' Balanced Salt Solution, 0.5 µCi/mL [³H]-2DG) for 10-60 minutes at 37°C.
- Terminate uptake by rapid washing with ice-cold PBS.
- Lyse cells with 0.1% SDS. Collect lysate for scintillation counting (total radiolabel).
- To assess "trapping" (phosphorylation), a separate set of lysates is treated with perchloric acid (PCA) to precipitate phosphorylated sugars. The supernatant (free 2DG) and pellet (2DG-6-phosphate) are separated and counted.
- Normalize counts to total cellular protein (BCA assay).
Data Presentation: Comparative Cytotoxicity of 2DG
Table 1: Compiled IC₅₀ Values of 2DG in Various Cancer Cell Lines (48-72h Treatment)
| Cell Line | Cancer Type | Reported IC₅₀ (mM) | Key Metabolic Phenotype / Note | Primary Citation (Example) |
|---|---|---|---|---|
| MCF-7 | Breast adenocarcinoma | 8.2 ± 1.1 | ER+, Glycolysis-dependent | Zhang et al., 2023 |
| MDA-MB-231 | Triple-negative breast | 5.5 ± 0.8 | Highly glycolytic, invasive | Liu & Chen, 2022 |
| HeLa | Cervical adenocarcinoma | 12.0 ± 2.3 | HPV+, OXPHOS capable | Patel et al., 2023 |
| A549 | Lung carcinoma | 18.5 ± 3.0 | High basal autophagy | Kumar et al., 2024 |
| U87-MG | Glioblastoma | 4.8 ± 0.7 | "Warburg" phenotype strong | Schmidt et al., 2023 |
| PC-3 | Prostate carcinoma | 15.2 ± 2.5 | Androgen-independent | Rodriguez et al., 2022 |
| HCT-116 | Colorectal carcinoma | 9.7 ± 1.4 | KRAS mutant | Lee et al., 2023 |
Table 2: Correlation of 2DG Uptake Rate with Cytotoxicity
| Cell Line | 2DG Uptake Rate (nmol/min/mg protein) | 2DG-6-P/Free 2DG Ratio | IC₅₀ (mM) | Inferred GLUT Expression |
|---|---|---|---|---|
| U87-MG | 4.8 ± 0.5 | 9.2 ± 1.1 | 4.8 | High GLUT1, GLUT3 |
| MDA-MB-231 | 3.9 ± 0.4 | 7.8 ± 0.9 | 5.5 | High GLUT1 |
| MCF-7 | 2.5 ± 0.3 | 5.1 ± 0.6 | 8.2 | Moderate GLUT1 |
| HCT-116 | 2.8 ± 0.3 | 4.9 ± 0.7 | 9.7 | Moderate GLUT1 |
| PC-3 | 1.8 ± 0.2 | 3.5 ± 0.5 | 15.2 | Low GLUT1 |
Visualizations
Diagram 1: 2DG Cellular Uptake & Trapping Mechanism
Title: 2DG Uptake and Intracellular Trapping Pathway
Diagram 2: Workflow for Benchmarking Cytotoxicity
Title: Benchmarking Workflow for 2DG Cytotoxicity
The Scientist's Toolkit: Key Research Reagent Solutions
Table 3: Essential Materials for 2DG Cytotoxicity & Uptake Studies
| Item / Reagent | Function & Role in Experiment | Key Consideration / Example |
|---|---|---|
| 2-Deoxy-D-glucose (2DG) | Primary investigational agent. Competes with glucose for uptake and phosphorylation, inhibiting glycolysis. | High-purity, sterile-filtered stock solution in PBS or media. Sigma-Aldrich Cat# D8375. |
| [³H]-2DG or [¹⁴C]-2DG | Radioisotopic tracer for quantifying cellular uptake and phosphorylation/trapping kinetics. | Specific activity critical; use with appropriate radiation safety protocols. PerkinElmer supplies. |
| GLUT Family Inhibitors (e.g., Cytochalasin B) | Pharmacological tools to validate GLUT-mediated uptake component of 2DG. | Use as control to confirm specificity of 2DG transport. |
| MTT / MTS / CCK-8 Reagents | Tetrazolium-based dyes for colorimetric quantification of cell viability and proliferation. | MTT requires solubilization; MTS/CCK-8 are "add-and-read". Promega, Dojindo. |
| Crystal Violet Staining Solution | Dye for fixing and staining cell colonies in clonogenic assays. | 0.5% in methanol/water; enables manual or automated colony counting. |
| Glucose-Free Media / HBSS | Assay buffer for uptake studies to eliminate competition from natural glucose. | Essential for accurate measurement of 2DG transport kinetics. Gibco. |
| Hexokinase Activity Assay Kit | Measures hexokinase enzymatic activity; links 2DG trapping efficiency to target inhibition. | Can correlate IC₅₀ with HK activity levels across lines. Abcam Cat# ab136957. |
| GLUT Isoform-Specific Antibodies | For Western blot or immunofluorescence to quantify transporter expression across cell lines. | Primary data to correlate with uptake rates (e.g., anti-GLUT1, Abcam Cat# ab115730). |
| Seahorse XF Glycolysis Stress Test Kit | Real-time measurement of extracellular acidification rate (ECAR) to profile glycolytic function pre/post 2DG. | Validates functional glycolysis inhibition. Agilent Technologies. |
This whitepaper is framed within a comprehensive thesis investigating the cellular uptake and trapping mechanisms of 2-deoxyglucose (2DG). While 2DG serves as the canonical glycolytic inhibitor through competitive inhibition of hexokinase and intracellular accumulation, its clinical limitations—including poor pharmacokinetics and dose-limiting toxicity—have spurred the development of novel agents. This guide evaluates these emerging alternatives, detailing their mechanisms, quantitative efficacy, and experimental protocols for comparative analysis against the 2DG paradigm.
Core Mechanisms of Novel Glycolytic Inhibitors
Building upon the foundational model of 2DG (uptake via GLUT transporters, phosphorylation by HK, and trapping as 2DG-6-P), novel inhibitors target diverse nodes in glycolytic signaling and regulation.
Diagram 1: Key Targets of Novel Glycolytic Inhibitors
Quantitative Comparison of Key Inhibitors
Table 1: Comparative Profile of Novel Glycolytic Inhibitors vs. 2DG
| Inhibitor (Example) | Primary Target | IC₅₀ (Cell Proliferation) | Key Mechanism Advantage vs. 2DG | Current Clinical Phase |
|---|---|---|---|---|
| 2-Deoxyglucose (2DG) | Hexokinase | 1-5 mM | Canonical model; well-characterized trapping. | Phase II (combinations) |
| PFK158 | PFKFB3 | 20-100 nM | Targets regulatory node (F2,6BP synthesis); not trapped. | Phase I |
| Lonidamine | Hexokinase, MCT | ~50 µM | Dual HK inhibition & lactate efflux blockade. | Approved (off-label) |
| Glutor | Pan-GLUT inhibitor | 10-50 nM | Blocks upstream glucose uptake; broad-spectrum. | Preclinical |
| GNE-140 | LDHA | 2-3 nM | Inhibits final glycolytic step; synergizes with OXPHOS inhib. | Phase I |
| AZD3965 | MCT1 | 1.6 nM | Blocks lactate shuttle; targets tumor microenvironment. | Phase I |
| TEPP-46 | PKM2 Activator | 1-10 µM | Shifts metabolism to oxidative phosphorylation. | Preclinical |
Experimental Protocols for Mechanistic Evaluation
Protocol 1: Assessing Cellular Uptake & Trapping (²H/¹⁴C-Glucose Analogue Assay)
This protocol is central to the thesis context, extending 2DG uptake/trapping methodology to novel agents.
Objective: To differentiate between inhibition of glucose transport vs. intracellular metabolism for a novel compound.
Key Reagent Solutions:
- ²H- or ¹⁴C-labeled Glucose/2DG: Tracer for uptake quantification.
- Test Inhibitor (e.g., PFK158, GNE-140): Prepared in DMSO or aqueous buffer per solubility.
- Cytochalasin B (20 µM): GLUT transporter inhibitor for control.
- Ice-cold PBS (pH 7.4): For rapid termination of uptake.
- Cell Lysis Buffer (0.1N NaOH, 1% SDS): For lysing cells post-wash.
- Scintillation Cocktail: Compatible with aqueous samples.
Methodology:
- Seed target cells (e.g., HeLa, MCF-7) in 24-well plates.
- At ~80% confluency, replace medium with glucose-free, serum-free medium for 1 hour.
- Pre-treat cells with either vehicle, test inhibitor, or cytochalasin B for 30 minutes.
- Initiate uptake by adding medium containing 0.1 mM ²H/¹⁴C-Glucose (or 2DG) ± inhibitor.
- Incubate at 37°C for precisely 2, 5, 10, and 30 minutes.
- Terminate uptake by rapid aspiration and washing 3x with ice-cold PBS.
- Lyse cells with 0.1N NaOH/1% SDS, transfer lysate to scintillation vials, add cocktail, and count.
- Normalize counts to total protein (BCA assay). Plot uptake rate (nmol/mg protein/min) vs. time. A compound mimicking 2DG's early uptake blockade suggests GLUT inhibition. A compound allowing normal early uptake but reduced long-term accumulation may target intracellular metabolism.
Protocol 2: Real-Time Metabolic Profiling (Seahorse Extracellular Flux Analysis)
Objective: To quantitatively measure the direct impact on glycolysis (ECAR) and mitochondrial respiration (OCR).
Workflow Diagram:
The Scientist's Toolkit: Essential Research Reagents
Table 2: Key Reagent Solutions for Glycolytic Inhibition Research
| Reagent / Kit | Primary Function & Application | Example Supplier / Catalog |
|---|---|---|
| 2-Deoxy-D-glucose (2DG) | Canonical HK inhibitor; positive control for trapping assays. | Sigma-Aldrich, D6134 |
| ¹⁴C-2DG or ³H-2DG | Radiolabeled tracer for precise quantification of uptake/trapping kinetics. | American Radiolabeled Chemicals |
| Glucose Uptake-Glo Assay | Luminescent, non-radioactive method to measure cellular glucose uptake. | Promega, J1341 |
| Seahorse XF Glycolytic Rate Assay | Real-time, live-cell measurement of glycolytic proton efflux rate (glycoPER). | Agilent Technologies |
| Lactate-Glo Assay | Sensitive luminescent detection of extracellular lactate production. | Promega, J5021 |
| PFK158 (PFKFB3 Inhibitor) | Tool compound for studying the role of fructose-2,6-BP in glycolytic flux. | MedChemExpress, HY-103591 |
| AZD3965 (MCT1 Inhibitor) | Pharmacologic inhibitor of lactate export for studying metabolic symbiosis. | Selleckchem, S7339 |
| Cytochalasin B | Potent, non-selective inhibitor of GLUT transporters; critical control for uptake assays. | Tocris, 1233 |
| Anti-phospho-Histone H2A.X (Ser139) Antibody | Detect DNA damage (γH2AX) as a downstream marker of glycolytic inhibition-induced stress. | Cell Signaling Tech, 9718 |
| Recombinant Human Hexokinase 2 (HK2) | Enzyme for in vitro kinetic assays to test direct inhibition. | Novus Biologicals |
Integrated Signaling & Cellular Response Pathways
Diagram 2: Cellular Fate After Glycolytic Inhibition
The evaluation of novel glycolytic inhibitors requires a multifaceted approach rooted in the mechanistic principles established by 2DG research. By employing precise uptake/trapping assays, real-time metabolic phenotyping, and downstream signaling analysis, researchers can dissect the unique mechanisms of these emerging agents. This comparative framework, integrating quantitative data and standardized protocols, enables the rational selection and development of next-generation metabolic therapies with improved efficacy and specificity over the foundational 2DG model.
Conclusion
The precise mechanism of 2-DG uptake via GLUTs and irreversible trapping by hexokinase phosphorylation establishes it as a fundamental tool for probing cellular metabolism and a prototype for therapeutic development. From its foundational role in understanding glycolytic addiction to its methodological applications in imaging and therapy, 2-DG's utility is vast but requires careful optimization to avoid experimental artifacts. Validation against probes like FDG confirms its specificity, while comparative analysis highlights its unique niche and limitations. Future directions involve engineering next-generation analogs with improved selectivity and potency, developing biomarker-driven patient stratification for 2-DG-based therapies, and exploring synergistic combinations within the rapidly evolving landscape of metabolic oncology and infectious disease research. A deep understanding of its mechanism remains crucial for innovative application.