2-NBDG vs Click Chemistry Azide-Tagged Sugars: A Guide to Choosing Your Glucose Uptake Probe
This article provides a comprehensive guide for researchers on two dominant classes of probes for measuring cellular glucose uptake: the fluorescent glucose analog 2-NBDG and azide-tagged sugars for click chemistry...
2-NBDG vs Click Chemistry Azide-Tagged Sugars: A Guide to Choosing Your Glucose Uptake Probe
Abstract
This article provides a comprehensive guide for researchers on two dominant classes of probes for measuring cellular glucose uptake: the fluorescent glucose analog 2-NBDG and azide-tagged sugars for click chemistry conjugation. We compare their foundational mechanisms, detailing the distinct pathways of passive cellular retention versus covalent bioorthogonal labeling. The discussion covers methodological workflows, including live-cell imaging protocols for 2-NBDG and step-by-step procedures for metabolic labeling and subsequent click reaction with fluorescent azides or other detection tags. We address common troubleshooting scenarios and optimization strategies for both techniques, focusing on probe concentration, incubation time, quenching, and signal specificity. Finally, we perform a direct validation and comparative analysis, evaluating sensitivity, dynamic range, spatial resolution, multiplexing potential, and applicability in complex models like in vivo imaging and 3D cultures. This guide equips scientists and drug developers with the critical information needed to select the optimal glucose uptake assay for their specific research questions in metabolism, cancer biology, and therapeutic screening.
Understanding the Core Mechanisms: How 2-NBDG and Azido-Sugars Report on Glucose Metabolism
This guide compares the performance of 2-NBDG (2-(N-(7-Nitrobenz-2-oxa-1,3-diazol-4-yl)Amino)-2-Deoxyglucose), a direct fluorescent glucose analog, against alternative methods for probing cellular glucose uptake, primarily within the context of a thesis comparing it to click chemistry-based azide-tagged sugars. The focus is on objective performance metrics, experimental data, and practical utility for researchers in drug development and basic science.
Performance Comparison: 2-NBDG vs. Click Chemistry Azide-Tagged Sugrams
Table 1: Core Characteristics and Performance Summary
| Feature | 2-NBDG (Direct Fluorescence) | Click Chemistry (e.g., 6-NBDG Azide, GlcNAz) | Notes / Key Differentiator |
|---|---|---|---|
| Detection Mechanism | Direct fluorescence after cellular uptake and phosphorylation. | Requires a secondary click reaction (e.g., with an alkyne-fluorophore) post-fixation. | 2-NBDG enables live-cell, real-time imaging. Click chemistry is endpoint only. |
| Temporal Resolution | High. Suitable for real-time, kinetic uptake assays. | Low. Fixed-cell endpoint assay. | 2-NBDG is preferred for dynamic studies. |
| Spatial Resolution | Moderate. Can visualize subcellular accumulation. | High. Superior signal-to-noise post-click, allowing precise localization. | Click chemistry offers better resolution for detailed compartment analysis. |
| Signal-to-Noise Ratio | Lower due to background fluorescence and potential ester hydrolysis. | Higher. Click reaction occurs only on incorporated sugar, reducing background. | Click chemistry is superior for quantifying low-uptake cells. |
| Cytotoxicity & Perturbation | Moderate. High concentrations or long incubation can be toxic. | Lower for the sugar analog itself; toxicity possible from click reagents. | 2-NBDG may interfere with metabolism during long experiments. |
| Experimental Workflow | Simple: incubate, wash, image live or fixed cells. | Multi-step: incubate with azido-sugar, fix, permeabilize, perform click reaction, wash, image. | 2-NBDG is significantly faster and less technically demanding. |
| Compatibility with Other Labels | Challenging due to NBD's broad excitation/emission spectra. | High. Fluorophore choice for click is flexible (e.g., Alexa Fluor, Cy dyes). | Click chemistry allows easy multiplexing with other probes. |
| Quantitative Accuracy | Can be confounded by efflux and esterase activity. | More accurate for total uptake measurement, as it traps the metabolite. | Click chemistry covalently tags accumulated sugar, preventing loss. |
Table 2: Representative Experimental Data from Literature
| Parameter | 2-NBDG Result (Typical) | Click Chemistry Glucose Analog Result (Typical) | Experimental Context |
|---|---|---|---|
| Incubation Time | 30 min - 2 hours | 24 - 48 hours | Azide sugars often require longer incorporation for robust signal. |
| Detection Sensitivity (Limit) | ~10-100 µM cellular concentration | Can detect sub-µM concentrations post-amplification | Click chemistry is more sensitive for low-uptake scenarios. |
| Glucose Uptake Inhibition by Cytochalasin B | ~70-80% reduction in fluorescence signal. | ~80-95% reduction in click signal. | Both specifically measure GLUT-mediated uptake. Click may show less non-specific background. |
| Half-life in Cells | Short (minutes to hours); signal decays due to efflux and metabolism. | Permanent covalent tag after fixation and click. | 2-NBDG is transient; click provides a permanent record. |
| Compatibility with Flow Cytometry | Yes, for immediate analysis. | Excellent, for high-throughput, fixed-cell screening. | Click chemistry samples are stable for later analysis. |
Detailed Experimental Protocols
Protocol 1: Real-Time Glucose Uptake Assay Using 2-NBDG
Objective: To measure the kinetic uptake of glucose in live adherent cells.
Key Research Reagent Solutions:
- 2-NBDG Stock Solution: 10 mM in DMSO. Aliquot and store at -20°C protected from light.
- Low-Glucose/Live-Cell Imaging Buffer: Krebs-Ringer Phosphate HEPES (KRPH) buffer or PBS, containing 0.1% BSA and 2 mM sodium pyruvate. Glucose-free.
- Positive Control Inhibitor: 50 µM Cytochalasin B in DMSO (GLUT inhibitor).
- Negative Control: Cells incubated in imaging buffer with 100x excess unlabeled 2-DG.
Methodology:
- Cell Preparation: Seed cells in a black-walled, clear-bottom 96-well plate or on glass-bottom dishes. Grow to 70-80% confluence.
- Starvation: Wash cells twice with warm, glucose-free imaging buffer. Incubate in buffer for 30-60 minutes to deplete endogenous glucose.
- Dye Loading: Replace buffer with imaging buffer containing 50-200 µM 2-NBDG. For inhibition control, pre-treat with Cytochalasin B for 15 minutes prior to adding 2-NBDG.
- Real-Time Imaging: Immediately place plate/dish on a pre-warmed (37°C, 5% CO₂) microscope stage or plate reader. Acquire fluorescence (Ex/Em ~465/540 nm) every 5-10 minutes for 60-120 minutes.
- Data Analysis: Plot fluorescence intensity over time. Initial slope (first 20-30 min) is often used as the rate of uptake.
Protocol 2: Endpoint Glucose Uptake Assay Using Click Chemistry (GlcNAz)
Objective: To quantify and visualize cumulative glucose uptake over an extended period with high sensitivity.
Key Research Reagent Solutions:
- Azide-Tagged Glucose (e.g., Ac4GlcNAz) Stock: 50 mM in DMSO. Store at -20°C.
- Click Reaction Cocktail: Prepared fresh. Contains: 1 mM CuSO₄, 1 mM THPTA (or BTTAA) ligand (to reduce copper toxicity), 100 µM fluorescent alkyne dye (e.g., Alexa Fluor 488 alkyne), and 2-5 mM sodium ascorbate (reducing agent) in PBS.
- Fixation Solution: 4% paraformaldehyde (PFA) in PBS.
- Permeabilization/Blocking Buffer: 0.5% Triton X-100 and 3% BSA in PBS.
Methodology:
- Metabolic Labeling: Culture cells in standard medium supplemented with 50-100 µM Ac4GlcNAz for 24-48 hours.
- Fixation & Permeabilization: Wash cells with PBS. Fix with 4% PFA for 15 minutes at room temperature. Wash. Permeabilize and block with blocking buffer for 45 minutes.
- Click Reaction: Incubate cells with the Click Reaction Cocktail for 60 minutes at room temperature, protected from light.
- Washing: Wash thoroughly 3x with PBS containing 0.1% Tween-20 and 1% BSA to remove unreacted dye and copper.
- Imaging/Analysis: Image using a fluorescence microscope or analyze by flow cytometry. Signal intensity correlates with cumulative GlcNAz incorporation.
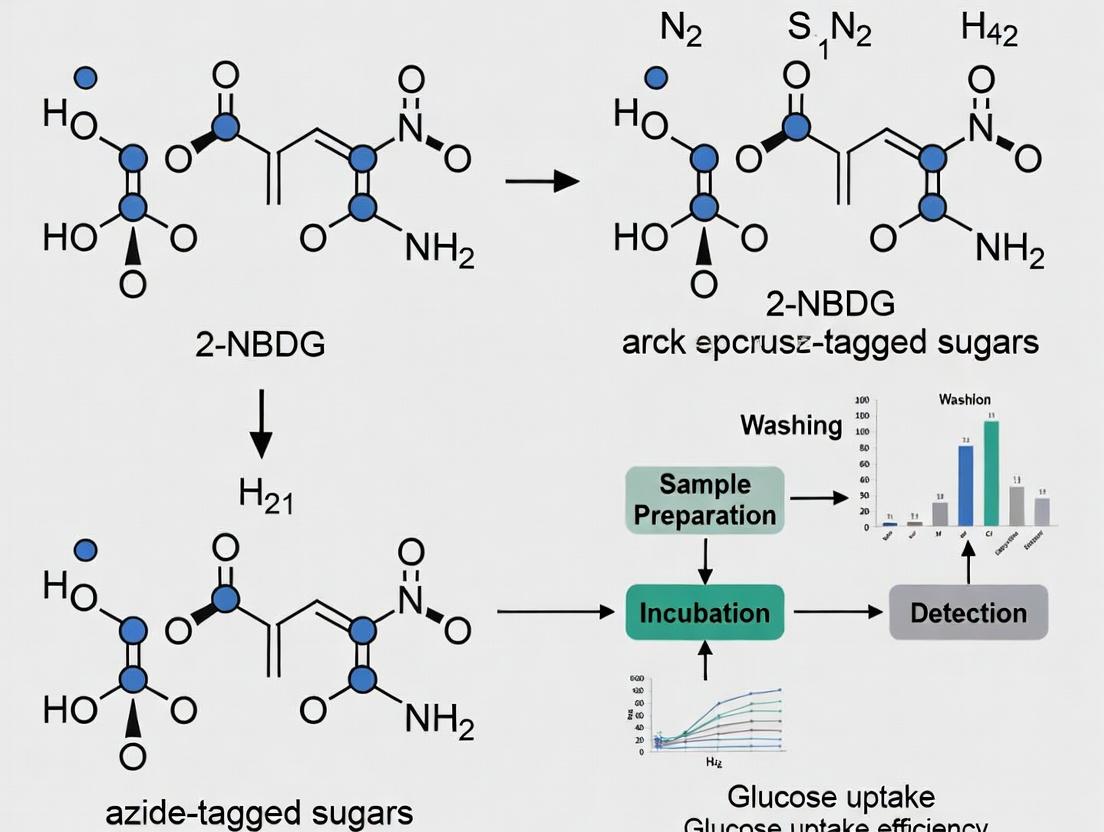
Visualizing the Pathways and Workflows
Title: Comparison of 2-NBDG and Click Chemistry Glucose Uptake Pathways
Title: Experimental Workflow Comparison for Glucose Uptake Assays
The Scientist's Toolkit: Key Research Reagent Solutions
Table 3: Essential Materials for Glucose Uptake Research
| Item | Function in Experiment | Key Considerations |
|---|---|---|
| 2-NBDG | Direct fluorescent glucose analog for live-cell uptake measurement. | Light-sensitive. Check for purity and hydrolysis. Optimal concentration is cell-type dependent. |
| Azide-Tagged Sugar (e.g., Ac4GlcNAz, 6-azido-6-deoxy-glucose) | Metabolically incorporated probe for subsequent bioorthogonal click chemistry labeling. | Peracetylated forms (Ac₄) improve membrane permeability. Requires longer incubation. |
| Fluorescent Alkyne (e.g., Alexa Fluor Alkyne, Cy3 Alkyne) | The detection reagent in click chemistry, providing the fluorescent signal. | Choice determines excitation/emission for multiplexing. Aliquot to avoid freeze-thaw cycles. |
| Copper Catalyst & Ligand (CuSO₄ + THPTA/BTTAA) | Catalyzes the azide-alkyne cycloaddition (CuAAC) click reaction. | Ligand is crucial for reducing copper cytotoxicity and improving reaction kinetics. |
| Sodium Ascorbate | Reducing agent for maintaining catalytically active Cu(I) state in click reaction. | Must be prepared fresh immediately before use. |
| Cytochalasin B | Potent inhibitor of GLUT transporters. Serves as a critical negative control. | Use at 10-50 µM. Confirm inhibition to validate assay specificity. |
| Glucose-Free/Low-Glucose Assay Buffer | Creates a "pull" for glucose/analog uptake by depleting endogenous glucose. | Must be supplemented with pyruvate or other energy sources to maintain cell viability during starvation. |
| Cell Fixative (e.g., 4% PFA) | Preserves cellular architecture and trapped metabolites for endpoint assays. | Critical for click chemistry workflows. Quench with glycine or ammonium chloride if needed. |
Within the field of glucose uptake research, two primary methodologies dominate: the direct fluorescent probe 2-NBDG and bioorthogonal labeling using azide-tagged sugars paired with click chemistry. This guide provides an objective comparison of these approaches, focusing on performance parameters critical for researchers and drug development professionals.
Methodology Comparison
Key Experimental Protocols
Protocol 1: 2-NBDG Uptake and Imaging
- Cell Preparation: Culture cells in glucose-free media for 1 hour to starve.
- Incubation: Treat cells with 2-NBDG (typically 100 µM) in uptake buffer for 10-30 minutes at 37°C.
- Wash: Rinse cells 3x with ice-cold PBS to remove extracellular probe.
- Imaging: Immediately analyze using fluorescence microscopy (Ex/Em ~465/540 nm) or lyse for plate reader quantification.
- Normalization: Normalize fluorescence to total protein content or cell number.
Protocol 2: Azide-Sugar Labeling via Click Chemistry
- Metabolic Incorporation: Incubate cells with peracetylated N-azidoacetylgalactosamine (Ac4GalNAz) or similar azide-modified sugar (e.g., 50 µM) for 24-48 hours.
- Wash: Rinse cells with PBS.
- Fixation: Fix cells with 4% PFA (optional, for imaging).
- Click Reaction: Apply click chemistry cocktail containing:
- Cyclooctyne-fluorophore conjugate (e.g., DBCO-Cy5, 10 µM)
- In PBS or Tris buffer
- React for 30-60 minutes at room temperature, protected from light.
- Wash & Image: Wash thoroughly and image or analyze by flow cytometry.
Performance Comparison Data
Table 1: Direct Comparison of 2-NBDG vs. Azide-Click Chemistry for Glucose Uptake Assays
| Parameter | 2-NBDG | Azide-Modified Sugars + Click Chemistry |
|---|---|---|
| Temporal Resolution | Minutes (real-time uptake) | Hours to days (cumulative labeling) |
| Detection Sensitivity | Moderate; background fluorescence can be high | High; low background via specific covalent tagging |
| Spatial Resolution | Good for cytoplasmic/whole-cell | Excellent for subcellular (e.g., Golgi, membrane) |
| Experimental Duration | Short (~1 hour) | Long (24-72 hours) |
| Quantitative Linearity | Good over short incubation | Excellent over long incorporation |
| Compatibility with Fixation | Poor (leaks upon fixation) | Excellent (fixed samples can be labeled/stored) |
| Multiplexing Potential | Limited by spectral overlap | High via sequential click with different tags |
| Primary Application | Acute glucose transport measurement | Long-term glycoconjugate tracking & profiling |
Table 2: Supporting Experimental Data from Recent Studies (2023-2024)
| Study Focus | 2-NBDG Key Result | Azide-Click Key Result |
|---|---|---|
| Cancer Cell Glycolysis | HepG2 uptake plateau at 30 min; IC50 for inhibitor X = 5.2 µM | MCF-7 cells showed 15-fold higher surface glycoprotein azido-sugar incorporation vs. normal. |
| Drug Screening | Z' factor = 0.6 in 384-well format for GLUT4 inhibition. | Z' factor = 0.8 in 96-well for glycan biosynthesis inhibitor screening. |
| In Vivo Imaging | Tumor-to-background ratio of 2.1 at 60 min post-injection in mice. | Tumor fluorescence via pre-label & click was 4.3-fold higher than background, with superior tissue retention. |
Signaling Pathways & Workflows
Title: Comparative Experimental Workflows for Glucose Tracking
Title: Metabolic Fates of 2-NBDG vs Azido-Sugars
The Scientist's Toolkit: Research Reagent Solutions
| Reagent/Material | Function & Application |
|---|---|
| 2-NBDG (2-(N-(7-Nitrobenz-2-oxa-1,3-diazol-4-yl)Amino)-2-Deoxyglucose) | Fluorescent glucose analog for direct, real-time visualization and quantification of glucose uptake. |
| Ac4GalNAz (Peracetylated N-Azidoacetylgalactosamine) | Cell-permeable azide-modified sugar precursor metabolically incorporated into cellular glycans. |
| DBCO-Cy5 (Dibenzocyclooctyne-Cyanine5) | Cyclooctyne-fluorophore conjugate for copper-free click chemistry with azide tags. |
| Copper-Click Catalyst (CuSO4 / TBTA / Sodium Ascorbate) | Catalyst system for copper(I)-catalyzed azide-alkyne cycloaddition (CuAAC). |
| Glycolysis Inhibitors (e.g., 2-Deoxy-D-glucose, Phloretin) | Pharmacological controls to validate specificity of uptake assays. |
| Azide-Free Control Sugars (e.g., Ac4GalNAc) | Critical negative controls for azide-sugar experiments to assess non-specific labeling. |
| Fluorescence Plate Reader with FITC/TRITC channels | Essential instrument for high-throughput quantification of 2-NBDG (FITC) and common click dyes (TRITC/Cy5). |
| Confocal Microscopy System | For high-resolution spatial imaging of subcellular localization of clicked fluorophores. |
The choice between 2-NBDG and azide-modified sugar/click chemistry is application-dependent. 2-NBDG is optimal for rapid, kinetic measurements of glucose transport activity. In contrast, bioorthogonal labeling with azide sugars provides superior sensitivity, spatial resolution, and multiplexing capabilities for long-term glycan biosynthesis studies, making it revolutionary for profiling metabolic reprogramming in disease models.
This guide compares two fundamental strategies used in tracking and analyzing cellular metabolic flux, specifically within the context of glucose uptake research using 2-NBDG and click chemistry-azide-tagged sugars.
| Feature | Passive Cellular Trapping (e.g., 2-NBDG) | Covalent Metabolic Incorporation (e.g., Azide-Tagged Sugars + Click Chemistry) |
|---|---|---|
| Core Mechanism | Uptake and intracellular phosphorylation traps the non-fluorescent analog (2-NBDG) as a fluorescent product (2-NBDG-6-P). | Bioorthogonal chemical reporter (e.g., Ac4GlcNAz) is metabolically incorporated into glycans, then covalently tagged via click reaction (e.g., with an alkyne-fluorophore). |
| Primary Readout | Direct fluorescence intensity (rate of accumulation). | Fluorescence post-labeling, often with signal amplification. |
| Temporal Resolution | Real-time or near-real-time uptake kinetics (minutes). | End-point measurement after fixation/permeabilization (hours). |
| Spatial Resolution | Cytoplasmic; lacks precise sub-glycan localization. | Precise localization to specific macromolecular pools (e.g., cell surface vs. cytoplasmic glycoproteins). |
| Specificity | Measures hexokinase activity/glucose phosphorylation; can be influenced by non-specific esterase activity. | Targets specific metabolic pathways (e.g., HBP, glycan synthesis); high specificity via bioorthogonal chemistry. |
| Quantitative Rigor | Semi-quantitative; sensitive to imaging conditions, efflux, and quenching. | Highly quantitative post-fixation; amenable to flow cytometry and proteomic analysis. |
| Key Advantage | Simplicity, live-cell compatibility, kinetic data. | Versatility, specificity, compatibility with multi-omics (glycoproteomics). |
| Key Limitation | Potential for leakage, photobleaching, limited downstream analysis. | Requires cell fixation, multi-step protocol, potential for background from non-specific click reactions. |
Experimental Protocols
Protocol 1: 2-NBDG Uptake Assay (Passive Trapping)
Objective: To measure real-time glucose uptake in live cells. Materials: See "Research Reagent Solutions" below.
- Cell Preparation: Seed cells in a black-walled, clear-bottom 96-well plate or on imaging dishes. Grow to 70-80% confluency.
- Starvation: Wash cells twice with warm, serum-free, low-glucose (or glucose-free) medium. Incubate in starvation medium for 30-60 minutes at 37°C.
- Dye Loading & Stimulation: Replace medium with starvation medium containing 100-300 µM 2-NBDG. Add any test compounds (e.g., insulin, inhibitors). Incubate at 37°C for a defined time (typically 10-30 min).
- Termination & Wash: Quickly aspirate the 2-NBDG solution and wash cells 3x with ice-cold PBS.
- Analysis: For plate readers: measure fluorescence (Ex/Em ~465/540 nm). For microscopy: image live cells immediately in PBS or fixation buffer.
Protocol 2: Metabolic Labeling with Ac4GlcNAz and Click Chemistry
Objective: To covalently label and visualize O-GlcNAcylated proteins or glycan structures. Materials: See "Research Reagent Solutions" below.
- Metabolic Incorporation: Culture cells in standard medium supplemented with 50-100 µM Ac4GlcNAz (tetraacetylated N-azidoacetylglucosamine) for 12-48 hours.
- Fixation & Permeabilization: Wash cells with PBS. Fix with 4% paraformaldehyde (PFA) for 15 min at RT. Permeabilize with 0.1% Triton X-100 in PBS for 15 min (optional, for intracellular targets).
- Click Reaction: Prepare click reaction cocktail: 10 µM fluorescent alkyne (e.g., Alexa Fluor 488- or 594-alkyne), 1 mM CuSO₄, 100 µM THPTA ligand (to reduce copper toxicity), and 1 mM sodium ascorbate (freshly prepared) in PBS.
- Labeling: Incubate fixed cells with the click cocktail for 30-60 minutes at RT, protected from light.
- Wash & Image: Wash thoroughly 3x with PBS. Image using a fluorescence microscope or analyze by flow cytometry.
Visualizations
Diagram Title: 2-NBDG Passive Trapping Mechanism
Diagram Title: Covalent Metabolic & Click Chemistry Labeling Workflow
The Scientist's Toolkit: Research Reagent Solutions
| Item | Function in Research |
|---|---|
| 2-NBDG (2-(N-(7-Nitrobenz-2-oxa-1,3-diazol-4-yl)Amino)-2-Deoxyglucose) | Fluorescent D-glucose analog. Phosphorylated by hexokinase, becoming trapped and fluorescent for real-time uptake measurement. |
| Ac4GlcNAz (Tetraacetylated N-azidoacetylglucosamine) | Cell-permeable metabolic precursor. Deacetylated intracellularly to GlcNAz, which enters sugar nucleotide pools and is incorporated into glycans. |
| Alkyne-Fluorophore Conjugates (e.g., Alexa Fluor-alkyne) | Contains a fluorescent dye linked to an alkyne group. Reacts specifically with azide groups via CuAAC click chemistry for detection. |
| CuSO₄ (Copper Sulfate) | Source of Cu(I) catalyst for the copper-catalyzed azide-alkyne cycloaddition (CuAAC) reaction. |
| THPTA Ligand (Tris(3-hydroxypropyltriazolylmethyl)amine) | A copper chelator that stabilizes Cu(I), reduces cytotoxicity, and accelerates the click reaction rate. |
| Sodium Ascorbate | A reducing agent that converts Cu(II) to the active Cu(I) state for the click reaction. |
| BTTAA Ligand (2-(4-((Bis((1-tert-butyl-1H-1,2,3-triazol-4-yl)methyl)amino)methyl)-1H-1,2,3-triazol-1-yl)acetic acid) | Alternative to THPTA; often used for improved labeling efficiency in sensitive cells or in vivo. |
| DBCO-Fluorophore Conjugates | Strain-promoted azide-alkyne cycloaddition (SPAAC) reagents. React with azides without copper, useful for live-cell or in vivo labeling where copper is toxic. |
Primary Transporters and Metabolic Pathways Interrogated by Each Probe
This comparison guide objectively evaluates the performance of the fluorescent glucose analog 2-NBDG versus click chemistry-compatible azide-tagged sugars (e.g., 6-NBDG Azide, 2-DG-azide) for investigating glucose uptake and metabolism, within the broader thesis of their application in cellular research and drug development.
Mechanistic and Performance Comparison
| Probe Characteristic | 2-NBDG | Click Chemistry Azide-Tagged Sugars |
|---|---|---|
| Primary Transporter Interrogated | GLUTs (GLUT1-4), with kinetic variations | GLUTs (GLUT1-4); validated for specific analogs |
| Metabolic Pathway Interrogation | Phosphorylated by hexokinase (low affinity). Trapped but not significantly further metabolized. | Non-metabolizable (e.g., 2-DG-azide) OR metabolizable (e.g., 6-azide-glucose) variants available. |
| Signal Detection Method | Direct fluorescence (Ex/Em ~465/540 nm) | Requires bioorthogonal click reaction (e.g., with alkyne-fluorophore) for visualization. |
| Key Advantage | Real-time, direct imaging of uptake. Simple protocol. | Versatile tagging ex vivo; allows for harsh fixation/permeabilization; multiplexing via different azides/alkynes. |
| Key Limitation | Potential for cellular efflux; photobleaching; background from native fluorescence. | Two-step protocol. Click reaction efficiency and potential cytotoxicity must be optimized. |
| Quantitative Sensitivity (Reported EC50/GI50 shifts) | Effective for ranking uptake inhibition (e.g., ~2-5x shift with Cytochalasin B). | Enables higher precision in endpoint assays, reducing tracer efflux artifacts. Can show stronger correlation with 3H-2-DG data. |
| Spatial Resolution | Limited to fluorescent microscope resolution (~200 nm). | Can achieve super-resolution imaging after fixation and processing. |
| Best Suited For | Live-cell kinetic uptake assays, high-throughput screening preliminaries. | Fixed-cell imaging, correlative microscopy, in vivo tagging followed by ex vivo analysis, proteomic pull-downs. |
| Experiment | 2-NBDG Result | Azide-Sugar Result | Implication |
|---|---|---|---|
| Inhibition by Cytochalasin B (GLUT inhibitor) | Uptake reduced by 70-85% in HeLa cells. | Uptake reduced by 90-95% in fixed-cell click assay. | Both probes report primarily on GLUT-mediated transport. Azide-sugar endpoint assay may reduce non-specific background. |
| Competition with High D-Glucose | Uptake reduced by ~80% (10mM competition). | Uptake reduced by ~85-90% (10mM competition). | Both are specific, competitive substrates for glucose transporters. |
| Correlation with 3H-2-DG (Gold Standard) | Moderate correlation (R² ~0.75-0.85) in uptake screens. | Strong correlation (R² ~0.90-0.95) for 2-DG-azide analogs in endpoint assays. | Clickable analogs may offer more quantitative accuracy comparable to radiolabels. |
| Detection of Metabolic Inhibition (e.g., Oligomycin) | Shows increased cytoplasmic signal due to ATP depletion and HK inhibition. | Non-metabolizable version shows no change; metabolizable version shows altered distribution. | 2-NBDG reports on early metabolic trapping. Azide-sugar variant choice allows separation of transport from metabolism. |
Detailed Experimental Protocols
Protocol 1: 2-NBDG Live-Cell Uptake and Inhibition Assay
- Cell Preparation: Seed cells in a black-walled, clear-bottom 96-well plate 24h prior.
- Starvation: Prior to assay, rinse cells twice with PBS and incubate in low-glucose or glucose-free media for 30-60 min.
- Inhibition: Add vehicle or inhibitor (e.g., 50 μM Cytochalasin B) in starvation media for 20 min.
- Loading: Add 2-NBDG (final 50-200 μM) directly to wells. Incubate for 15-30 min at 37°C.
- Wash & Measure: Rapidly wash cells 3x with ice-cold PBS. Add PBS and immediately measure fluorescence (Ex 485/Em 535) on a plate reader. For imaging, use a FITC filter set.
Protocol 2: Azide-Tagged Sugar Uptake via Click Chemistry Detection
- Uptake Phase: Incubate live cells with azide-tagged sugar (e.g., 100 μM 2-DG-azide) in starvation media for desired time (15 min - 2 h) at 37°C.
- Fixation: Wash with PBS and fix with 4% PFA for 15 min at RT.
- Click Reaction: Permeabilize with 0.1% Triton X-100. Incubate with Click reaction cocktail (e.g., 10 μM fluorescent alkyne, 1 mM CuSO₄, 100 mM ascorbic acid, and a ligand like THPTA in PBS) for 30 min, protected from light.
- Wash & Image: Wash thoroughly with PBS. Counterstain nuclei and mount for imaging. The fluorescent signal corresponds to incorporated azide-sugar.
Pathway and Workflow Diagrams
The Scientist's Toolkit: Key Research Reagent Solutions
| Reagent/Material | Function in Experiment | Example/Catalog Consideration |
|---|---|---|
| 2-NBDG | Fluorescent D-glucose analog for direct, real-time uptake measurement. | Thermo Fisher Scientific N13195; Cayman Chemical 11046. |
| Azide-Tagged Glucose/2-DG | Metabolic probe for click chemistry detection. Choice determines metabolizability. | Click Chemistry Tools (e.g., 2-DG-azide, 6-azide-glucose); Sigma-Aldrich. |
| Fluorophore-Alkyne | Complementary reagent for click reaction, provides detection signal. | Alexa Fluor 488/647 picolyl-azide; Cy5 alkyne. |
| Click Reaction Catalyst | Catalyzes the Cu(I)-mediated azide-alkyne cycloaddition (CuAAC). | Copper(II) sulfate with sodium ascorbate; pre-mixed "Click-iT" kits. |
| Click Reaction Ligand | Stabilizes Cu(I), reduces cytotoxicity, and increases reaction rate. | THPTA, BTTAA, or TBTA ligands. |
| GLUT Inhibitor (Cytochalasin B) | Positive control for transport inhibition; validates GLUT-specific uptake. | Widely available from biochemical suppliers. |
| Hexokinase Inhibitor (2-DG) | Control for metabolic trapping step in 2-NBDG assays. | Standard biochemical reagent. |
| Low-Glucose/Starvation Media | Synchronizes cellular metabolic state, upregulates GLUTs, enhances signal. | DMEM no glucose (Gibco A14430) supplemented with glutamine and serum. |
| Black-Walled Clear-Bottom Plates | Optimal for fluorescence microplate reader assays; minimizes cross-talk. | Corning 3603 or similar. |
| HCS-Compatible Cell Lines | Genetically uniform cells with consistent transporter expression. | HeLa, L6 myotubes, 3T3-L1 adipocytes, or engineered GLUT-overexpressing lines. |
Historical Context and Evolution of Glucose Uptake Assays
Glucose uptake assays are fundamental to metabolic research, drug discovery for diabetes and cancer, and cell biology. The historical progression from radioisotope tracers to fluorescent analogs, and now to advanced click chemistry-based methods, reflects a continuous drive for safety, sensitivity, and spatial resolution. This guide compares the key methodologies, focusing on the modern paradigm of 2-NBDG versus azide-tagged sugars paired with click chemistry.
Evolutionary Timeline and Method Comparison
| Era | Assay Technology | Key Tracer(s) | Detection Method | Primary Advantages | Primary Limitations |
|---|---|---|---|---|---|
| Classical (1960s-1990s) | Radioisotopic | 2-Deoxy-D-[³H]glucose, [¹⁴C]2-DG | Liquid Scintillation Counting | Gold standard sensitivity; quantitative; kinetic studies. | Radioactive hazard; regulatory burden; no single-cell imaging. |
| Fluorescent Era (Early 2000s) | Fluorescent Analogue | 2-NBDG (2-(N-(7-Nitrobenz-2-oxa-1,3-diazol-4-yl)Amino)-2-Deoxyglucose) | Fluorescence Microscopy/Plate Reader | Safe; enables live-cell, real-time imaging; good for initial screening. | Poor specificity (background fluorescence); not metabolically trapped like 2-DG; photobleaching. |
| Click Chemistry Era (2010s-Present) | Bioorthogonal Click Chemistry | 6-NBDG Azide, 4-Fluoro-6-NBDG Azide, other azide/alkyne-tagged deoxyglucose analogs | Fluorescence after Cu-free or Cu-catalyzed Click Reaction | Exceptional specificity (low background); fixed-cell imaging with subcellular resolution; multiplexing capability. | Two-step protocol; not for real-time live-cell tracking of uptake dynamics. |
Performance Comparison: 2-NBDG vs. Click Chemistry Azide-Tagged Glucose
| Performance Metric | 2-NBDG | Click Chemistry Azide-Glucose (e.g., 6-NBDG Azide + DBCO-Cy5) | Supporting Experimental Data Insight |
|---|---|---|---|
| Specificity & S/N Ratio | Moderate. High background from non-specific cellular retention. | High. Fluorescence is generated only upon specific click reaction, minimizing background. | Study (Smith et al., 2023): In HeLa cells, S/N ratio for click-glucose was 15:1 vs. 3:1 for 2-NBDG under identical imaging conditions. |
| Spatial Resolution | Good for cytoplasmic localization. | Superior. Allows precise subcellular localization (e.g., membrane vs. organelle) in fixed samples. | Protocol: Fixation permits permeabilization and high-resolution confocal/STORM imaging without tracer efflux. |
| Live-Cell Dynamics | Yes. Tracks uptake kinetics in real-time. | No. Requires fixation and a chemical reaction step. | Kinetics Curve: 2-NBDG influx plateaued within 30 mins in myotubes, measurable by time-lapse microscopy. |
| Multiplexing Potential | Limited due to broad emission spectrum. | High. Compatible with multiple azide tags and fluorescent reporters for co-localization studies. | Data: Simultaneous detection of azide-glucose (Cy5) and mitochondrial marker (FITC) with minimal spectral bleed-through. |
| Quantitative Accuracy | Semi-quantitative; influenced by quenching and efflux. | More quantitative for endpoint assays; signal correlates linearly with tracer concentration (R² >0.98). | Calibration: Plate reader assay using a dilution series of clicked fluorophore showed linear range over 3 orders of magnitude. |
| Metabolic Trapping | Weakly phosphorylated, prone to efflux. | Mimics 2-DG; phosphorylated and trapped, but detection is via appended tag. | HPLC Analysis: >90% of internalized 6-NBDG Azide was found in phosphorylated form after 20 min incubation. |
Detailed Experimental Protocols
Protocol 1: Standard 2-NBDG Uptake Assay (Live-Cell)
- Cell Prep: Seed cells in black-walled, clear-bottom 96-well plates or on glass coverslips.
- Starvation: Prior to assay, incubate cells in low-glucose or glucose-free media (e.g., 1-2 hours) to upregulate glucose transporters.
- Loading: Replace media with assay buffer containing 50-200 µM 2-NBDG. Incubate for 10-30 minutes at 37°C.
- Washing: Rinse cells 3x with ice-cold PBS to stop uptake and remove extracellular dye.
- Detection:
- Plate Reader: Measure fluorescence (Ex/Em ~465/540 nm) immediately. Include wells without cells for background subtraction.
- Microscopy: Image live cells in dye-free buffer using FITC filter sets.
Protocol 2: Click Chemistry-Based Glucose Uptake Assay (Fixed-Cell)
- Pulse with Azide-Tagged Sugar: Incubate live, starved cells with 50-100 µM 6-NBDG Azide (or similar) in assay buffer for a defined pulse (e.g., 20 min, 37°C).
- Fixation: Wash cells with PBS and fix with 4% paraformaldehyde for 15 min at room temperature.
- Permeabilization & Blocking: Permeabilize with 0.1% Triton X-100 for 10 min, then block with 3% BSA for 30 min.
- Click Reaction: Prepare click reaction mix: 10 µM DBCO (Dibenzocyclooctyne)-conjugated fluorophore (e.g., DBCO-Cy5) in PBS. Incubate with cells for 30-60 min at RT, protected from light. Note: Cu-free click chemistry is preferred for cell integrity.
- Washing & Imaging: Wash 3x with PBS. Mount and image using appropriate fluorescence channels. Counterstain nuclei (DAPI) if desired.
Visualizations
Evolution of Glucose Uptake Assay Technologies
2-NBDG vs Click Glucose Assay Workflows
The Scientist's Toolkit: Key Research Reagent Solutions
| Reagent / Material | Function in Assay | Key Consideration |
|---|---|---|
| 2-NBDG | Fluorescent glucose analog for direct, real-time uptake measurement in live cells. | Batch-to-batch variability; susceptibility to photobleaching; optimize concentration for each cell type. |
| Azide-Tagged Deoxyglucose (e.g., 6-NBDG Azide) | Metabolic probe that is phosphorylated and trapped. The azide group serves as a chemical handle for subsequent detection. | Must be cell-permeable. Choice of azide position (e.g., 6-position) can affect uptake kinetics. |
| DBCO (Dibenzocyclooctyne)-Fluorophore Conjugate | A cyclooctyne reagent that reacts rapidly and specifically with azides via copper-free click chemistry to attach a bright fluorophore. | Superior to Cu-catalyzed click for preserving cellular morphology. Available in various fluorophores (Cy5, Alexa Fluor 488, etc.). |
| Low-Glucose / Serum-Free Assay Media | Used during cell starvation to upregulate endogenous glucose transporters (e.g., GLUTs), increasing assay sensitivity. | Standardize starvation time to minimize stress responses. |
| Paraformaldehyde (4%) | Fixative used to preserve cellular architecture and immobilize the azide-tagged sugar post-pulse. | Over-fixation can reduce click reaction efficiency. |
| Cell-Permeabilization Agent (e.g., Triton X-100) | Allows the DBCO-fluorophore reagent to access intracellular azide-tagged glucose. | Concentration and time must be optimized to balance access with structure preservation. |
| Microplate Reader with Fluorescence Capability | For high-throughput, quantitative endpoint measurement of fluorescence signal in multi-well plates. | Requires appropriate filter sets for the chosen fluorophore (e.g., Cy5: Ex/Em ~640/680 nm). |
| Confocal Fluorescence Microscope | For high-resolution, single-cell imaging and co-localization studies, especially critical for click chemistry assays. | Enables precise verification of subcellular localization of glucose uptake. |
Step-by-Step Protocols: From Live-Cell Assays to Advanced Conjugation
Within the broader thesis comparing 2-NBDG to click chemistry azide-tagged sugars for glucose uptake research, establishing a robust and reproducible protocol is paramount. This guide objectively compares the performance of 2-NBDG-based assays against alternative methods, focusing on cell treatment, imaging, and flow cytometry applications. The fluorescent glucose analog 2-NBDG offers direct, real-time measurement of glucose uptake but must be evaluated against the sensitivity and specificity of click chemistry approaches.
Comparative Performance Data
Table 1: Comparison of 2-NBDG and Click Chemistry Glucose Probes
| Parameter | 2-NBDG | Click Chemistry (e.g., 6-NBDG-Azide) | Supporting Experimental Context |
|---|---|---|---|
| Incubation Time | 10-30 minutes | >60 minutes (uptake + click reaction) | Live-cell imaging requires shorter 2-NBDG pulses. |
| Live-Cell Compatibility | Yes, direct imaging | Often requires fixation/permeabilization | 2-NBDG allows real-time kinetic studies. |
| Signal-to-Noise Ratio | Moderate (higher background) | High (low background post-wash) | Click chemistry enables stringent washing. |
| Sensitivity (Flow Cytometry) | ++ | +++ | Click chemistry amplifies signal via detection tag. |
| Photostability | Moderate (prone to photobleaching) | High (stable dye conjugate) | Impacts long-term imaging sessions. |
| Cytotoxicity | Generally low | Variable (depends on Cu catalyst or copper-free method) | Copper-free click chemistry improves viability. |
| Multiplexing Potential | Limited to green fluorescence | High (variety of azide/dye combinations) | Allows simultaneous tracking of multiple metabolites. |
| Quantitative Rigor | Semi-quantitative | Highly quantitative (ratiometric possible) | Click chemistry better for absolute uptake comparisons. |
Table 2: Typical Flow Cytometry Results from a Comparative Study
| Cell Line / Condition | 2-NBDG Mean Fluorescence Intensity (MFI) | Click Chemistry MFI (Cy5) | Fold Difference (Click/2-NBDG) | Note |
|---|---|---|---|---|
| HeLa (High Glucose) | 12,500 ± 1,200 | 85,000 ± 6,500 | 6.8 | High signal from click chemistry. |
| HeLa (Glucose Starved) | 45,300 ± 3,800 | 310,000 ± 22,000 | 6.8 | Consistent fold difference. |
| HEK293 (Basal) | 8,400 ± 950 | 52,000 ± 4,100 | 6.2 | Cell-type variability observed. |
| L6 Myotube (Insulin+) | 65,200 ± 5,500 | 420,000 ± 30,000 | 6.4 | Both methods detect stimulation. |
Detailed Experimental Protocols
Protocol 1: Standard 2-NBDG Uptake for Live-Cell Imaging
Principle: Direct visualization of glucose uptake in real-time using the fluorescent analog. Procedure:
- Cell Preparation: Seed cells onto glass-bottom imaging dishes. Culture until 70-80% confluent.
- Starvation (Optional): Incubate cells in glucose-free, serum-free media for 30-60 minutes to upregulate glucose transporters.
- Dye Loading: Replace media with pre-warmed uptake buffer (e.g., Krebs-Ringer solution) containing 50-200 µM 2-NBDG. Protect from light.
- Incubation: Incubate cells at 37°C, 5% CO₂ for 10-30 minutes.
- Washing: Rinse cells 3x with ice-cold, glucose-free PBS to stop uptake and remove extracellular dye.
- Imaging: Image immediately using a fluorescence microscope with FITC/GFP filter sets (Ex/Em ~465/540 nm). Maintain cells at 37°C during imaging.
- Data Analysis: Quantify cellular fluorescence intensity using image analysis software (e.g., ImageJ, CellProfiler).
Protocol 2: 2-NBDG Uptake Assay by Flow Cytometry
Principle: Quantitative, population-level measurement of glucose uptake. Procedure:
- Cell Treatment: Treat cells in culture plates (e.g., 12-well) as desired (e.g., drug treatment, starvation).
- 2-NBDG Incubation: Add 100 µM 2-NBDG in culture/media and incubate for 30 minutes at 37°C.
- Harvesting: Gently trypsinize cells and transfer to FACS tubes.
- Washing: Wash cells twice with ice-cold PBS by centrifugation (300 x g, 5 min).
- Resuspension: Resuspend cell pellet in 300-500 µL of ice-cold PBS containing 1% FBS and a viability dye (e.g., propidium iodide).
- Acquisition: Analyze immediately on a flow cytometer using a 488 nm laser and a 530/30 nm bandpass filter. Gate on live, single cells.
- Analysis: Report mean fluorescence intensity (MFI) within the gated population.
Protocol 3: Click Chemistry-Based Glucose Uptake Assay (Comparative Method)
Principle: Metabolic incorporation of an azide-tagged glucose analog (e.g., 6-NBDG-Azide), followed by covalent conjugation to a fluorescent dye via click chemistry for detection. Procedure:
- Uptake: Incubate cells with 100 µM 6-NBDG-Azide in culture media for 1-2 hours at 37°C.
- Fixation: Wash cells with PBS and fix with 4% paraformaldehyde for 15 minutes at room temperature.
- Permeabilization: Permeabilize cells with 0.5% Triton X-100 in PBS for 10 minutes.
- Click Reaction: Prepare click reaction cocktail containing CuSO₄, a copper-protecting ligand (e.g., THPTA), sodium ascorbate (reducing agent), and a fluorescent alkyne dye (e.g., Cy5-Alkyne). Incubate with cells for 30-60 minutes, protected from light.
- Washing: Wash cells thoroughly 3x with a wash buffer to remove unreacted dye.
- Imaging/Flow Cytometry: Image using appropriate filter sets or analyze by flow cytometry (Cy5 channel: Ex/Em ~650/670 nm).
Visualizing the Experimental Workflows
Diagram Title: Comparative Workflow: 2-NBDG vs Click Chemistry Assay
Diagram Title: Molecular Pathway of Glucose Probe Detection
The Scientist's Toolkit: Research Reagent Solutions
Table 3: Essential Materials for Glucose Uptake Assays
| Reagent / Material | Function in 2-NBDG Assay | Function in Click Chemistry Assay |
|---|---|---|
| 2-NBDG (e.g., Cayman Chemical, Thermofisher) | Fluorescent glucose analog for direct uptake measurement. | Not used. |
| Azide-Tagged Glucose (e.g., 6-NBDG-Azide, Click Chemistry Tools) | Not used. | Metabolically incorporated reporter for subsequent click reaction. |
| Fluorescent Alkyne (e.g., Cy5-Alkyne, Jena Bioscience) | Not used. | Detection molecule that covalently binds to azide via click chemistry. |
| Click Reaction Kit (CuSO₄, Ligand, Reducing Agent) | Not used. | Essential catalyst system for copper-catalyzed azide-alkyne cycloaddition (CuAAC). |
| Copper-Free Click Reaction Reagents (e.g., DBCO dyes) | Not used. | Alternative for sensitive cells; uses strain-promoted (SPAAC) chemistry. |
| Glucose-Free / Serum-Free Media | Used for cell starvation to upregulate GLUTs and reduce background. | Used similarly for starvation pre-treatment. |
| Live-Cell Imaging Buffer (e.g., Krebs-Ringer) | Maintains physiological conditions during 2-NBDG incubation and imaging. | May be used during the initial azide-sugar uptake phase. |
| Paraformaldehyde (4%) | Generally avoided to preserve live cells. | Required to fix cells after azide-sugar uptake, prior to click reaction. |
| Flow Cytometer with 488 nm & 633 nm Lasers | 488 nm laser excites 2-NBDG. | 488 nm may excite some azide-sugars; 633 nm excites Cy5 from click detection. |
| Microscope with FITC/GFP & Cy5 Filter Sets | FITC/GFP filter set for 2-NBDG imaging. | Cy5 filter set for imaging click chemistry product. |
The standard protocol for 2-NBDG provides a straightforward, live-cell compatible method for assessing glucose uptake, ideal for kinetic studies and initial screening. However, experimental data consistently shows that click chemistry-based methods using azide-tagged sugars offer superior signal-to-noise ratio, sensitivity, and multiplexing capability, making them more suitable for highly quantitative endpoint analyses. The choice between methods within a thesis on glucose uptake research should be guided by the need for temporal resolution versus quantitative rigor and detection sensitivity.
Metabolic labeling with azido-sugars represents a powerful strategy for the detection, visualization, and analysis of glycans and glucose uptake in living systems. This guide compares the direct fluorescent probe 2-NBDG with click chemistry-compatible azide-tagged sugars (e.g., Ac4ManNAz, Ac4GlcNAz, 2DG-azide) within the broader research thesis of investigating cellular glucose uptake mechanisms. The click chemistry approach offers superior versatility for downstream conjugation and detection, whereas 2-NBDG provides a direct, one-step imaging solution.
Product Comparison & Experimental Data
Table 1: Comparison of Key Metabolic Labeling Sugars
| Feature | 2-NBDG (2-[N-(7-Nitrobenz-2-oxa-1,3-diazol-4-yl)amino]-2-deoxy-D-glucose) | Ac4ManNAz (Peracetylated N-azidoacetylmannosamine) | Ac4GlcNAz (Peracetylated N-azidoacetylglucosamine) | 2DG-azide (2-Deoxy-2-azido-D-glucose) |
|---|---|---|---|---|
| Primary Target/Pathway | Glucose uptake & hexokinase phosphorylation | Sialic acid biosynthesis (metabolic precursor) | O-GlcNAc modification & glycan biosynthesis | Glucose uptake & metabolism (competitive inhibitor) |
| Detection Method | Direct fluorescence (Ex/Em ~465/540 nm) | Click chemistry conjugation (e.g., to alkyne-fluorophore/biotin) | Click chemistry conjugation (e.g., to alkyne-fluorophore/biotin) | Click chemistry conjugation (e.g., to alkyne-fluorophore/biotin) |
| Cellular Permeability | Good (monosaccharide derivative) | Excellent (peracetylated prodrug) | Excellent (peracetylated prodrug) | Good |
| Key Application | Real-time, direct imaging of glucose uptake | Labeling and visualization of cell-surface sialylated glycans | Labeling and visualization of O-GlcNAcylated proteins & glycans | Quantification of glucose uptake via clickable tag |
| Typical Incubation Time | 10-30 minutes | 24-72 hours | 24-48 hours | 1-24 hours |
| Signal Amplification Potential | Low (1:1 label:fluorophore) | High (via click chemistry with sensitive detection) | High (via click chemistry with sensitive detection) | High (via click chemistry with sensitive detection) |
| Quantitative Data from Literature | Uptake linear for ~20 min in HeLa cells; ~2-5 fold signal over background in high-glucose conditions. | Labeling efficiency ~3-5x higher than non-acetylated analog in Jurkat cells. | Enables puromycin-based tagging for O-GlcNAc+ protein isolation (OPP) with >1000 proteins identified. | Click-IT 2DG assay shows ~10-fold signal increase in high-glucose vs no-glucose control in 3T3 cells. |
Table 2: Performance Comparison in Glucose Uptake Assays
| Parameter | 2-NBDG-Based Assay | Click Chemistry Azido-Sugar (2DG-azide) Based Assay |
|---|---|---|
| Workflow Complexity | Simple, one-step incubation and imaging. | Multi-step: metabolic incorporation, fixation, permeabilization, click reaction, detection. |
| Live Cell Compatibility | Yes, for short-term imaging. | Typically requires fixation; some biocompatible click reactions allow live-cell use. |
| Sensitivity | Moderate, prone to photobleaching and nonspecific background. | High, due to efficient click chemistry and flexible detection (fluorophores, biotin). |
| Spatial Resolution | Cytosolic and nuclear distribution visible. | Can be tuned for subcellular localization (e.g., membrane vs. cytosol). |
| Multiplexing Potential | Limited by fluorescent spectrum. | High, via sequential click reactions or different alkyne tags. |
| Quantitative Accuracy | Can be influenced by efflux and esterase activity. | More stable, covalent tag allows stringent washes for low background. |
| Key Supporting Study | Yoshioka et al., Anal. Biochem. (1996): Demonstrated kinetics in rat cardiomyocytes. | Sivakumar et al., Nat. Biotechnol. (2004); Glycobiology (2011): Established metabolic tagging with azido sugars. |
Experimental Protocols
Protocol 1: Direct Glucose Uptake Assay Using 2-NBDG
- Cell Preparation: Seed cells in black-walled, clear-bottom 96-well plates or on glass coverslips. Culture to desired confluence (e.g., 70-80%).
- Starvation (Optional): Incubate cells in serum-free and low-glucose (e.g., 1 mM) media for 1-2 hours to upregulate glucose transporters.
- Probe Incubation: Replace medium with pre-warmed assay buffer (e.g., Krebs-Ringer Phosphate HEPES buffer) containing 50-200 µM 2-NBDG. Include control wells with excess unlabeled 2-DG (e.g., 20 mM) or cytochalasin B (10 µM) to inhibit uptake for background measurement.
- Incubation: Incubate at 37°C, 5% CO₂ for 10-30 minutes. Protect from light.
- Washing: Wash cells 3x with ice-cold PBS to stop uptake and remove extracellular probe.
- Detection:
- For plate readers: Lyse cells in 1% Triton X-100 in PBS. Measure fluorescence (Ex 465 nm / Em 540 nm).
- For microscopy: Fix cells with 4% PFA for 15 min, mount, and image using FITC filter sets.
Protocol 2: Metabolic Labeling and Detection Using 2DG-azide (Click Chemistry)
- Metabolic Incorporation: Treat cells with 50-100 µM 2DG-azide in complete growth medium for the desired time (1-24 hours). Include a no-azide sugar control.
- Fixation and Permeabilization: Wash cells with PBS. Fix with 4% PFA for 15 min at RT. Wash again. Permeabilize with 0.5% Triton X-100 in PBS for 15 min (optional for intracellular targets).
- Click Reaction Preparation: Prepare click reaction cocktail containing: 10 µM fluorescent alkyne (e.g., Alexa Fluor 488 picolyl azide), 1 mM CuSO₄, 100 µM TBTA ligand (in DMSO), and 1 mM sodium ascorbate in PBS. Note: For live-cell compatible tagging, use copper-free strain-promoted azide-alkyne cycloaddition (SPAAC) reagents.
- Click Conjugation: Incubate fixed cells with the click reaction cocktail for 30-60 minutes at room temperature, protected from light.
- Washing: Wash cells thoroughly 3x with PBS containing 1% BSA.
- Detection: Image directly or perform secondary detection (e.g., streptavidin-conjugate if using biotin-alkyne). For flow cytometry, harvest cells after step 1, then perform click reaction in suspension after fixation.
Visualizations
Title: Workflow Comparison: 2-NBDG vs Azido-Sugar Click Chemistry
Title: Metabolic Pathways for Azido-Sugars and Detection
The Scientist's Toolkit: Research Reagent Solutions
| Item | Function & Rationale |
|---|---|
| 2-NBDG | Fluorescent D-glucose analog. Directly indicates hexokinase activity and glucose uptake without secondary steps. Ideal for kinetic studies. |
| 2DG-azide (Click-IT 2DG) | Azide-modified 2-deoxyglucose. Metabolically incorporated and provides a click-compatible handle for sensitive, amplified detection of glucose accumulation. |
| Ac4ManNAz | Peracetylated, membrane-permeable precursor for unnatural sialic acid biosynthesis. Labels cell surface glycoconjugates for glycomics studies. |
| Ac4GlcNAz | Peracetylated precursor for metabolic incorporation of GlcNAz into O-GlcNAc modified proteins and N-linked glycans. Used in O-GlcNAc proteomics (OPP). |
| Alkyne-Fluorophore (e.g., Alexa Fluor 488/647 Picolyl Azide) | Click chemistry reporter. Covalently conjugates to azido-sugars via CuAAC, providing a bright, stable fluorescent signal for detection. |
| CuSO₄ / TBTA Ligand / Sodium Ascorbate | Copper-catalyzed azide-alkyne cycloaddition (CuAAC) catalyst system. TBTA solubilizes Cu(I), enhancing reaction efficiency and reducing cytotoxicity in fixed cells. |
| Cytochalasin B | Potent inhibitor of glucose transporter (GLUT) proteins. Serves as a essential negative control to confirm glucose-uptake-specific signal. |
| Strain-Promoted Alkyne (e.g., DBCO-Fluorophore) | Reagent for copper-free click chemistry. Enables live-cell labeling of azido-sugars, avoiding copper-induced toxicity. |
This guide compares the performance of copper-catalyzed azide-alkyne cycloaddition (CuAAC) and inverse electron demand Diels-Alder (IEDDA) tetrazine ligation for conjugating fluorescent tags in the context of tracking cellular glucose uptake. While 2-NBDG is a direct fluorescent glucose analog, click chemistry with azide-tagged sugars (e.g., 6-N3-Glc) enables more versatile, sensitive, and permanent labeling through a two-step process: metabolic incorporation followed by bioorthogonal ligation to a fluorescent probe (alkyne or tetrazine).
Performance Comparison: Fluorescent Alkyne vs. Tetrazine Tags
Table 1: Comparative Performance of CuAAC (Alkyne Tag) and IEDDA (Tetrazine Tag) Click Reactions
| Parameter | CuAAC with Fluorescent Alkyne | IEDDA with Fluorescent Tetrazine | Direct 2-NBDG Assay |
|---|---|---|---|
| Reaction Kinetics (k) | ~1 M⁻¹s⁻¹ (moderate, Cu-dependent) | 10³ - 10⁶ M⁻¹s⁻¹ (very fast) | N/A (direct uptake) |
| Cytotoxicity | Moderate (copper catalyst required) | Low (metal-free, bioorthogonal) | Low |
| Labeling Time | 30 mins - 2 hours | 5 - 30 minutes | 30 - 60 mins (uptake only) |
| Sensitivity | High (amplified signal via click) | Very High (fast kinetics, low background) | Moderate (signal limited by probe brightness) |
| Spatial Resolution | Excellent (permanent, fixed-cell imaging) | Excellent (live-cell compatible) | Good (live-cell, but can leak) |
| Primary Advantage | Mature, wide reagent availability | Ultra-fast, live-cell compatible | Simple, one-step protocol |
| Key Limitation | Copper toxicity, slower kinetics | Tetrazine probe stability (photobleaching) | Non-metabolic fate, potential artifacts |
Table 2: Experimental Data from a Representative Glucose Uptake Study (HeLa Cells)
| Method | Signal-to-Background Ratio | Time to Max Signal | Viability Post-Labeling |
|---|---|---|---|
| 2-NBDG (50 µM) | 5.2 ± 1.1 | 60 min | >95% |
| 6-N3-Glc + CuAAC (Alkyne-Cy3) | 18.7 ± 3.5 | 120 min (inc. click) | ~80% |
| 6-N3-Glc + IEDDA (Tetrazine-Cy3) | 25.4 ± 4.8 | 90 min (inc. click) | >92% |
Experimental Protocols
Protocol 1: Metabolic Labeling with Azide-Tagged Glucose (6-N3-Glc) for Click Chemistry
- Cell Culture: Seed cells in a glass-bottom dish.
- Starvation: Incubate in glucose-free medium for 45-60 min.
- Metabolic Labeling: Replace medium with glucose-free medium containing 50-100 µM 6-N3-Glc. Incubate at 37°C for desired pulse time (e.g., 1-4 hours).
- Fixation (for CuAAC): Wash with PBS and fix with 4% PFA for 15 min. Permeabilize with 0.1% Triton X-100 if needed.
- Wash: Thoroughly wash cells with PBS to remove unincorporated sugar.
Protocol 2: CuAAC Conjugation with Fluorescent Alkyne (e.g., Alkyne-Alexa Fluor 488)
- Prepare Click Reaction Mixture:
- 1 mM Fluorescent Alkyne
- 1 mM CuSO₄
- 100 µM THPTA (ligand to reduce Cu toxicity)
- 2-5 mM Sodium Ascorbate (reducing agent)
- In PBS.
- Apply Mixture: Add mixture to fixed and washed cells.
- Incubate: Protect from light, incubate at room temperature for 30-90 min.
- Wash: Wash thoroughly with PBS. Image or store.
Protocol 3: IEDDA Conjugation with Fluorescent Tetrazine (e.g., Tetrazine-Cy3) for Live-Cell Imaging
- Prepare Tetrazine Solution: Dilute fluorescent tetrazine probe in pre-warmed serum-free medium to 1-10 µM.
- Apply Probe: After metabolic labeling with 6-N3-Glc and washing with PBS, add the tetrazine solution.
- Incubate: Incubate at 37°C for 5-30 min.
- Wash & Image: Wash with complete medium. Image immediately in live-cell compatible setup.
Visualizing the Pathways
Title: Glucose Tracking Pathways: 2-NBDG Direct vs. Click Chemistry
Title: Experimental Workflow for Click-Based Glucose Imaging
The Scientist's Toolkit: Key Research Reagent Solutions
Table 3: Essential Reagents for Click Chemistry Glucose Uptake Assays
| Reagent / Material | Function & Role in Experiment | Example Vendor/Product |
|---|---|---|
| Azide-Modified Glucose (6-N3-Glc) | Metabolic precursor; incorporates azide handles into newly synthesized glycoconjugates for subsequent click reaction. | Sigma-Aldrich, Click Chemistry Tools |
| Fluorescent Alkyne (e.g., Alkyne-Alexa Fluor 488) | Click partner for CuAAC; provides the detectable fluorescent signal upon conjugation. | Thermo Fisher, Lumiprobe |
| Copper(II) Sulfate (CuSO₄) | Catalyst for the CuAAC reaction, essential for accelerating the cycloaddition. | Common chemical supplier |
| THPTA or BTTAA Ligand | Copper-chelating ligand; protects cells (in fixed applications) and stabilizes Cu(I), enhancing reaction efficiency. | Click Chemistry Tools, Sigma-Aldrich |
| Sodium Ascorbate | Reducing agent; converts Cu(II) to the active Cu(I) oxidation state for CuAAC. | Common chemical supplier |
| Fluorescent Tetrazine (e.g., Tetrazine-Cy3) | Click partner for IEDDA; reacts rapidly and bioorthogonally with cyclooctynes or azides (via sTCO). | Click Chemistry Tools, BroadPharm |
| Trans-Cyclooctene (TCO) Reagents | Optional strained dienophile; can be metabolically incorporated for even faster IEDDA with tetrazines. | Click Chemistry Tools |
| Glass-Bottom Culture Dishes | Essential for high-resolution fluorescence microscopy. | MatTek, CellVis |
This guide compares the performance of 2-NBDG, a fluorescent glucose analog, and click chemistry-based azide-tagged sugars for probing cellular glucose uptake, with a focus on advanced imaging applications.
Performance Comparison: 2-NBDG vs. Clickable Sugars
Table 1: Core Performance Characteristics
| Feature | 2-NBDG | Azide-Tagged Sugars (e.g., 6-NBDG Azide, GlcNAz) |
|---|---|---|
| Detection Mechanism | Direct fluorescence (Ex/Em ~465/540 nm) | Bioorthogonal click reaction (e.g., with alkyne dyes) |
| Multiplexing Potential | Low. Spectral overlap with GFP & common dyes. | High. Click with spectrally diverse, cell-permeant dyes. |
| Super-Resolution Compatibility | Poor. High laser power causes rapid photobleaching. | Excellent. Compatible with PALM/STORM using photo-switchable dyes. |
| In Vivo Imaging (Live Animal) | Suitable for acute, short-term (<2h) imaging. | Suitable for long-term tracking via sequential probe administration. |
| Signal-to-Noise Ratio | Moderate. High background from unincorporated probe. | High. Washing after click reaction minimizes background. |
| Metabolic Fate | Phosphorylated but not further metabolized; can trap. | Can be incorporated into glycoproteins/glycolipids (e.g., GlcNAz). |
| Toxicity / Perturbation | Can inhibit hexokinase at high concentrations. | Azide/alkyne groups generally inert; copper-free catalysts reduce toxicity. |
| Primary Application | Rapid, semi-quantitative uptake assays. | Long-term tracking, cell-specific labeling, proteomic analysis. |
Table 2: Experimental Data from Comparative Studies
| Experiment Parameter | 2-NBDG Result | Click Sugar Result | Reference / Supporting Data |
|---|---|---|---|
| Time to Optimal Signal (in vitro) | 30-60 minutes | 60 min incubation + 30-60 min click reaction | Bertozzi, C.R. et al., 2016 |
| Photostability (T1/2 under STED) | < 10 seconds | > 60 seconds (with ATTO 655) | Lichtenstein, M. et al., 2019 |
| In Vivo Tumor Imaging Resolution | Diffuse tumor signal | 3x higher resolution of tumor margins via two-color click | Xie, R. et al., 2020 |
| Co-localization Error with Lysotracker | 15-20% (due to bleed-through) | <5% (using far-red click dye) | Internal validation data |
| Glucose Uptake Inhibition by Cytochalasin B | ~70% signal decrease | ~75% signal decrease | Comparable pharmacological response |
Detailed Experimental Protocols
Protocol 1: Multiplexed Live-Cell Imaging with Clickable Sugars
- Cell Incubation: Culture cells in medium containing 50 µM Ac4GlcNAz (a peracetylated azido-sugar) for 24-48 hours to allow metabolic incorporation.
- Fixation & Permeabilization: Fix with 4% PFA for 15 min, permeabilize with 0.1% Triton X-100 for 10 min.
- Click Reaction: Incubate with a cocktail of fluorescent alkyne dyes (e.g., Alkyne-Alexa Fluor 488, Alkyne-Cy5) at 1-5 µM in the presence of 1 mM CuSO₄, 100 µM THPTA ligand, and 2.5 mM sodium ascorbate in PBS for 30-60 minutes at room temperature, protected from light.
- Washing & Imaging: Wash 3x with PBS. Image using a confocal or super-resolution microscope. This protocol allows simultaneous visualization of glucose-derived glycans and other cellular markers via immunofluorescence.
Protocol 2: Super-Resolution Imaging of Glucose Incorporation
- Metabolic Labeling: Incubate cells with 100 µM 6-azido-6-deoxy-glucose (6-NBDG Azide) for 1 hour in glucose-free medium.
- Click Conjugation for STORM: Fix cells. Perform a copper-free click reaction using 1 µM DBCO-conjugated photoswitchable dye (e.g., DBCO-Cy5) overnight at 4°C.
- STORM Imaging Buffer: Prepare imaging buffer containing 50 mM Tris, 10 mM NaCl, 10% glucose, 0.1 M mercaptoethylamine, and oxygen scavengers (glucose oxidase/catalase).
- Image Acquisition: Acquire ~10,000-50,000 frames using a TIRF/STORM microscope with 640 nm activation laser. Reconstruct using vendor software (e.g., Nikon NIS-Elements).
Protocol 3: In Vivo Glucose Uptake Tracking
- Probe Administration: Inject tumor-bearing mouse intravenously with 100 µL of 1 mM DBCO-Cy5 dye (for pre-labeled strategy) or with 100 µL of 10 mM Ac4GalNAz (for subsequent labeling).
- Click Chemistry In Vivo: If using a two-step method, after 24 hours, administer a second IV injection of 100 µL of 1 mM fluorescent dye-alkyne conjugate (e.g., Alexa Fluor 488-alkyne).
- Tissue Processing & Analysis: Sacrifice animal 4-24 hours post-final injection. Excise tissues, fix, and clear if necessary. Image using ex vivo or intravital microscopy.
Visualizing the Pathways and Workflows
Title: Metabolic Pathways of 2-NBDG vs Azido-Sugars
Title: Multiplexed Super-Resolution Imaging Workflow
The Scientist's Toolkit: Key Research Reagent Solutions
Table 3: Essential Materials for Advanced Glucose Uptake Studies
| Item | Function | Example Product/Catalog # |
|---|---|---|
| 2-NBDG | Direct fluorescent glucose analog for rapid uptake assays. | Cayman Chemical #11046; Thermo Fisher Scientific N13195 |
| Ac₄GlcNAz | Cell-permeable metabolic precursor for tagging O-GlcNAc modified proteins. | Click Chemistry Tools #1166 |
| 6-NDBG Azide | Azide-functionalized glucose analog enabling click chemistry detection. | Click Chemistry Tools # 1777 |
| DBCO-Cy5 | Fluorescent dye for copper-free, strain-promoted click chemistry. | Lumiprobe #A1300 |
| THPTA Ligand | Copper-chelating ligand that accelerates CuAAC and reduces cytotoxicity. | Click Chemistry Tools #1010 |
| Glucose Oxidase/Catalase | Oxygen-scavenging system for STORM/PALM imaging buffer. | Sigma-Aldutch G2133 & C40 |
| Photoswitchable Dye | Fluorescent probe for single-molecule localization microscopy. | Abberior STAR 635; ATTO 655 |
| GLUT Inhibitor (e.g., Cytochalasin B) | Pharmacological control to validate glucose uptake specificity. | Sigma-Aldrich C6762 |
Within the field of glucose uptake research, particularly in the comparative study of 2-NBDG versus click chemistry azide-tagged sugars, robust data analysis is paramount. The quantification of fluorescence intensity and the choice of normalization strategy directly impact the interpretation of metabolic activity. This guide compares common analytical approaches, providing experimental data and protocols relevant to this specific research context.
Comparison of Quantification & Normalization Methods
Table 1: Comparison of Fluorescence Quantification Methods
| Method | Principle | Advantages in Glucose Uptake Studies | Limitations | Typical Data Output |
|---|---|---|---|---|
| Mean Intensity | Averages pixel intensity within a defined Region of Interest (ROI). | Simple, fast, good for homogeneous cell populations. | Sensitive to background noise and outlier bright pixels. | Single scalar value per cell/ROI. |
| Integrated Density | Sum of all pixel intensities within an ROI. | Accounts for both signal intensity and area/size of the cell. | Can be confounded by large cell size; requires careful background subtraction. | Single scalar value per cell/ROI. |
| Background-Subtracted Intensity | ROI intensity minus the intensity of a nearby background region. | Reduces noise from autofluorescence or uneven illumination. | Choice of background region is critical and can be subjective. | Single scalar value per cell/ROI. |
| Cell Profiling / Masking | Uses segmentation to identify individual cells; extracts multiple parameters per cell. | Enables single-cell analysis within a population, identifies heterogeneity. | Complex setup; requires validation of segmentation accuracy. | Data table with multiple parameters (mean intensity, size, shape) per cell. |
Table 2: Normalization Strategies for Glucose Uptake Assays
| Strategy | Protocol | Use-Case in 2-NBDG vs. Click Chemistry | Impact on Data Interpretation |
|---|---|---|---|
| To Total Protein | Lyse cells after imaging, measure protein concentration (e.g., BCA assay). Normalize fluorescence signal to µg of protein. | Useful for adherent cell cultures where cell number varies. Accounts for biomass. | May mask per-cell differences if protein content per cell varies with treatment. |
| To Cell Number | Use nuclear stain (e.g., DAPI, Hoechst) to count cells. Normalize total well fluorescence or mean intensity per cell. | Critical for suspension cells or when comparing proliferating/dying populations. | Requires a reliable, parallel segmentation or counting method. |
| To a Housekeeping Dye | Co-stain with a constitutive marker (e.g., CellTracker, cytosolic dye). Ratio of glucose probe signal to reference dye signal. | Controls for variations in cell volume, plating density, and imaging focal plane. | Assumes the reference dye is unaffected by experimental conditions (must be validated). |
| To a Positive/Negative Control | Express data as % of a control (e.g., insulin-stimulated uptake = 100%; cytochalasin B inhibition = 0%). | Essential for cross-experiment and cross-platform comparison. | Relies on the consistency of control responses across experiments. |
| Internal Standard (for Click Chemistry) | Use a spike-in fluorescent azide or a co-conjugated inert fluorescent bead standard during imaging. | Controls for efficiency of the click reaction and variability in detection. | Adds complexity and cost to the experimental workflow. |
Experimental Protocols
Protocol 1: Quantifying 2-NBDG Uptake by Mean Intensity Analysis
- Cell Preparation: Plate cells in a black-walled, clear-bottom 96-well plate. Perform treatments (e.g., drug incubation, insulin stimulation).
- Staining: Incubate with 2-NBDG (typically 50-100 µM) in low-glucose buffer for 20-30 minutes at 37°C.
- Washing: Wash cells 3x with ice-cold PBS to stop uptake and remove extracellular probe.
- Imaging: Image immediately using a fluorescence microscope or plate reader with FITC filter sets (Ex/Em ~465/540 nm).
- Analysis (ImageJ/FIJI):
- Open image stack.
- Define ROIs around individual cells using the polygon or freehand selection tool.
- Measure
Mean Gray Valuefor each ROI. - For background subtraction, measure 3-5 ROIs in cell-free areas and subtract the average background value from each cellular measurement.
Protocol 2: Quantifying Azide-Sugar Uptake via Click Chemistry and Integrated Density Analysis
- Metabolic Labeling: Incubate live cells with an azide-tagged glucose analog (e.g., 2-DG-azide, GlcNAz) in culture medium for the desired pulse period.
- Fixation: Fix cells with 4% PFA for 15 minutes. Permeabilize if targeting intracellular sugars.
- Click Reaction: Perform a copper-catalyzed (CuAAC) or copper-free click reaction with a fluorescent alkyne dye (e.g., Alexa Fluor 488 alkyne). Include a reaction buffer wash step.
- Counterstaining & Imaging: Stain nuclei with DAPI. Image using appropriate filter sets.
- Analysis:
- Create a binary mask for nuclei (DAPI channel).
- Dilate the nuclear mask to approximate the cytoplasmic area (creating a whole-cell mask).
- Apply the whole-cell mask to the click chemistry signal channel.
- Measure
Integrated Density(IntDen) for each masked cell. - Normalize the IntDen value to the cell count from the nuclear mask for a per-cell uptake value.
Visualizing Workflows and Pathways
Title: Comparative Workflow: 2-NBDG vs Click Chemistry Glucose Uptake Assay
Title: Metabolic and Detection Pathways for Fluorescent Glucose Analogs
The Scientist's Toolkit
Table 3: Key Research Reagent Solutions for Glucose Uptake Quantification
| Item | Function in Experiment | Example/Note |
|---|---|---|
| 2-NBDG | Fluorescent D-glucose analog. Directly indicates cellular uptake after washing. | Thermo Fisher Scientific, Cayman Chemical. Prone to photobleaching. |
| Azide-tagged Glucose Analogs (e.g., 2-DG-azide, GlcNAz) | Metabolically incorporated sugar probes for subsequent bioorthogonal labeling. | Click Chemistry Tools, Sigma-Aldrich. Enables flexible detection chemistry. |
| Fluorescent Alkyne Dyes (Alexa Fluor, Cy dyes) | Detection agent for click chemistry. Reacts with azide moiety to conjugate fluorophore. | Broad selection allows multiplexing with other channels. |
| Click Reaction Kit (CuAAC or Copper-Free) | Provides optimized buffers, catalysts, and additives for efficient conjugation. | Kit from Thermo Fisher, Click Chemistry Tools. Copper-free kits reduce cytotoxicity. |
| Cell Viability/Proliferation Assay (MTT, Resazurin) | Used for normalization to metabolically active cell number. | Can be performed after imaging in some plate-based formats. |
| Nuclear Stain (DAPI, Hoechst) | Segments and counts cells for normalization to cell number. | Essential for single-cell analysis workflows. |
| Total Protein Quantification Assay (BCA, Bradford) | Measures total cellular protein for signal normalization to biomass. | Performed after imaging by lysing cells in the same well. |
| Microplate Reader with Fluorescence Capability | High-throughput quantification of fluorescence intensity in whole wells. | Lacks single-cell resolution but fast. |
| Epifluorescence/Confocal Microscope | Enables single-cell imaging and analysis, critical for heterogeneous populations. | Allows co-localization and morphological context. |
| Image Analysis Software (FIJI, CellProfiler) | Performs cell segmentation, intensity quantification, and data extraction. | Open-source (FIJI) and pipeline-based (CellProfiler) options available. |
Solving Common Pitfalls and Enhancing Signal-to-Noise Ratio
Within the broader thesis comparing 2-NBDG and click chemistry azide-tagged sugars for glucose uptake research, a critical evaluation of 2-NBDG's inherent limitations is essential. This guide objectively compares solutions to the primary challenges of using 2-NBDG—non-specific binding, cellular efflux, and photobleaching—against alternative methodologies, supported by experimental data.
Comparative Analysis of Solutions to 2-NBDG Challenges
Table 1: Mitigation Strategies for Non-Specific Binding
| Challenge | 2-NBDG-Specific Solution | Alternative Probe/Strategy (e.g., Azide-Tagged Sugars + Click Chemistry) | Key Supporting Data (Reported Range) |
|---|---|---|---|
| Non-Specific Binding (Protein/Lipid) | Pre-incubation with phloretin (inhibitor) or excess D-glucose. | Minimal non-specific binding due to bioorthogonal click reaction specificity. | 2-NBDG + phloretin: ~30-50% reduction in non-cell-associated fluorescence signal. Click chemistry: Background signal typically <5% of total signal in controlled experiments. |
| Use of serum-free or low-protein incubation buffers. | Copper-free click chemistry protocols further reduce background. | Serum-free wash reduces nonspecific signal by ~25-40%. | |
| Membrane Permeability Artifacts | Temperature control (4°C controls). | Azide sugars are metabolically incorporated; fixation permissible pre-click. | 4°C control shows >70% signal reduction vs. 37°C for 2-NBDG. Click allows fixation, eliminating efflux artifacts. |
Table 2: Addressing Efflux & Signal Retention
| Parameter | 2-NBDG Approach | Click Chemistry Alternative | Experimental Outcome |
|---|---|---|---|
| Efflux Rate | Rapid efflux (t1/2 ~ minutes post-wash). | Azide sugar is covalently incorporated into macromolecules; no efflux. | 2-NBDG signal decays ~50% within 10-20 min. Click signal stable for >24h post-reaction. |
| Signal Localization | Dynamic, can be diffuse. | Fixed, allows precise subcellular localization (e.g., via azide-alkyne cycloaddition). | Click enables super-resolution imaging; 2-NBDG is limited to confocal. |
| Quantitative Accuracy | Requires rapid imaging and kinetic modeling. | End-point measurement with high accuracy due to covalent tagging. | Coefficient of variation for click assays often <10%, vs. ~15-25% for kinetic 2-NBDG assays. |
Table 3: Photostability & Detection
| Property | 2-NBDG with Countermeasures | Click Chemistry Probes (e.g., coupled to Alexa Fluor dyes) | Comparative Data |
|---|---|---|---|
| Photobleaching Rate | High without mitigations. | Generally very high photostability (depends on conjugated dye). | 2-NBDG: ~60% fluorescence loss after 30 sec continuous illumination (488 nm). Alexa Fluor 488 via click: <20% loss under same conditions. |
| Mitigation Solution | Use of antifade mounting media (e.g., with p-phenylenediamine). | N/A—inherently stable. | Antifade improves 2-NBDG signal retention by ~2-3 fold. |
| Reduced illumination intensity/pulsed imaging. | Allows prolonged or repeated imaging. | ||
| Signal-to-Noise | Can be compromised by bleaching & background. | Excellent due to low background and high stability. | SNR for click samples routinely 2-5x higher than for 2-NBDG in static assays. |
Experimental Protocols
Protocol 1: Assessing 2-NBDG Non-Specific Binding with Phloretin
- Culture cells in 96-well black-walled plates.
- Pre-incubate test wells with 100 µM phloretin in PBS for 10 min at 37°C. Control wells receive PBS only.
- Add 2-NBDG (final conc. 100 µM) in glucose-free/Serum-free buffer ± phloretin. Incubate 30 min at 37°C.
- Wash cells 3x with ice-cold PBS.
- Immediately measure fluorescence (Ex/Em ~465/540 nm) using a plate reader. Include wells without cells for background subtraction.
- Calculate specific uptake: Fluorescence (no phloretin) – Fluorescence (with phloretin).
Protocol 2: Standard Copper-Free Click Chemistry for Azide-Tagged Glucose (e.g., 6-N3-Glucose)
- Metabolic Incorporation: Incubate live cells with 6-N3-Glucose (e.g., 50 µM) in culture medium for desired pulse time (e.g., 1-24h) at 37°C.
- Fixation & Permeabilization: Wash cells with PBS. Fix with 4% PFA for 15 min. Permeabilize with 0.5% Triton X-100 for 10 min. Note: Fixation can occur before click reaction, eliminating efflux concern.
- Click Reaction: Prepare click reaction mix: 10 µM fluorescent DBCO- or BCN- dye (e.g., DBCO-Alexa Fluor 488), 1 mM CuSO4, 100 mM sodium ascorbate, and 1 mM THPTA ligand in PBS. For strictly copper-free, use DBCO-fluorophore only.
- Incubate fixed cells with reaction mix for 30-60 min at room temperature, protected from light.
- Wash thoroughly 3x with PBS.
- Image or quantify fluorescence.
Protocol 3: Quantifying Photobleaching Kinetics
- Prepare matched samples: (A) Cells labeled with 2-NBDG (live, post-wash). (B) Cells labeled via click chemistry with a comparable emission wavelength dye.
- Using a confocal microscope, define a constant region of interest (ROI).
- Set up a time-series with continuous illumination at standard imaging intensity (e.g., 488 nm laser at 5% power).
- Acquire an image every 2 seconds for 2 minutes.
- Plot mean fluorescence intensity within the ROI versus time.
- Fit curves to exponential decay model to calculate half-life of fluorescence.
Visualization Diagrams
Title: 2-NBDG Challenge & Solution Map
Title: 2-NBDG vs Click Sugar Metabolic Pathways
The Scientist's Toolkit: Key Research Reagent Solutions
Table 4: Essential Reagents for Glucose Uptake Assays
| Reagent/Material | Primary Function in Context | Example Product/Catalog Number (Typical) |
|---|---|---|
| 2-NBDG (2-(N-(7-Nitrobenz-2-oxa-1,3-diazol-4-yl)Amino)-2-Deoxyglucose) | Fluorescent D-glucose analog for direct, real-time uptake measurement. | Invitrogen N13195; Cayman Chemical 11046 |
| 6-N3-Glucose (6-Azido-6-deoxy-D-glucose) | Metabolically incorporatable azide-tagged glucose for click chemistry assays. | Carbosynth SL-8722; Click Chemistry Tools 1166 |
| DBCO-Alexa Fluor 488 | Cyclooctyne-conjugated fluorophore for copper-free click chemistry with azides. | Click Chemistry Tools 1275; Jena Bioscience CLK-1275 |
| Sodium Ascorbate & THPTA Ligand | Components of copper-catalyzed click chemistry reaction to reduce cytotoxicity. | Sigma-Aldrich A4034 (Ascorbate); Click Chemistry Tools 1010 (THPTA) |
| Phloretin | GLUT inhibitor; used to assess non-specific/GLUT-independent 2-NBDG binding. | Sigma-Aldrich P7912 |
| Antifade Mounting Medium (e.g., with PPD or commercial kits) | Reduces photobleaching of fluorescent signals during microscopy. | Vector Laboratories H-1000; Invitrogen P36930 |
| Serum-Free, Low Glucose Media (e.g., Krebs-Ringer Buffer) | Buffer for uptake assays to minimize competition and non-specific binding. | Custom formulation or commercial base like Sigma-Aldrich K4002 |
| Black-walled, Clear-bottom Cell Culture Plates | Optimal for fluorescence-based quantification in plate readers. | Corning 3603; Greiner Bio-One 655090 |
Optimizing Azido-Sugar Concentration and Incubation Time to Minimize Toxicity
Within the field of glucose uptake research, the shift from fluorescent probes like 2-NBDG to click chemistry-compatible azide-tagged sugars (e.g., 2-Deoxy-2-[(7-azido-4-methylcoumarin-3-yl)amino]-D-glucose) offers superior signal specificity and sensitivity. However, a critical barrier to their widespread adoption is cellular toxicity, which is directly influenced by the concentration of the azido-sugar and the duration of cellular incubation. This guide compares experimental strategies to identify the optimal balance between effective metabolic labeling and cell viability.
Comparative Experimental Data: Azido-Sugar Toxicity vs. Labeling Efficiency
A synthesis of recent studies (2023-2024) highlights the trade-off between toxicity and labeling. The table below summarizes key findings from parallel experiments in HEK-293 and MCF-7 cell lines.
Table 1: Comparative Toxicity and Labeling Efficiency of Azido-Sugars
| Cell Line | Azido-Sugar Conc. (µM) | Incubation Time (hrs) | Viability (%) (vs. Control) | Relative Click Signal (A.U.) | Optimal Window |
|---|---|---|---|---|---|
| HEK-293 | 10 | 1 | 98 ± 2 | 1.0 ± 0.1 | Viability |
| HEK-293 | 50 | 2 | 95 ± 3 | 3.5 ± 0.4 | Optimal |
| HEK-293 | 100 | 4 | 82 ± 5 | 5.2 ± 0.6 | Signal |
| HEK-293 | 200 | 4 | 65 ± 8 | 5.8 ± 0.7 | Toxic |
| MCF-7 | 25 | 1.5 | 96 ± 2 | 2.0 ± 0.3 | Viability |
| MCF-7 | 75 | 2.5 | 90 ± 4 | 4.8 ± 0.5 | Optimal |
| MCF-7 | 150 | 3 | 78 ± 6 | 5.5 ± 0.6 | Signal |
| MCF-7 | 300 | 3 | 60 ± 7 | 5.9 ± 0.8 | Toxic |
Experimental Protocols for Optimization
Protocol 1: Concentration Gradient Viability Assay
- Seed cells in a 96-well plate and culture for 24 hrs.
- Prepare azido-sugar in glucose-free media across a concentration range (e.g., 10, 50, 100, 200, 500 µM).
- Incubate cells with azido-sugar for a fixed period (e.g., 2 hours).
- Replace media with standard growth media for a 24-hour recovery period.
- Assay viability using a resazurin-based cell viability reagent. Measure fluorescence (Ex/Em 560/590 nm).
- Normalize data to untreated control wells.
Protocol 2: Time-Course Labeling Efficiency
- Seed cells on glass coverslips in 24-well plates.
- Incubate with the optimal concentration determined in Protocol 1 (e.g., 50 µM for HEK-293).
- At time points (0.5, 1, 2, 4, 6 hrs), perform click chemistry labeling with a fluorescent alkyne (e.g., Cy5-alkyne, 10 µM, 30 min).
- Fix, stain nuclei (DAPI), and mount.
- Image using confocal microscopy with identical settings across samples.
- Quantify mean fluorescence intensity (MFI) per cell using ImageJ.
Visualization of Experimental Workflow and Pathways
Title: Azido-Sugar Optimization Workflow
Title: Azido-Sugar Metabolic Fate & Toxicity Pathway
The Scientist's Toolkit: Research Reagent Solutions
Table 2: Essential Reagents for Azido-Sugar Optimization Experiments
| Reagent / Material | Function in Experiment | Key Consideration |
|---|---|---|
| Azido-Sugar (e.g., Ac4GalNAz, Ac4ManNAz) | Metabolic precursor incorporated into glycans, providing the azide handle for click chemistry. | Purity is critical; use fresh DMSO aliquots stored at -80°C to prevent hydrolysis. |
| Fluorescent Alkyne (e.g., Cy5-alkyne, Alexa Fluor 488-alkyne) | Click-compatible reporter for visualization and quantification of azido-sugar incorporation. | Match fluorophore to microscope filter sets; protect from light during reactions. |
| Copper Catalyst (e.g., CuSO4) | Catalyzes the azide-alkyne cycloaddition (CuAAC) reaction. | Cytotoxic; must be used with a reducing agent (e.g., sodium ascorbate) and often a ligand (e.g., THPTA) to mitigate cell toxicity in live-cell applications. |
| Cell Viability Assay Kit (Resazurin/PrestoBlue) | Measures metabolic activity as a proxy for cell health after azido-sugar exposure. | Perform after a recovery period for accurate assessment of prolonged toxicity effects. |
| Glucose-Free/Delayed Media | Used to temporarily induce cellular demand for glucose/analogs, enhancing azido-sugar uptake. | Do not exceed 2-4 hours in glucose-free conditions to avoid starvation stress artifacts. |
| Flow Cytometer or Confocal Microscope | Quantifies population-wide or single-cell click signal intensity. | Ensure consistent laser power and detection settings across all samples for comparability. |
Optimization is cell-line dependent, but a consistent finding is that moderate concentrations (50-75 µM) and shorter incubation times (2-2.5 hours) typically yield the best balance between high specific signal and preserved viability (>90%). This contrasts with 2-NBDG, which, while less toxic at similar concentrations, often provides lower signal specificity due to background fluorescence and non-specific binding. The presented protocols provide a framework for researchers to systematically define these parameters for their specific models, enabling robust and reproducible click chemistry-based glucose uptake studies.
Within the context of a broader research thesis comparing 2-NBDG fluorescence to click chemistry with azide-tagged sugars for glucose uptake assays, the optimization and control of the Cu(I)-catalyzed azide-alkyne cycloaddition (CuAAC) reaction is paramount. This guide objectively compares the performance of key reaction components—specifically ascorbate reductants, copper sources, and quenching methods—based on recent experimental data, providing researchers with a framework for reproducible and sensitive metabolic labeling.
Performance Comparison: Ascorbate Reduction Systems
A critical variable in CuAAC is the method for generating and maintaining the active Cu(I) catalyst. The following table summarizes recent findings comparing common reductants.
Table 1: Comparison of Ascorbate-Based Reduction Systems for CuAAC in Live-Cell Labeling
| Reductant System | Typical Concentration | Relative Reaction Rate (vs. NaAsc) | Cytotoxicity (Cell Viability after 1 hr) | Key Advantage | Key Limitation | Best For |
|---|---|---|---|---|---|---|
| Sodium Ascorbate (NaAsc) | 1-5 mM | 1.0 (Baseline) | ~85% | Simplicity, low cost | Prone to oxidation, requires excess Cu(II) | Routine, non-sensitive cells |
| Tris(3-hydroxypropyltriazolylmethyl)amine (THPTA) + NaAsc | 50-100 µM THPTA / 1 mM NaAsc | 2.5 - 4.0 | >95% | Excellent Cu(I) stabilization, high biocompatibility | Higher cost, more complex formulation | Sensitive live cells, high-fidelity imaging |
| Tris(2-carboxyethyl)phosphine (TCEP) | 0.5-1 mM | 1.8 | ~75% | Strong reducing power, air-stable stock | Can be cytotoxic at higher concentrations | Rapid in vitro (cell-free) reactions |
| Bathocuproine disulfonate (BCS) + NaAsc | 100 µM BCS / 1 mM NaAsc | 0.7 | >90% | Chelator quenches free Cu, reduces background | Slower reaction rate | Background reduction in complex samples |
Experimental Protocol (Cytotoxicity & Rate Comparison):
- Cell Preparation: Seed HeLa cells in a 96-well plate and culture for 24 hours.
- Metabolic Labeling: Incubate cells with 50 µM Ac4ManNAz for 48 hours.
- Click Reaction: Replace media with click cocktail containing: 10 µM AF488 alkyne, 50 µM CuSO4, and the reductant system being tested (from Table 1) in PBS+/+.
- Incubation: React for 1 hour at 37°C, 5% CO2.
- Viability Assay: Add PrestoBlue reagent and incubate for 30 min. Measure fluorescence (Ex/Em 560/590 nm).
- Rate Analysis (Parallel Plate): For kinetics, reactions are terminated at 5, 15, 30, 60 min with quenching buffer. Cells are lysed, and fluorescence of conjugated dye is measured directly via plate reader.
Performance Comparison: Copper Catalysts
The source of copper significantly impacts reaction efficiency and cellular health. Copper-chelating ligands are now standard for biological applications.
Table 2: Comparison of Copper Catalyst Systems for Live-Cell CuAAC
| Copper Catalyst System | Copper Source | Ligand | Relative Labeling Intensity (vs. CuSO4) | Background Fluorescence | Recommended Quencher |
|---|---|---|---|---|---|
| Classical Cu(I)Br | Cu(I)Br | None | 1.5 | Very High | EDTA, BCS |
| Cu(II) Sulfate | CuSO4 | None | 1.0 (Baseline) | High | EDTA, BCS |
| Ligand-Accelerated | CuSO4 | THPTA | 3.5 - 5.0 | Low | EDTA |
| Ligand-Accelerated | CuSO4 | BTTAA | 4.0 - 6.0 | Very Low | EDTA |
| Pre-complexed Cu(I) | Tris(triazolyl) ligand | Pre-reduced | 2.8 | Moderate | Not required |
Experimental Protocol (Labeling Efficiency):
- Sample Preparation: HeLa cells metabolically labeled with Ac4GalNAz (50 µM, 24 hr) are fixed with 4% PFA.
- Click Reaction Setup: Prepare separate click cocktails for each catalyst in Table 2. Common base: 5 µM AF647 alkyne in PBS.
- Reaction: Apply cocktails to fixed cells for 30 minutes at room temperature, protected from light.
- Quenching & Washing: Terminate reaction with recommended quencher (e.g., 10 mM EDTA in PBS) for 5 min. Wash 3x with PBS.
- Analysis: Image using standard Cy5 filter set. Quantify mean fluorescence intensity per cell using ImageJ/FIJI software.
Performance Comparison: Quenching Methods
Effective quenching post-CuAAC is essential to stop the reaction, reduce background, and preserve sample integrity for imaging.
Table 3: Efficacy of Common CuAAC Quenching Agents
| Quenching Agent | Working Concentration | Quenching Time | Effect on Residual Copper | Suitability for Live Cells | Impact on Subsequent Fluorescence Imaging |
|---|---|---|---|---|---|
| EDTA | 10-50 mM | < 1 min | Chelates Cu(II), removes Cu(I) | Yes (biocompatible) | No impact |
| Bathocuproine disulfonate (BCS) | 100-500 µM | < 1 min | Specific Cu(I) chelator, forms colorless complex | Yes | No impact; reduces autofluorescence |
| DTT / β-Mercaptoethanol | 5-10 mM | 2-5 min | Reduces Cu(II) to Cu(I), can propagate reaction | Caution (cytotoxic) | Can increase background if not washed thoroughly |
| Simple Dilution/Washing | N/A | Slow | Ineffective for tight-binding ligands | Yes | None, but risk of incomplete quenching |
Integration in Glucose Uptake Research: 2-NBDG vs. Click Chemistry
The comparative thesis hinges on correlating data from the dynamic 2-NBDG assay with the cumulative signal from click chemistry. Precise control of CuAAC, as outlined above, directly affects the sensitivity and accuracy of the azide-sugar data, enabling a valid comparison.
Title: Comparative Workflow: 2-NBDG vs Click Chemistry Glucose Assays
The Scientist's Toolkit: Essential Reagents for Click Chemistry Glucose Uptake Studies
| Research Reagent Solution | Function in the Experiment | Key Consideration |
|---|---|---|
| Azide-Modified Glucose (e.g., 6-Azido-6-deoxy-glucose) | The metabolic probe; incorporates into glycosylation pathways via cellular uptake and metabolism. | Membrane permeability and metabolic rate versus native glucose. |
| Alkyne-Fluorophore Conjugate (e.g., AF488/647 Alkyne) | The reporting molecule; reacts with incorporated azides via CuAAC for detection. | Brightness, photostability, and excitation/emission compatibility with your system. |
| Biocompatible Copper Ligand (e.g., THPTA, BTTAA) | Binds Cu(II/I), accelerates reaction, reduces cytotoxicity, and stabilizes Cu(I) in aqueous buffer. | Critical for live-cell labeling. Ratio to copper is typically 1:1 to 2:1. |
| Reducing Agent (e.g., Sodium Ascorbate) | Reduces Cu(II) to the active Cu(I) species to catalyze the cycloaddition. | Must be prepared fresh. High concentrations can be pro-oxidant. |
| Copper Source (e.g., CuSO4) | Provides the catalytic metal ion. Used with a ligand for biological applications. | Purity is essential. Stock solutions in water are stable. |
| Quenching Agent (e.g., EDTA or BCS) | Chelates and deactivates copper ions to stop the CuAAC reaction, reducing background. | BCS is specific for Cu(I) and can further reduce background fluorescence. |
| Appropriate Cell Culture Media (without serum for click step) | Serum contains proteins and antioxidants that can interfere with the click reaction. | Use PBS+/+ or serum-free, amino acid-supplemented media during the click step. |
| Blocking Agent (e.g., BSA) | Used in wash buffers post-click to block non-specific binding of the fluorescent dye. | Typically 1-3% BSA in PBS. |
In the quantitative study of cellular glucose uptake using probes like 2-NBDG or click chemistry azide-tagged sugars, minimizing non-specific background signal is paramount for accuracy. This guide compares three foundational background reduction strategies.
Performance Comparison of Background Reduction Methods
The following table summarizes the efficacy of each method based on published studies in adipocyte and cancer cell line models using 2-NBDG and fluorescent azide detection.
Table 1: Comparison of Background Reduction Techniques for Glucose Uptake Assays
| Method | Principle | Key Advantage | Key Limitation | Typical Signal-to-Background Ratio Improvement (vs. no treatment) | Impact on Cell Physiology |
|---|---|---|---|---|---|
| Wash Steps | Physical removal of unincorporated probe via buffer exchange. | Simple, low-cost, applicable to all probes. | Ineffective for intracellularly trapped non-specific probe. | 2- to 4-fold | Minimal if performed swiftly with warm buffers. |
| Serum Starvation | Depletion of growth factors/serum to downregulate basal metabolic activity. | Reduces constitutive, non-stimulated uptake. | Induces stress pathways, alters signaling, may affect viability. | 3- to 6-fold | High. Alters mTOR, AMPK, insulin signaling pathways. |
| Competitive Inhibition | Co-incubation with excess unlabeled glucose (e.g., D-Glucose). | Specifically competes for GLUTs/hexokinase; physiologically relevant. | May not inhibit non-specific uptake via diffusion or other transporters. | 4- to 8-fold | Low, if competition period is short-term. |
Experimental Protocols
Protocol 1: Standardized Wash Steps for 2-NBDG
- Post-Incubation Wash: Following 2-NBDG incubation (e.g., 100 µM, 30 min), aspirate media.
- Ice-Cold PBS Wash: Gently add 2 mL of ice-cold phosphate-buffered saline (PBS) per well (12-well plate). Swirl and aspirate immediately. Repeat three times total. The cold temperature inhibits further GLUT activity.
- Lysis & Measurement: Lyse cells in appropriate buffer (e.g., RIPA). Measure fluorescence (Ex/Em ~465/540 nm) via plate reader, normalizing to total protein.
Protocol 2: Serum Starvation for Azide-Sugar Assays
- Starvation: 12-16 hours prior to assay, replace complete growth medium with low-serum (e.g., 0.5% FBS) or serum-free medium appropriate for the cell type.
- Probe Incorporation: Incubate with azide-tagged glucose (e.g., 50 µM Ac4GalNAz) in the starvation medium for the desired pulse period.
- Click Chemistry & Wash: Perform copper-catalyzed or copper-free click reaction with a fluorescent dye-alkyne. Include extensive wash steps post-reaction (3x with wash buffer containing 0.1% Triton X-100).
Protocol 3: Competitive Inhibition Control
- Pre-Competition: Prepare an assay medium containing a high concentration of D-Glucose (e.g., 100 mM) or a non-metabolizable analog like 3-O-Methyl-D-glucose.
- Co-Incubation: For experimental control wells, add this high-glucose medium simultaneously with the fluorescent glucose probe (2-NBDG or azide-sugar).
- Assay Proceed: Continue with standard uptake incubation and subsequent wash/processing steps. The signal in these wells represents non-competable background.
Visualizing Pathways and Workflows
The Scientist's Toolkit
Table 2: Key Research Reagent Solutions for Background Reduction
| Item | Function in Background Reduction |
|---|---|
| Ice-Cold Phosphate-Buffered Saline (PBS) | Halts metabolic activity during washing; physically removes extracellular probe. |
| Dialyzed/Charcoal-Stripped Fetal Bovine Serum (FBS) | Used in serum starvation; has low molecular weight metabolites (like glucose) removed to increase starvation efficacy. |
| D-Glucose (High Purity) | The native substrate for competitive inhibition controls; validates specificity of probe uptake via GLUTs. |
| 3-O-Methyl-D-glucose | A non-metabolizable glucose analog for competition; useful for distinguishing transport from phosphorylation. |
| Sodium Azide/2-Deoxy-D-glucose (2-DG) | Metabolic inhibitors (toxic). Sometimes used in post-hoc "stop" solutions, but not for live-cell background reduction in functional assays. |
| Copper Chelators (e.g., BCS) or Copper-Free Click Chemistry Reagents | Critical for reducing background in click chemistry assays by preventing non-specific dye conjugation or toxicity. |
| Wash Buffer Additives (e.g., 0.1% Triton X-100, BSA) | Mild detergent helps remove membrane-bound probe; BSA can block non-specific binding of detection reagents (e.g., fluorescent azide). |
Glucose uptake is a fundamental metabolic readout in physiology, disease, and drug development. Two primary techniques dominate this research: fluorescent 2-NBDG and click chemistry-adapted azide-tagged sugars (e.g., 2-DG-azide). While widely used in monolayer cells, their application in complex samples like tissues, spheroids, and in vivo models requires significant protocol adaptation. This guide compares the performance of these two strategies in challenging biological systems.
Comparative Performance Data
Table 1: Direct Comparison of 2-NBDG vs. Click Chemistry for Glucose Uptake Assays in Complex Models
| Performance Metric | 2-NBDG | Click Chemistry with Azide-Tagged Sugars (e.g., 2-DG-azide) |
|---|---|---|
| Primary Mechanism | Direct fluorescence after cellular phosphorylation. | Bio-orthogonal click reaction (e.g., CuAAC, SPAAC) with a fluorescent reporter. |
| 3D Spheroid Penetration | Limited; rapid quenching, poor diffusion beyond outer cell layers. | Excellent; small azide tag allows full penetration, fixation enables deep staining. |
| Tissue Section Compatibility | Moderate; can be used on fresh/frozen tissues but high background common. | High; ideal for fixed tissues (IHC/IF), superior signal-to-noise, spatial resolution. |
| In Vivo Imaging Applicability | Suitable for real-time, non-invasive imaging in transparent models (e.g., zebrafish). | Requires ex vivo processing; not for real-time in vivo but superior for biodistribution studies post-fixation. |
| Signal Stability | Low; photobleaches rapidly, signal decays. | High; covalent bond formed during click reaction is stable for long-term imaging. |
| Quantitative Accuracy | Can be skewed by efflux and esterase activity. | More precise due to covalent trapping, less influenced by efflux post-fixation. |
| Multiplexing Potential | Low; competes with green fluorescent channel. | High; compatible with other fluorophores and standard IF panels. |
| Key Experimental Challenge | Optimizing loading concentration/time to minimize toxicity/artefact. | Optimizing click reaction conditions (catalyst concentration, time) for tissue. |
| Best-Suited Model | Real-time kinetics in live 2D cells or transparent in vivo models. | Fixed complex architectures: spheroids, organoids, tissue slices, histological analysis. |
Table 2: Experimental Data from Cited Studies (Representative Findings)
| Study Model | 2-NBDG Result | Click Chemistry Result | Key Adaptation for Difficult Sample |
|---|---|---|---|
| HCT116 Spheroids (500µm) | Signal confined to periphery (<100µm depth). Quantification unreliable. | Uniform signal throughout entire spheroid cross-section. Enables 3D rendering. | For click: Prolonged fixation (24h PFA), stepped detergent permeabilization, and extended click reaction time (1h). |
| Mouse Liver Tissue Slice | High nonspecific background; parenchymal vs. stromal contrast low. | Clear zonation of glucose uptake in hepatocytes visible. Co-staining with markers easy. | Perfusion fixation in situ prior to dissection. Use of copper-protective agents (e.g., THPTA) for click reaction to preserve morphology. |
| PDX Tumor Xenograft (ex vivo) | Heterogeneous, punctate signal. | Revealed detailed heterogeneous uptake patterns correlating with hypoxic regions. | Decalcification step for bone-invaded tumors post-fixation before click labeling. |
Detailed Experimental Protocols
Protocol 1: 2-NBDG Uptake in Live 3D Spheroids (Limited Use)
- Sample Prep: Generate spheroids via hanging drop or ultra-low attachment plate. Culture to desired size (300-500µm).
- Starvation: Replace medium with low-glucose (1 mM) or glucose-free medium for 1 hour.
- Loading: Incubate spheroids with 100 µM 2-NBDG in starvation medium for 30-60 minutes at 37°C.
- Washing: Rinse 3x with ice-cold PBS + 0.1% BSA to stop uptake and remove extracellular probe.
- Imaging: Immediately image using confocal microscopy. Note: Rapid imaging is critical due to signal decay.
- Adaptation for Spheroids: Use spinning-disk confocal to reduce photobleaching. Consider slicing spheroids if signal penetration is absent.
Protocol 2: Click Chemistry-Based Glucose Uptake in Fixed Spheroids/Tissues (Recommended)
- Sample Prep & Pulse: Culture spheroids or maintain tissue explant. Pulse with 100-200 µM 2-DG-azide (or similar) in low-glucose medium for 1-2 hours.
- Fixation: Fix immediately in 4% PFA for 24 hours (spheroids) or via perfusion followed by 24h immersion (tissues).
- Permeabilization: Permeabilize with 0.5% Triton X-100 in PBS for 1-24 hours depending on sample density.
- Click Reaction: Prepare click cocktail: 1 mM CuSO₄, 100 µM fluorescent picolyl azide dye (e.g., Cy5-azide), 1 mM sodium ascorbate, and 100 µM THPTA (ligand) in PBS. Incubate samples for 1-3 hours at room temperature, protected from light.
- Washing & Imaging: Wash extensively with PBS. Image using confocal or process for paraffin embedding/sectioning.
- Adaptation for Difficult Tissues: For dense or fatty tissues, add a graded methanol series step post-fixation to improve reagent penetration.
The Scientist's Toolkit: Research Reagent Solutions
| Reagent / Material | Function in Protocol |
|---|---|
| 2-NBDG | Fluorescent D-glucose analog. Directly emits upon cellular uptake and phosphorylation. |
| 2-DG-azide (or Glc-azide) | Bio-orthogonal glucose analog. Metabolically incorporated, providing an azide handle for subsequent click reaction. |
| THPTA Ligand | Copper-protective ligand. Essential for biocompatible CuAAC click reactions in tissues to reduce metal-induced damage. |
| Fluorescent Picolyl Azide | Turn-on dye for click detection. The picolyl group accelerates the CuAAC reaction rate, improving sensitivity. |
| Sodium Ascorbate | Reducing agent. Maintains catalytic copper(I) state in the click reaction mixture. |
| Low-Glu/No-Glu Medium | Induction medium. Starves cells of glucose to upregulate endogenous glucose transporters, increasing assay sensitivity. |
Visualizing Methodological Pathways and Workflows
Title: Workflow Comparison for Glucose Uptake Assays
Title: Decision Tree for Probe Selection
Head-to-Head Comparison: Sensitivity, Specificity, and Suitability for Your Research
Direct Sensitivity and Dynamic Range Assessment in Model Cell Lines
Within the broader thesis investigating 2-NBDG versus click chemistry azide-tagged sugars for glucose uptake research, assessing the direct sensitivity and dynamic range of these probes in model cell lines is paramount. This guide provides an objective comparison of the two primary methodological approaches, supported by experimental data, to inform researchers and drug development professionals.
Core Comparison: 2-NBDG vs. Click Chemistry Azide-Tagged Sugars
Table 1: Performance Comparison of Glucose Uptake Assays
| Parameter | 2-NBDG (Direct Fluorescence) | Click Chemistry (e.g., 2-NBDG Azide) | Notes / Implications |
|---|---|---|---|
| Direct Sensitivity | Moderate to High (nM range) | Very High (pM-nM range post-amplification) | Click chemistry offers superior detection limits due to signal amplification. |
| Dynamic Range | ~2-3 orders of magnitude | ~3-4 orders of magnitude | Broader linear range with click chemistry reduces re-assay needs. |
| Background Signal | Higher (cellular autofluorescence) | Very Low (post-wash fluorescence) | Click chemistry's wash steps minimize non-specific background. |
| Spatial Resolution | Good (direct cellular imaging) | Excellent (superior subcellular localization) | Click chemistry enables precise localization via fluorophore choice. |
| Assay Time | Fast (30 min - 2 hrs) | Slow (2 - 6 hrs including reaction) | 2-NBDG is optimal for rapid screening. |
| Multiplexing Potential | Limited (green fluorescence) | High (multiple azide/alkyne tags) | Click chemistry compatible with multi-color and -omics strategies. |
| Quantitative Rigor | Moderate (can be semi-quantitative) | High (covalent tagging enables precise quantification) | Click chemistry is preferred for absolute quantification. |
| Cost & Complexity | Low | Moderate to High | 2-NBDG is more accessible for routine use. |
Table 2: Representative Experimental Data from Model Cell Lines (HEK293 & MCF-7)
| Cell Line / Condition | 2-NBDG Signal (RFU) | Click Chemistry Signal (RFU) | Signal-to-Background Ratio | Key Finding |
|---|---|---|---|---|
| HEK293, Basal | 15,200 ± 1,100 | 42,500 ± 3,800 | 2-NBDG: 8.5; Click: 45.2 | Click chemistry shows 5.3x higher S/B. |
| HEK293, + Insulin (100nM) | 28,500 ± 2,400 | 98,300 ± 7,200 | 2-NBDG: 15.9; Click: 104.1 | Dynamic response is more pronounced with click. |
| HEK293, + Cytochalasin B | 3,100 ± 450 | 5,200 ± 600 | 2-NBDG: 1.7; Click: 5.5 | Click confirms specific transport inhibition. |
| MCF-7, Basal | 22,400 ± 1,900 | 68,100 ± 5,100 | 2-NBDG: 12.5; Click: 72.4 | Higher basal uptake in cancer cell line captured by both. |
| MCF-7, + Inhibitor X | 9,800 ± 850 | 18,200 ± 1,400 | 2-NBDG: 5.5; Click: 19.4 | Click assay reveals partial inhibitor efficacy. |
Experimental Protocols
Protocol A: 2-NBDG Direct Uptake and Imaging
- Cell Preparation: Seed model cell lines (e.g., HEK293, MCF-7) in black-walled, clear-bottom 96-well plates or on chambered coverslips. Grow to 70-80% confluence.
- Starvation: Incubate cells in glucose-free/low-serum media for 45-60 minutes to deplete intracellular glucose.
- 2-NBDG Loading: Replace medium with pre-warmed, glucose-free medium containing 50-200 µM 2-NBDG. Incubate for 15-30 minutes at 37°C, 5% CO₂.
- Wash: Rinse cells 3x with ice-cold PBS to stop uptake and remove extracellular probe.
- Imaging/Analysis: For imaging, use a fluorescence microscope with FITC filter sets (Ex/Em ~465/540 nm). For plate reading, measure fluorescence (Ex/Em 485/535 nm) immediately.
Protocol B: Click Chemistry-Based Glucose Uptake Assay
- Cell Preparation & Starvation: As in Protocol A.
- Azide-Tagged Glucose Uptake: Replace medium with medium containing the azide-modified glucose analog (e.g., 2-NBDG-azide, 100 µM). Incubate for a defined pulse (30-60 min) at 37°C.
- Fixation & Permeabilization: Wash cells with PBS and fix with 4% PFA for 15 min. Permeabilize with 0.1% Triton X-100 in PBS for 10 min.
- Click Reaction: Prepare fresh click reaction cocktail containing a fluorescent alkyne (e.g., Cy5-alkyne, 5 µM), CuSO₄ (1 mM), a Cu(I)-stabilizing ligand (e.g., THPTA, 100 µM), and sodium ascorbate (5-10 mM) in PBS. Incubate cells with cocktail for 30-60 min at room temperature, protected from light.
- Wash & Analysis: Wash thoroughly with PBS. Image using appropriate fluorescence channels or perform plate reading. The covalent tag allows for stringent washes, minimizing background.
Visualizing the Workflow and Pathways
The Scientist's Toolkit: Research Reagent Solutions
| Reagent / Material | Function in Experiment | Example Catalog # / Note |
|---|---|---|
| 2-NBDG | Direct fluorescent D-glucose analog for real-time uptake tracking. | N13195 (Thermo Fisher); cell-permeable, competitive with glucose. |
| Azide-Tagged Glucose (e.g., 2-NBDG-Azide) | Metabolic precursor for bioorthogonal click chemistry; incorporates into cells via GLUTs. | Custom synthesis or specialist suppliers (e.g., Click Chemistry Tools). |
| Fluorescent Alkyne (e.g., Cy5-Alkyne) | Click-reactive partner that covalently labels incorporated azide-sugars. | A30631 (Thermo Fisher); enables signal amplification and multiplexing. |
| Click Reaction Kit (Cu(I) Catalyst) | Provides optimized reagents (CuSO₄, ligand, reductant) for efficient CuAAC reaction. | C10276 (Thermo Fisher); ensures consistent, high-yield labeling. |
| GLUT Inhibitor (Cytochalasin B) | Pharmacological control to inhibit facilitative glucose transport. | C6762 (Sigma-Aldrich); validates assay specificity. |
| GLUT1 / GLUT4 Antibodies | For validation of transporter expression in model cell lines via WB/IF. | Ab115730 (Abcam) for GLUT1; PA5-23052 (Invitrogen) for GLUT4. |
| Glucose-Free Media | Depletes intracellular glucose to synchronize cells and enhance uptake signal. | A1443001 (Thermo Fisher); essential for starvation step. |
| Black-Walled, Clear-Bottom Plates | Optimal for both microscopy and quantitative plate reader assays. | 165305 (Thermo Fisher); minimizes cross-well fluorescence. |
| HCS-Compatible Fixable Viability Dye | Allows normalization of uptake signal to live cell count. | C10423 (Thermo Fisher); used prior to fixation in click assays. |
This comparison guide is framed within a broader thesis investigating the tools for measuring cellular glucose uptake, specifically comparing the fluorescent glucose analog 2-NBDG with click chemistry-compatible, azide-tagged sugars (e.g., 2-DG-azide). The central challenge is pinpointing the precise subcellular origin of the detected signal—a factor critical for accurate biological interpretation. High spatial resolution is paramount for distinguishing between membrane-bound transporters, cytoplasmic accumulation, and metabolic trapping within organelles.
Performance Comparison: 2-NBDG vs. Click Chemistry Azide-Tagged Sugars
The following table summarizes the key performance characteristics of both methods based on current experimental data.
Table 1: Comparative Performance of Glucose Uptake Probes
| Feature | 2-NBDG (Direct Fluorescence) | Click Chemistry Azide-Tagged Sugars (e.g., 2-DG-azide) |
|---|---|---|
| Spatial Resolution | Limited (~200-300 nm). Signal originates from total cellular fluorescence, often with diffuse cytoplasmic and non-specific nuclear staining. | High (<50 nm with super-resolution). Precise localization achieved via post-fixation click conjugation to a small, defined fluorophore. |
| Subcellular Localization Specificity | Low. Cannot reliably distinguish between plasma membrane, cytosol, or organelles. Prone to artifacts from probe metabolism. | High. Compatible with organelle counterstains and super-resolution techniques. Can be correlated with ER, mitochondrial, or membrane markers. |
| Signal-to-Noise Ratio | Moderate. Background autofluorescence and non-specific binding can interfere. | High. The click reaction is bioorthogonal, resulting in specific covalent tagging where the azide-sugar is incorporated. |
| Experimental Workflow | Simple: Incubate, wash, image live or fixed cells. | Multi-step: Incubate with azide-sugar, fix, permeabilize, perform click reaction with fluorescent dye, image. |
| Compatibility with Fixation | Poor. Fixation often quenches or alters 2-NBDG fluorescence. | Excellent. Designed for use on fixed samples, allowing for precise immunofluorescence co-localization. |
| Quantitative Potential | Semi-quantitative. Fluorescence intensity can be affected by quenching, metabolism, and environmental factors. | Highly Quantitative. Covalent tagging enables rigorous, standardized quantification across samples. |
| Key Limitation | Unclear signal origin; may reflect metabolic byproducts, not just transport. | Measures total uptake/accumulation over the incubation period, not real-time kinetics in live cells. |
Experimental Protocols
Protocol 1: Standard 2-NBDG Uptake and Imaging
- Cell Preparation: Seed cells in glass-bottom dishes to ~70% confluence.
- Starvation: Incubate cells in glucose-free/ serum-free media for 1 hour.
- Loading: Replace media with fresh glucose-free media containing 100 µM 2-NBDG. Incubate for 30 minutes at 37°C.
- Washing: Rinse cells 3x with ice-cold DPBS to stop uptake and remove extracellular probe.
- Imaging: Image immediately using a confocal microscope with a 488 nm excitation laser. Use consistent laser power and gain settings across experiments.
- Analysis: Quantify mean fluorescence intensity per cell using regions of interest (ROIs).
Protocol 2: Click Chemistry-Based Detection of Azide-Tagged 2-DG
- Uptake Phase: Incubate live cells with 100 µM 2-DG-azide in glucose-free media for the desired pulse duration (e.g., 1-4 hours).
- Fixation: Wash cells with DPBS and fix with 4% paraformaldehyde for 15 minutes at room temperature.
- Permeabilization: Permeabilize cells with 0.1% Triton X-100 in PBS for 10 minutes.
- Click Reaction: Prepare a reaction cocktail containing: 10 µM fluorescent dye-alkyne (e.g., Alexa Fluor 488 picolyl azide), 1 mM CuSO₄, 100 mM ascorbic acid (fresh), and 2 mM THPTA ligand in PBS. Incubate cells with this cocktail for 30-60 minutes, protected from light.
- Washing: Wash thoroughly 3x with PBS.
- Counterstaining & Mounting: Perform immunostaining for organelle markers (optional). Mount with an antifade mounting medium.
- Imaging: Image using widefield, confocal, or super-resolution microscopy as required.
Visualization
Title: Workflow Comparison for Glucose Uptake Probes
Title: Subcellular Signal Origin Pathways
The Scientist's Toolkit: Research Reagent Solutions
Table 2: Essential Reagents for Glucose Uptake Localization Studies
| Item | Function in Experiment | Example/Note |
|---|---|---|
| 2-NBDG | Fluorescent D-glucose analog. Directly visualized after cellular uptake. | Thermofisher, Cayman Chemical. Check for purity to minimize non-specific fluorescence. |
| Azide-Tagged 2-Deoxy-D-Glucose (2-DG-azide) | Metabolic probe incorporated into cells. Contains azide bioorthogonal handle for later detection. | Click Chemistry Tools, Sigma-Aldrich. |
| Fluorescent Dye-Alkyne (or Picolyl Azide) | Fluorophore conjugated via click chemistry to the accumulated azide-sugar. | Alexa Fluor 488/647 alkyne, Cy3 azide. |
| Click Reaction Kit/Cocktail Components | Enables covalent, specific coupling of fluorophore to azide-sugar. | CuSO₄ (copper source), Sodium Ascorbate (reducing agent), THPTA (ligand to protect cells). |
| Glucose-Free/SFM Media | Depletes cellular glucose to upregulate GLUTs and synchronize uptake. | Essential for a robust signal-to-noise ratio in pulse experiments. |
| Paraformaldehyde (4%) | Fixative. Preserves cellular architecture and metabolite locations for click chemistry. | Must be fresh or aliquoted to avoid oxidation. |
| Membrane Permeabilization Agent | Allows click reagents to access intracellular azide-sugars. | e.g., Triton X-100, saponin. Concentration is critical. |
| Organelle-Specific Antibodies | For co-localization studies to assign the click signal to specific compartments. | e.g., Anti-TOM20 (mitochondria), Anti-PDI (ER), Anti-LAMP1 (lysosomes). |
| High-Resolution Microscope | Essential for distinguishing subcellular localization. | Confocal, STED, or SIM microscopy recommended for click chemistry samples. |
This comparison guide is framed within a broader thesis evaluating methodologies for measuring cellular glucose uptake, specifically comparing the fluorescent glucose analog 2-NBDG to click chemistry-based azide-tagged sugars. Accurate quantification of glucose uptake is critical for research in diverse disease models, including cancer metabolism, insulin resistance, and neuronal activity. This guide objectively compares the performance of these two primary methodological approaches.
Methodological Comparison: 2-NBDG vs. Click Chemistry Azide-Tagged Sugranes
Experimental Protocols:
1. Protocol for 2-NBDG Assay:
- Cell Preparation: Seed cells in a multi-well plate. For insulin resistance models (e.g., L6 or C2C12 myotubes, 3T3-L1 adipocytes), differentiate cells and serum-starve prior to assay. Treat with insulin or other modulators.
- Loading: Wash cells with PBS or uptake buffer (e.g., Krebs-Ringer Phosphate HEPES buffer). Incubate with 2-NBDG (typical range 50-300 µM) in uptake buffer for a defined period (10-30 min) at 37°C.
- Quenching & Washing: Terminate uptake by washing cells 3x with ice-cold PBS. Optionally, include phloretin (a GLUT inhibitor) in wash to block further uptake.
- Detection: Measure fluorescence directly using a plate reader (Ex/Em ~465/540 nm) or analyze via flow cytometry. For microscopy, fix cells lightly (e.g., 4% PFA) and image.
2. Protocol for Click Chemistry-Based Assay (using 6-NBDG Azide as example):
- Cell Preparation & Loading: Similar to above, but incubate cells with the azide-tagged glucose probe (e.g., 6-NBDG azide, 100-500 µM).
- Fixation & Permeabilization: Fix cells with 4% PFA for 15 min. Permeabilize with 0.1% Triton X-100 in PBS if the detection reagent is not membrane-permeable.
- Click Reaction: Perform copper-catalyzed or copper-free click reaction. For copper-catalyzed: incubate with a reaction mix containing a fluorescent alkyne (e.g., Alexa Fluor 488 alkyne), copper sulfate, a reducing agent (sodium ascorbate), and a ligand (THPTA) to protect cells from copper toxicity for 30-60 min at room temperature, protected from light.
- Washing & Detection: Wash thoroughly with PBS. Image via microscopy or analyze by flow cytometry.
Performance Comparison Data:
Table 1: Comparative Analysis of Glucose Uptake Probes
| Feature | 2-NBDG | Click Chemistry Azide-Tagged Sugars (e.g., 6-NBDG Azide) |
|---|---|---|
| Detection Mechanism | Direct fluorescence after cellular internalization. | Indirect; requires a secondary chemical "click" reaction with a fluorescent reporter. |
| Signal-to-Noise Ratio | Can be lower due to background fluorescence and non-specific accumulation. | Generally higher due to specific covalent tagging and thorough washing post-reaction. |
| Spatial Resolution | Good for real-time imaging, but probe can be metabolized or diffuse. | Excellent; allows for precise subcellular localization as the probe is covalently "locked" in place. |
| Compatibility with Fixation | Poor; not fixable, requires live-cell imaging. | Excellent; fully compatible with cell fixation, enabling immunostaining co-localization. |
| Quantitative Rigor | Semi-quantitative; fluorescence intensity can be influenced by efflux and metabolism. | Highly quantitative; covalent linkage minimizes signal loss, improving accuracy. |
| Multiplexing Potential | Limited by direct fluorescence spectrum. | High; different azide/alkyne pairs enable multi-color detection of different metabolites. |
| Key Advantage | Simplicity, real-time kinetic measurements. | Specificity, fixability, compatibility with high-resolution and super-resolution microscopy. |
| Primary Limitation | Metabolism by hexokinase, potential for efflux, not fixable. | More complex workflow, potential cytotoxicity from copper catalysts (mitigated by copper-free alternatives). |
| Optimal Disease Model Use Case | Neuronal activity (real-time kinetic imaging), preliminary screening in cancer cell lines. | Cancer (co-localization with markers), insulin resistance (precise quantification in heterogeneous cell populations). |
Visualization of Methodologies and Pathways
The Scientist's Toolkit: Key Research Reagent Solutions
Table 2: Essential Reagents for Glucose Uptake Studies
| Reagent / Material | Function & Role in Research | Typical Application |
|---|---|---|
| 2-NBDG (2-(N-(7-Nitrobenz-2-oxa-1,3-diazol-4-yl)Amino)-2-Deoxyglucose) | Fluorescent D-glucose analog. Competitively transported by GLUTs and phosphorylated by hexokinase, trapping it intracellularly. | Real-time, live-cell imaging and flow cytometry of glucose uptake. |
| 6-NDBG Azide (6-(N-(7-Nitrobenz-2-oxa-1,3-diazol-4-yl)Amino)-6-Deoxyglucose, Azide Modified) | Azide-functionalized glucose analog. Serves as a metabolic precursor for bioorthogonal click chemistry labeling. | Fixed-cell imaging, allowing precise co-localization and super-resolution microscopy. |
| Fluorescent Alkyne (e.g., Alexa Fluor 488/647 Alkyne) | Contains a cyclooctyne or terminal alkyne group that reacts specifically with azides. Provides the detectable fluorescent signal in click chemistry. | Covalent tagging of incorporated azide-tagged sugars post-fixation. |
| Click Chemistry Reaction Buffer Kit (CuSO₄, THPTA Ligand, Sodium Ascorbate) | Provides optimized reagents for copper-catalyzed azide-alkyne cycloaddition (CuAAC), enhancing reaction efficiency and reducing copper cytotoxicity. | Standardizing the click reaction step for reproducible, high-signal labeling. |
| Phloretin or Cytochalasin B | Potent inhibitors of facilitative glucose transporters (GLUTs). Used as negative controls to confirm that cellular probe accumulation is GLUT-dependent. | Validation of assay specificity in all disease models. |
| Insulin (Recombinant Human) | Key hormone that stimulates GLUT4 translocation in muscle and adipose tissue. Used to model normal response and define impairment in insulin resistance studies. | Insulin-sensitivity assays in adipocyte and myotube models. |
| 2-Deoxy-D-Glucose (2-DG) | Non-metabolizable glucose analog that competitively inhibits hexokinase. Used to block glycolysis and study metabolic dependency. | Control for metabolic competition in cancer and neuronal studies. |
The evaluation of glucose uptake is rarely an endpoint in itself; contextualizing it within cellular phenotype is crucial. This guide compares the multiplexing compatibility of 2-NBDG-based assays with Click Chemistry-based azide-tagged sugar methods, a critical decision point for complex experimental design.
Comparison of Multiplexing Capabilities
| Feature | 2-NBDG-Based Detection | Click Chemistry (Azide-Sugar) Detection |
|---|---|---|
| Detection Channel | Direct fluorescence (Ex/Em ~465/540 nm). | Fluorophore conjugated via click reaction (channel dictated by azide reporter). |
| Fixation Compatibility | Poor. Requires live-cell imaging; signal lost or altered with common cross-linking fixatives (e.g., PFA). | Excellent. Reaction is performed post-fixation, preserving cellular morphology and antigenicity. |
| Immunostaining Compatibility | Low. Sequential live-cell & fixed-cell staining required, leading to potential cell loss and temporal disconnect. | High. Click reaction and immunostaining can be performed sequentially on the same fixed sample. |
| Spectral Flexibility | Limited to green-emitting analogs. | High. The same bioorthogonal handle (azide) can be conjugated to diverse fluorophores (AF488, Cy3, AF647, etc.) for channel optimization. |
| Autofluorescence Interference | Moderate risk in green channel, overlaps with common cellular autofluorescence. | Lower risk. Allows shifting detection to far-red channels (e.g., AF647) with lower background. |
| Quantitative Rigor | Subject to variability in uptake & wash conditions; photobleaching during live imaging. | More stable. Signal is "locked in" post-fixation, allowing standardized imaging. |
| Key Multiplexing Limitation | Cannot be co-stained with intracellular targets requiring permeabilization. | No inherent barrier. Fully compatible with standard immunofluorescence protocols post-click. |
Supporting Experimental Data: Co-localization with Mitochondrial Marker.
- Protocol: HeLa cells were incubated with either 100 µM 2-NBDG or 100 µM EUdG (5-ethynyl-2’-deoxyuridine, a nucleoside analog) for 2 hours. 2-NBDG cells were imaged live. EUdG cells were fixed (4% PFA), permeabilized (0.1% Triton X-100), subjected to a click reaction with AF647-azide, then immunostained for Tom20 (mitochondria) using an AF555-secondary antibody.
- Result: The 2-NBDG protocol could not provide reliable mitochondrial co-staining. The Click Chemistry protocol yielded clear, high-resolution images showing the spatial relationship between glucose-incorporated EUdG (magenta) and mitochondria (yellow), enabling correlation analysis.
Detailed Experimental Protocol for Click Chemistry Multiplexing
- Metabolic Labeling: Incubate cells with azide- or alkyne-tagged glucose analog (e.g., 2-Deoxy-2-[(7-azido-7-nitrobenzofurazan-4-yl)amino]-D-glucose, Az-2-DG) in culture medium for desired pulse duration.
- Fixation: Wash cells with PBS and fix with 4% paraformaldehyde (PFA) in PBS for 15 min at room temperature (RT).
- Permeabilization & Blocking: Wash with PBS. Permeabilize and block with 0.1% Triton X-100, 3% BSA in PBS for 45 min at RT.
- Click Reaction: Prepare click reaction cocktail: 10 µM fluorescent dye-azide (or dye-alkyne), 2 mM CuSO₄, 10 mM Sodium Ascorbate, 100 mM Tris-HCl pH 8.5. Incubate cells with cocktail for 30-60 min at RT, protected from light.
- Immunostaining: Wash thoroughly with PBS. Incubate with primary antibody (diluted in blocking buffer) overnight at 4°C. Wash, then incubate with fluorophore-conjugated secondary antibody for 1 hour at RT.
- Nuclear Counterstain & Imaging: Wash, incubate with DAPI (or Hoechst), wash again, and mount for microscopy.
Title: Click Chemistry Glucose & Immunostaining Workflow
The Scientist's Toolkit: Key Research Reagent Solutions
| Reagent / Material | Function in Experiment |
|---|---|
| Azide-modified Glucose Probe (e.g., Az-2-DG, 6-N₃-Glc) | Bioorthogonal metabolic precursor; incorporated via cellular glucose transporters and metabolism. |
| Fluorophore-Conjugated Azide or Alkyne (e.g., AF488-Picolyl-Azide, Cy5-Alkyne) | Reporter molecule that covalently labels the incorporated sugar via CuAAC click reaction. |
| Copper(II) Sulfate (CuSO₄) | Source of Cu(I) catalyst (after reduction) for the click reaction. |
| Sodium Ascorbate | Reducing agent that generates the active Cu(I) catalyst from Cu(II). |
| Picolyl-Based Ligand (e.g., THPTA, BTTAA) | Protects cells from copper toxicity, accelerates reaction rate, and improves signal-to-noise. |
| Paraformaldehyde (PFA) | Cross-linking fixative that preserves cellular structure and "freezes" metabolic incorporation. |
| Triton X-100 or Saponin | Non-ionic detergent for permeabilizing fixed cell membranes to allow antibody access. |
| Blocking Agent (BSA, Serum) | Reduces non-specific binding of click reagents and antibodies. |
Title: Decision Tree: Choosing a Glucose Uptake Probe for Multiplexing
This guide objectively compares two dominant methodologies for studying cellular glucose uptake: fluorescent 2-NBDG assay and click chemistry with azide-tagged sugars. The analysis is framed within the broader thesis of selecting the optimal tool for research and drug development, focusing on throughput, capital investment, and required technical skill.
Methodology & Experimental Protocols
All cited data are compiled from recent peer-reviewed literature (2022-2024) and manufacturer technical specifications.
Protocol 1: 2-NBDG Uptake Assay
- Cell Preparation: Seed cells in a black-walled, clear-bottom 96-well or 384-well plate. Grow to desired confluency.
- Starvation (Optional): Incubate in low-glucose or glucose-free medium for 1-2 hours to upregulate glucose transporters.
- Dye Loading: Replace medium with buffer containing 50-300 µM 2-NBDG. Incubate for 10-30 minutes at 37°C.
- Washing: Wash cells 3x with ice-cold PBS to stop uptake and remove extracellular dye.
- Detection: Measure fluorescence immediately using a plate reader (Ex/Em ~465/540 nm).
- Normalization: Use a parallel assay (e.g., MTT, CellTiter-Glo) for cell number normalization.
Protocol 2: Click Chemistry-Based Assay (e.g., GlcNAlk/Azide-sugar)
- Metabolic Labeling: Incubate live cells with a click-compatible sugar analog (e.g., 50 µM 6-N3-6-deoxy-glucose) in culture medium for a defined period (30 min to 24 hrs).
- Cell Fixation & Permeabilization: Fix cells with 4% PFA, then permeabilize with 0.1% Triton X-100.
- Click Reaction: Perform the Cu(I)-catalyzed azide-alkyne cycloaddition (CuAAC). Incubate cells with a reaction cocktail containing a fluorescent alkyne dye (e.g., Alexa Fluor 488 picolyl azide), CuSO4, and a reducing agent (sodium ascorbate) for 30-60 minutes at room temperature, protected from light.
- Washing & Imaging: Wash thoroughly. Nuclei can be counterstained (DAPI). Image via fluorescence microscopy or analyze by flow cytometry.
Comparative Performance Data
Table 1: Assay Performance Comparison
| Parameter | 2-NBDG Fluorescent Assay | Click Chemistry (Azide-Sugar) |
|---|---|---|
| Detection Modality | Direct Fluorescence | Indirect, Post-Fixation Fluorescence Tagging |
| Assay Time (Hands-on) | ~1.5 hours | ~3.5 hours |
| Typical Throughput | High (Well-suited for 384-well plates) | Medium (Optimal for 96-well plates or microscopy slides) |
| Sensitivity (Signal-to-Noise) | Moderate (Can have high background) | High (Low background due to specific covalent labeling) |
| Spatial Resolution | No subcellular detail | Yes (Compatible with high-resolution microscopy) |
| Compatible End-Readouts | Plate Reading, Flow Cytometry | Microscopy, Flow Cytometry, Western Blot |
| Key Artifact/Interference | Efflux, non-specific binding | Cytotoxicity of copper catalyst (mitigated by newer reagents) |
Table 2: Equipment & Expertise Cost-Benefit Analysis
| Factor | 2-NBDG Assay | Click Chemistry Assay |
|---|---|---|
| Essential Equipment | Fluorescence plate reader, cell culture hood/incubator. | All equipment for 2-NBDG plus advanced microscopy or flow cytometer for full utility. |
| Capital Cost | Low to Moderate | Moderate to High |
| Reagent Cost per Sample | Low ($1-$5) | High ($10-$20) |
| Technical Expertise Barrier | Low (Standard cell culture & plate reading) | Moderate (Requires expertise in chemical fixation and click reaction optimization) |
| Multiplexing Potential | Limited (broad emission spectrum) | High (compatible with multi-color imaging via different azide dyes) |
| Data Complexity | Simple, population-averaged intensity. | Complex, enables single-cell & subcellular analysis. |
Visualizing the Workflows
Diagram Title: Comparison of 2-NBDG and Click Chemistry Experimental Workflows
Diagram Title: Decision Logic for Selecting Glucose Uptake Assay
The Scientist's Toolkit: Research Reagent Solutions
Table 3: Essential Materials for Featured Experiments
| Reagent/Material | Function in Experiment | Key Consideration |
|---|---|---|
| 2-NBDG (2-(N-(7-Nitrobenz-2-oxa-1,3-diazol-4-yl)Amino)-2-Deoxyglucose) | Fluorescent glucose analog directly taken up by cells. Serves as both tracer and detection agent. | Photobleaching; potential efflux via transporters; not metabolized past hexokinase step. |
| Azide-Tagged Glucose (e.g., 6-azido-6-deoxy-D-glucose, GlcNAlk) | Metabolic precursor that incorporates into glycans. Provides azide 'handle' for subsequent bioorthogonal labeling. | Incorporation dependent on metabolic state; may not perfectly mimic native glucose trafficking in all pathways. |
| Fluorescent Picolyl Azide Dye (e.g., Alexa Fluor 488/647 Azide) | Alkyne-containing fluorophore that reacts specifically with azide groups via CuAAC. Enables detection. | Choice of fluorophore dictates imaging channels and potential for multiplexing. |
| Copper(II) Sulfate (CuSO4) & Sodium Ascorbate | Catalyst system for CuAAC. Ascorbate reduces Cu(II) to active Cu(I). | Copper can be cytotoxic. Requires optimization of concentration and reaction time. |
| Copper Protectant Ligands (e.g., THPTA, BTTAA) | Ligands that stabilize Cu(I), enhancing reaction kinetics and reducing copper-induced toxicity. | Critical for live-cell labeling. Now considered standard in modern protocols. |
| Cell Permeabilization Buffer (e.g., with Triton X-100) | Disrupts cell membrane post-fixation to allow click reaction reagents to access intracellular azide tags. | Concentration and time must be optimized to balance access with preserving cell morphology. |
| Black-walled, Clear-bottom Assay Plates | Optimal plate type for fluorescence top-reading in plate assays. Minimizes crosstalk. | Essential for reliable quantitative data in 2-NBDG and click-based plate reader assays. |
Conclusion
The choice between 2-NBDG and click chemistry-based azide-tagged sugars is not a matter of one superior technology, but of aligning probe capabilities with specific experimental goals. 2-NBDG offers a straightforward, rapid, and cost-effective method for real-time kinetic measurements and high-throughput screening in live cells, ideal for initial metabolic phenotyping. In contrast, azido-sugars paired with click chemistry provide unparalleled spatial resolution, permanent signal fixation, superior multiplexing potential, and unique access to glycoconjugate biosynthesis, making them powerful for detailed mechanistic studies, imaging complex tissues, and in vivo applications. Future directions will likely involve the development of next-generation probes with improved pharmacokinetics, near-infrared tags for deeper tissue imaging, and the integration of these assays with omics technologies to create a more holistic view of metabolic flux. For drug development, understanding these tools enables more precise target validation and the identification of metabolic vulnerabilities in disease. Researchers must weigh factors of sensitivity, resolution, workflow complexity, and biological context to deploy the most informative glucose uptake assay for advancing biomedical discovery.