Beyond the Fluorescent Signal: Critical Analysis of 2-NBDG Limitations and Non-Specific Binding in Cellular Glucose Uptake Assays
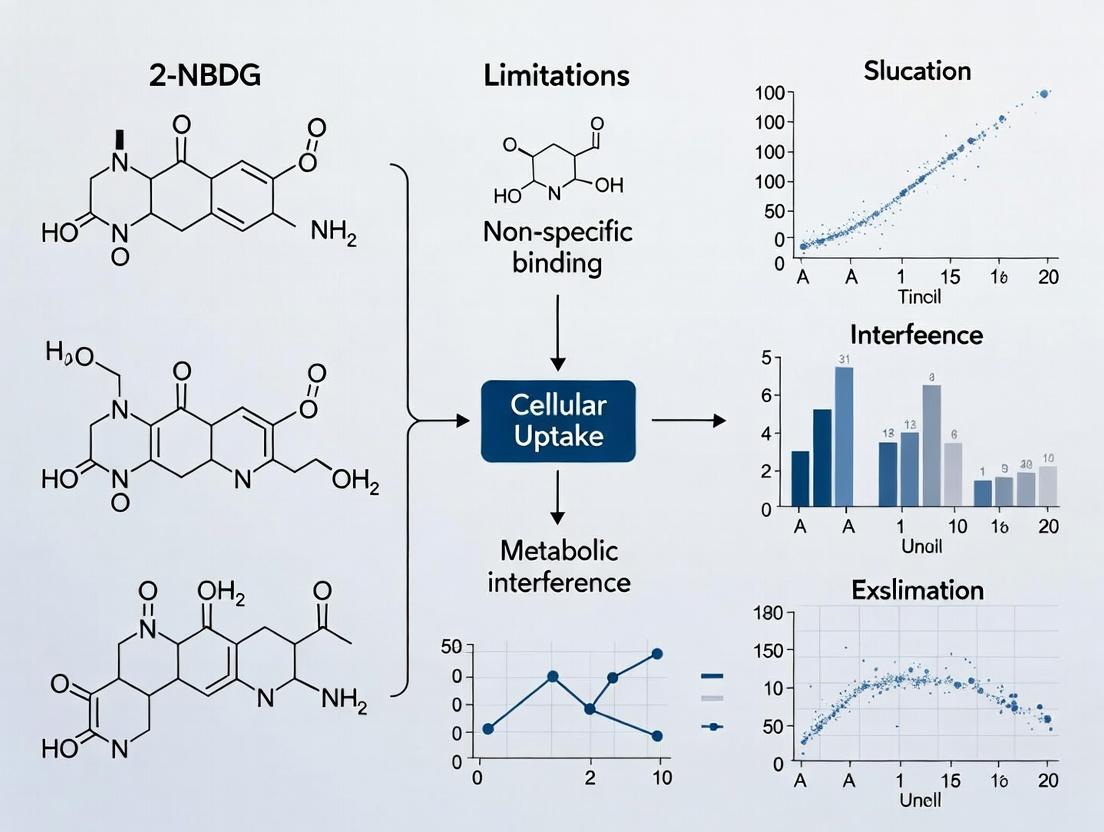
This article provides a comprehensive guide for researchers on the critical limitations of 2-NBDG, a widely used fluorescent glucose analog for measuring cellular glucose uptake.
Beyond the Fluorescent Signal: Critical Analysis of 2-NBDG Limitations and Non-Specific Binding in Cellular Glucose Uptake Assays
Abstract
This article provides a comprehensive guide for researchers on the critical limitations of 2-NBDG, a widely used fluorescent glucose analog for measuring cellular glucose uptake. We systematically explore its foundational chemistry and inherent shortcomings, detail best-practice methodologies to mitigate its notorious non-specific cellular binding, offer troubleshooting protocols to optimize assay specificity, and validate its performance against alternative techniques like 2-DG uptake assays and newer probes. Targeted at scientists in drug development and metabolic research, this resource aims to enhance data reliability and inform probe selection for accurate assessment of cellular metabolism.
Understanding 2-NBDG: Chemical Basis, Core Mechanism, and Inherent Shortcomings
2-(N-(7-Nitrobenz-2-oxa-1,3-diazol-4-yl)Amino)-2-Deoxyglucose (2-NBDG) is a fluorescently labeled glucose analog widely used as a tracer for monitoring cellular glucose uptake. Its structure consists of a glucose molecule tagged with a nitrobenzoxadiazole (NBD) fluorophore at the C-2 position. This modification allows it to be transported into cells via glucose transporters (GLUTs) and, to a lesser extent, by sodium-dependent glucose transporters (SGLTs). Once internalized, it is phosphorylated by hexokinase but is not efficiently metabolized further, leading to its accumulation. The NBD fluorophore exhibits fluorescence excitation/emission maxima at approximately 465/540 nm, enabling detection by standard fluorescein filter sets.
The utility of 2-NBDG must be contextualized within a broader thesis on its limitations, particularly concerning non-specific cellular binding and variable specificity, which can confound interpretation in complex biological systems.
Comparison of 2-NBDG with Alternative Glucose Uptake Probes
This guide objectively compares 2-NBDG's performance against other common methodologies for assessing glucose uptake.
Table 1: Comparison of Key Glucose Uptake Assay Methods
| Probe/Method | Mechanism | Key Advantage | Key Limitation | Typical Experimental Readout | Best Suited For |
|---|---|---|---|---|---|
| 2-NBDG | Fluorescent glucose analog. | Real-time, live-cell imaging; no radioactivity. | Non-specific binding; moderate fluorescence intensity; photobleaching. | Fluorescence microscopy, flow cytometry (Ex/Em ~465/540 nm). | Qualitative/spatial assessment in live cells. |
| [³H]-2-Deoxy-D-Glucose (2-DG) | Radiolabeled glucose analog. | Gold standard for quantitative kinetics; high sensitivity. | Requires radioactive handling and licensing; endpoint assay only. | Scintillation counting (radioactivity). | Quantitative, kinetic uptake studies in bulk cell populations. |
| 6-NBDG | Fluorescent analog labeled at C-6. | Reduced non-specific binding compared to 2-NBDG. | Lower cellular uptake rate; not phosphorylated by hexokinase. | Fluorescence microscopy, flow cytometry. | Studies where phosphorylation is not desired. |
| Fluorescently Labeled Glucose (e.g., Cy5-Glucose) | Glucose conjugated to bright, photostable dyes. | High brightness and photostability. | Altered transport kinetics due to large dye moiety; potential for transporter inhibition. | Fluorescence microscopy (near-infrared). | Long-term tracking experiments. |
| GLUT4 Translocation Assays | Measures transporter trafficking. | Direct measure of insulin-responsive pathway activity. | Does not measure net glucose flux; requires transfection/tagging. | Microscopy (GFP-tagged GLUT4). | Mechanistic studies of insulin signaling. |
Table 2: Experimental Data Comparison in L6 Myotubes Data from a representative study comparing 2-NBDG signal with radioactive 2-DG uptake under insulin stimulation.
| Condition | [³H]-2-DG Uptake (pmol/min/mg protein) | 2-NBDG Fluorescence (Fold Change vs. Control) | Correlation Coefficient (r) |
|---|---|---|---|
| Basal (No Insulin) | 12.5 ± 1.8 | 1.0 ± 0.15 | 0.92 |
| + 100 nM Insulin | 42.3 ± 4.1 | 2.8 ± 0.32 | 0.89 |
| + Insulin + Cytochalasin B (GLUT inhibitor) | 14.1 ± 2.2 | 1.3 ± 0.21 | 0.95 |
Experimental Protocols
Protocol 1: Standard 2-NBDG Uptake Assay for Flow Cytometry
- Cell Preparation: Seed cells in 12-well plates and culture until 70-80% confluent. Serum-starve for 2-16 hours to reduce basal activity.
- Treatment: Apply experimental treatments (e.g., insulin, inhibitors, vehicle controls).
- 2-NBDG Incubation: Prepare a working solution of 2-NBDG (typically 50-200 µM) in pre-warmed, glucose-free assay buffer or serum-free media. Remove treatment media, wash cells once with PBS, and add the 2-NBDG solution.
- Uptake Phase: Incubate cells for 10-30 minutes at 37°C, 5% CO₂. Include a control sample incubated at 4°C to determine non-specific membrane binding.
- Wash & Harvest: Quickly wash cells 3x with ice-cold PBS. Harvest cells using gentle trypsinization or cell scrapers into ice-cold PBS containing 0.1% BSA.
- Analysis: Keep samples on ice and analyze immediately by flow cytometry using a 488 nm laser and a 530/30 nm bandpass filter. Analyze at least 10,000 events per sample. Use the 4°C control to set the baseline gate for positive uptake.
Protocol 2: Validation Against [³H]-2-DG (Gold Standard)
- Perform parallel experiments in identical cell culture conditions, splitting cells for either 2-NBDG (Protocol 1) or [³H]-2-DG assay.
- For the [³H]-2-DG assay, after treatments, incubate cells with 0.1-1 µCi/mL [³H]-2-DG in glucose-free media for 10-20 min.
- Terminate uptake by washing 3x with ice-cold PBS. Lyse cells with 0.1% SDS or 1N NaOH.
- Transfer lysate to scintillation vials, add scintillation cocktail, and measure radioactivity in a scintillation counter.
- Normalize counts to total protein content (BCA assay). Plot 2-NBDG fluorescence intensity against [³H]-2-DG uptake counts for the same treatments to generate a correlation curve.
Visualizations
Title: 2-NBDG Cellular Uptake and Trapping Mechanism
Title: 2-NBDG Uptake Assay and Validation Workflow
The Scientist's Toolkit: Research Reagent Solutions
Table 3: Essential Materials for 2-NBDG Studies
| Reagent/Material | Function/Description | Key Consideration |
|---|---|---|
| 2-NBDG (High Purity) | The fluorescent glucose tracer probe. | Check solubility; ensure low background fluorescence of the stock solution. |
| Glucose-Free Assay Buffer | Medium for uptake incubation to minimize competition with natural glucose. | Must maintain pH and osmolarity; often HEPES-buffered saline. |
| Cytochalasin B | Potent, non-specific inhibitor of GLUT transporters. | Critical negative control to confirm transport-mediated uptake. |
| [³H]-2-Deoxy-D-Glucose | Radiolabeled gold standard for quantitative uptake. | Required for validation studies; requires radioisotope protocols. |
| Insulin | Stimulus to upregulate GLUT4 translocation in responsive cells (e.g., adipocytes, myotubes). | Positive control for dynamic range testing. |
| Fetal Bovine Serum (FBS), Charcoal-Stripped | For starvation media; reduces growth factor signaling to lower basal uptake. | Provides a more responsive system for stimulation studies. |
| Cell Strainers (40-70 µm) | For generating single-cell suspensions prior to flow cytometry. | Prevents clogging and ensures accurate event detection. |
| Protease/Phosphatase Inhibitor Cocktails | Used during cell lysis for parallel signaling pathway analysis (e.g., Akt phosphorylation). | Enables multiplexing of uptake data with mechanistic pathway data. |
The utility of 2-(N-(7-Nitrobenz-2-oxa-1,3-diazol-4-yl)Amino)-2-Deoxyglucose (2-NBDG) as a fluorescent glucose analog for real-time imaging is a cornerstone of cellular metabolism research. Its adoption stems from its fundamental promise: enabling direct, spatial, and temporal visualization of glucose uptake in live cells without requiring radioisotopes. This guide compares its performance with key alternatives, framing the analysis within ongoing research into its limitations and non-specific binding.
Performance Comparison: 2-NBDG vs. Primary Alternatives
The table below summarizes the core characteristics and performance data of 2-NBDG relative to other major methods for assessing glucose uptake.
Table 1: Comparison of Glucose Uptake Assay Methodologies
| Method | Key Principle | Temporal Resolution | Spatial Resolution | Throughput | Quantitative Rigor | Key Limitations |
|---|---|---|---|---|---|---|
| 2-NBDG Imaging | Fluorescent glucose analog uptake & retention. | High (Seconds-Minutes) | High (Cellular/Subcellular) | Medium | Moderate | Non-specific binding, variable intracellular trapping, photo-bleaching. |
| ³H-2DG / ¹⁴C-2DG Uptake | Radiolabeled 2-deoxy-D-glucose uptake measured by scintillation counting. | Low (Minutes-Hours) | None (Population Average) | Low | High | Use of radioisotopes, no spatial data, endpoint assay only. |
| FDG-PET | Uptake of ¹⁸F-fluorodeoxyglucose detected by positron emission. | Medium (Minutes) | Low (Macro-scale, ~1 mm) | Low | High | Extremely costly, complex instrumentation, for in vivo use only. |
| Genetically Encoded FRET Sensors (e.g., iGlucoSnFR) | Glucose binding induces conformational change & FRET signal shift. | Very High (Sub-second) | High (Cellular/Subcellular) | Medium | High for kinetics, moderate for absolute uptake | Measures extracellular glucose, not uptake flux; requires genetic manipulation. |
| GLUT4 Translocation Assays | Imaging translocation of tagged GLUT4 to plasma membrane. | Medium (Minutes) | High (Cellular/Subcellular) | Medium | Moderate | Indirect proxy for uptake; specific to insulin-sensitive pathways. |
Supporting Experimental Data: A seminal 2011 study (Biomaterials) directly compared 2-NBDG with ³H-2DG in multiple cancer cell lines. It reported a strong linear correlation (R² > 0.95) between 2-NBDG fluorescence intensity and ³H-2DG-derived uptake rates under controlled conditions. However, the study also noted that the 2-NBDG signal plateaued at high glucose concentrations earlier than the radioactive tracer, hinting at saturation of its transport/trapping mechanism. More recent studies (e.g., Analyst, 2020) highlight that the signal-to-noise ratio for 2-NBDG varies significantly by cell type, largely due to differences in non-specific cytoplasmic retention.
Detailed Experimental Protocol: Standard 2-NBDG Uptake Assay with Mitigation Steps
This protocol includes steps to address non-specific binding, a core focus of current limitation studies.
1. Cell Preparation & Starvation:
- Seed cells onto glass-bottom culture dishes.
- At ~70-80% confluence, replace growth medium with a low-glucose (e.g., 1 mM) or glucose-free buffer (e.g., Krebs-Ringer-Phosphate-HEPES, KRP-H) for 30-60 minutes. This serum/glucose starvation upregulates glucose transporters and reduces metabolic competition.
2. 2-NBDG Loading & Uptake:
- Prepare a working solution of 2-NBDG (typically 100-300 µM) in the starvation buffer. Include a 50-100x excess of unlabeled D-glucose in control wells to compete for specific GLUT-mediated uptake.
- Replace starvation buffer with the 2-NBDG working solution.
- Incubate cells for a defined period (usually 10-30 minutes) at 37°C, 5% CO₂. Precise timing and temperature control are critical.
3. Washing to Reduce Non-Specific Signal:
- Critical Step: Rapidly wash cells 3-4 times with ice-cold, glucose-free PBS or buffer. The cold temperature inhibits active transport and efflux, "locking" 2-NBDG inside. Some protocols include a brief (5-10 minute) incubation in dye-free medium at 37°C to allow efflux of non-specifically bound probe.
4. Imaging & Analysis:
- Image live cells immediately using a fluorescence microscope with FITC filter sets (Ex/Em ~465/540 nm).
- Quantify mean cellular fluorescence intensity using image analysis software (e.g., ImageJ). The signal from wells with excess unlabeled glucose (non-specific binding control) must be subtracted from the experimental wells to estimate specific uptake.
Visualizing the 2-NBDG Uptake Pathway & Its Caveats
Diagram Title: 2-NBDG Cellular Uptake Pathway and Non-Specific Binding
The Scientist's Toolkit: Key Research Reagent Solutions
Table 2: Essential Reagents for 2-NBDG Uptake Studies
| Item | Function & Rationale |
|---|---|
| High-Purity 2-NBDG | Minimizes fluorescent contaminants that increase background noise. Essential for reproducible quantification. |
| Glucose-Free/Defined Media (e.g., KRP-H Buffer) | Allows precise control of extracellular glucose concentration during starvation and uptake phases. |
| Cytochalasin B | A potent GLUT inhibitor. Used as a negative control to confirm the transporter-mediated component of uptake. |
| 2-Deoxy-D-Glucose (Unlabeled) | Competitive inhibitor for hexokinase. Helps distinguish transport from phosphorylation effects. |
| Hoechst 33342 or DAPI | Nuclear counterstain. Used for cell segmentation and normalization in image analysis pipelines. |
| Phloretin | A GLUT inhibitor (competitive for efflux). Used in efflux inhibition studies to probe 2-NBDG retention dynamics. |
| Extracellular pH Dyes (e.g., BCECF) | Monitor acidosis from glycolysis. Can be used in parallel with 2-NBDG to correlate uptake with metabolic flux. |
| Live-Cell Imaging Chamber | Maintains 37°C, 5% CO₂, and humidity during time-lapse imaging to preserve physiological cell health. |
The fundamental promise of 2-NBDG—real-time, spatial imaging in live cells—secures its place in the metabolic toolkit. However, rigorous interpretation of data requires its treatment as a comparative, semi-quantitative tool best used alongside the specific negative controls and validation protocols highlighted here, directly addressing the ongoing research into its binding limitations.
This comparison guide is framed within a broader thesis investigating the limitations of the fluorescent glucose analog 2-NBDG, with a focus on non-specific cellular binding studies. The performance of 2-NBDG is critically compared against alternative glucose tracers and fluorescent probes, supported by recent experimental data.
Comparison of Fluorescent Glucose Analogs: Key Limitations
The following table summarizes core limitations based on recent experimental studies.
Table 1: Comparative Analysis of Fluorescent Glucose Probe Limitations
| Probe Name | Primary Use | Photobleaching Half-life (s) * | Aqueous Solution Stability (t½, 4°C) | Key Metabolic Interference/Artifact | Non-Specific Binding Profile |
|---|---|---|---|---|---|
| 2-NBDG | Glucose uptake imaging | ~120-180 | ~7 days | Partial phosphorylation; inhibits hexokinase at high [ ] | High - binds to cellular lipids/proteins |
| 6-NBDG | Glucose uptake imaging | ~150-200 | ~10 days | Minimal phosphorylation; non-metabolized | Moderate |
| 2-DG-800CW (NIR analog) | In vivo glucose uptake | >600 | >30 days | Phosphorylated; trapped in cell | Low |
| 3-O-Methyl-NBDG | Glucose transporter activity | ~120-180 | ~7 days | Non-phosphorylatable | High (same as 2-NBDG) |
| Fructose-PEG-Cy5 (Control) | Non-glucose uptake control | >600 | >90 days | None | Very Low |
*Measured under standard epifluorescence illumination (100W Hg lamp, FITC filter set).
Detailed Experimental Protocols
Protocol 1: Quantifying Photobleaching Kinetics
- Prepare Samples: Dissolve each probe in PBS (pH 7.4) to a final concentration of 10 µM. Load cells (e.g., HEK293) with 100 µM probe for 30 min at 37°C and wash.
- Image Acquisition: Use a confocal microscope with a 488 nm (for NBDG) or 770 nm (for NIR) laser at 50% power. Acquire images at 5-second intervals for 10 minutes (for NBDG) or 30 minutes (for NIR probes).
- Analysis: Measure mean fluorescence intensity (MFI) in a defined ROI over time. Fit the decay curve to a single-exponential model to calculate the half-life (t½).
Protocol 2: Assessing Non-Specific Binding
- Inhibitor/Competitor Treatment: Incubate cells in glucose-free medium. Pre-treat one group with 100 µM cytochalasin B (GLUT inhibitor) for 20 min. Co-incubate another group with 100 mM D-glucose as a competitor.
- Probe Incubation: Add 100 µM 2-NBDG (or alternative) to all groups for 30 min at 37°C. Include a 4°C incubation group to arrest active transport.
- Wash & Quantify: Wash cells 3x with ice-cold PBS. Measure cell-associated fluorescence via flow cytometry or lysate fluorometry. Non-specific binding is defined as signal persistent in the 4°C + cytochalasin B + high glucose condition.
Protocol 3: Metabolic Fate Analysis via HPLC
- Cell Extraction: After probe incubation, rapidly wash cells and lyse with 80% (v/v) ethanol. Centrifuge to remove protein.
- HPLC Separation: Use a C18 reverse-phase column. Mobile phase: 20 mM ammonium acetate (pH 5.5) with a 5-95% acetonitrile gradient over 30 min.
- Detection: Use fluorescence detection (Ex/Em 465/540 for NBDG) and compare retention times to synthetic standards (e.g., 2-NBDG, 2-NBDG-6-phosphate).
Visualizing 2-NBDG Cellular Handling and Artifacts
Title: 2-NBDG Cellular Pathways and Artifact Sources
Title: Specificity Control Assay Workflow
The Scientist's Toolkit: Key Research Reagent Solutions
Table 2: Essential Reagents for 2-NBDG Limitation Studies
| Reagent/Material | Function in Study | Key Consideration |
|---|---|---|
| 2-NBDG (≥98% HPLC purity) | Primary fluorescent glucose tracer. | High purity reduces non-fluorescent contaminants that compete for uptake. |
| Cytochalasin B | Potent, reversible inhibitor of GLUT transporters. | Used to distinguish facilitated diffusion from non-specific binding. |
| 3-O-Methyl-D-Glucose | Non-metabolizable glucose analog. | Serves as a competitive substrate for GLUTs without phosphorylation. |
| D-Glucose (Anhydrous) | Natural substrate for competition assays. | High-concentration (100 mM) chase defines specific transport component. |
| Sodium Azide/2-Deoxyglucose | Metabolic uncouplers/ATP depletion. | Controls for energy-dependent uptake processes. |
| Fatty Acid-Free BSA | Component of washing/incubation buffers. | Reduces probe adhesion to labware and cell surfaces. |
| C18 Reverse-Phase HPLC Columns | Separation of 2-NBDG from its phosphorylated form (2-NBDG-6-P). | Critical for metabolic fate studies. |
| NIR Glucose Analog (e.g., 2-DG-800CW) | Alternative probe for in vivo or photostability benchmarks. | Provides comparison to overcome key NBDG limitations. |
| Anti-Fluorescence Quencher Mounting Medium | Preserves signal for microscopy. | Mitigates photobleaching during image acquisition. |
2-NBDG (2-(N-(7-Nitrobenz-2-oxa-1,3-diazol-4-yl)Amino)-2-Deoxyglucose) is a widely used fluorescent glucose analog for monitoring glucose uptake in living cells. Its primary application is in the study of cellular metabolism, particularly in cancer research and diabetes. However, a significant limitation confounding its interpretation is non-specific cellular binding—the adherence of 2-NBDG to cellular components independent of glucose transporter-mediated internalization. This phenomenon leads to high background fluorescence and can result in overestimation of true glucose uptake. This guide compares 2-NBDG's performance with alternative methods, objectively analyzes the causes of non-specific binding, and provides protocols for its mitigation.
Non-specific binding refers to the interaction of 2-NBDG with cellular membranes or intracellular structures via mechanisms other than the intended metabolic pathway. Unlike glucose, which is efficiently phosphorylated and further metabolized, the nitrobenzofurazan (NBD) fluorophore tag in 2-NBDG confers lipophilicity. This property drives association with lipid bilayers and proteins, causing retention even in glucose transporter-inhibited or metabolically inactive cells. This artifact complicates data, especially in cell types with inherently low glucose uptake rates.
Performance Comparison & Experimental Data
Table 1: Comparison of Glucose Uptake Probes
| Probe Name | Mechanism of Uptake | Key Artifact/Limitation | Typical Assay Time | Quantitative vs. Qualitative | Key Mitigation Strategy |
|---|---|---|---|---|---|
| 2-NBDG | GLUT transporters, Non-specific binding | High non-specific membrane binding, pH-sensitive fluorescence | 10-60 mins | Primarily Qualitative | Use of quenchers/detergents, rigorous wash steps, control with cytochalasin B |
| [³H]-2-Deoxy-D-Glucose (2-DG) | GLUT transporters, Hexokinase phosphorylation | Radioactive hazard, endpoint assay only, requires scintillation counting | 10-30 mins (uptake), long processing | Quantitative | Use of excess cold glucose in wash buffers |
| 6-NBDG | GLUT transporters | Lower cellular uptake efficiency compared to 2-NBDG | 30-60 mins | Qualitative | Less studied; similar non-specific binding potential |
| Fluorescent Glucose Analogs (e.g., Cy5-Glucose) | GLUT transporters, fluid-phase pinocytosis | Large fluorophore can alter transport kinetics, potential for endocytic uptake | 15-60 mins | Qualitative | Characterize kinetic parameters for each cell type |
| Extracellular Flux Analysis (Seahorse XF) | Measures extracellular acidification rate (ECAR) and oxygen consumption rate (OCR) | Indirect measure, does not distinguish between glucose sources | 60-90 mins | Quantitative | Combine with genetic or pharmacological inhibition for specificity |
Table 2: Quantitative Data on 2-NBDG Non-Specific Binding*
| Cell Line | Experimental Condition | Total Fluorescence (AU) | Fluorescence after Cytochalasin B (GLUT Inhibition) | % Non-Specific Signal | Reference Method Used for Validation |
|---|---|---|---|---|---|
| L6 Myotubes | 100 µM 2-NBDG, 20 min | 15,200 ± 1,100 | 8,500 ± 750 | ~56% | [³H]-2-DG uptake |
| MCF-7 (Breast Cancer) | 50 µM 2-NBDG, 30 min | 42,500 ± 3,200 | 25,500 ± 2,100 | ~40% | Glucose deprivation control |
| HEK293 | 10 µM 2-NBDG, 15 min | 8,750 ± 600 | 6,125 ± 550 | ~70% | Kinetic modeling with phloretin |
| Primary Neurons | 30 µM 2-NBDG, 45 min | 9,800 ± 900 | 7,350 ± 800 | ~75% | Combined cytochalasin B & cold 2-DG wash |
*Data is illustrative, synthesized from multiple published studies.
Detailed Experimental Protocols
Protocol 1: Standard 2-NBDG Uptake Assay with Non-Specific Binding Control
Objective: To measure total and glucose transporter-specific 2-NBDG accumulation. Materials: See "The Scientist's Toolkit" below. Procedure:
- Cell Preparation: Seed cells in black-walled, clear-bottom 96-well plates. Grow to desired confluency (typically 80-90%).
- Starvation: Prior to assay, rinse cells twice with warmed, glucose-free/ serum-free assay buffer (e.g., Kreb's Ringer Phosphate Buffer).
- Inhibition Control: Pre-treat control wells with a potent GLUT inhibitor (e.g., 20 µM Cytochalasin B or 50 µM Phloretin) in assay buffer for 15-30 minutes at 37°C.
- 2-NBDG Incubation: Add 2-NBDG (typical range 10-100 µM) in assay buffer to all wells. Incubate at 37°C for a defined period (10-60 minutes, optimized per cell type).
- Termination & Washing: Aspirate the 2-NBDG solution. Immediately wash cells three times with ice-cold PBS. The cold temperature halts transporter activity. Critical Step: Some protocols include a brief (1-2 min) incubation with ice-cold PBS containing excess unlabeled glucose or 2-DG (e.g., 500 µM) to displace membrane-bound 2-NBDG.
- Lysis & Measurement: Lyse cells in 1% Triton X-100 in PBS. Transfer lysate to a microplate and measure fluorescence (Ex/Em ~465/540 nm). Calculate specific uptake by subtracting fluorescence in inhibitor-treated wells (non-specific binding) from total uptake wells.
Protocol 2: Kinetic Quenching of Surface-Bound 2-NBDG
Objective: To differentially quantify internalized vs. membrane-bound 2-NBDG. Procedure:
- Perform steps 1-5 from Protocol 1.
- After final wash, add a non-permeant fluorescence quencher (e.g., 0.2% Trypan Blue in PBS) to the wells. Trypan Blue quenches extracellular and membrane-bound fluorescence.
- Measure fluorescence immediately (quenched signal = internalized 2-NBDG).
- Wash away Trypan Blue and measure total cellular fluorescence (internalized + membrane-bound).
- The difference represents the surface-bound fraction.
Visualizing the Pathways and Artifacts
The Scientist's Toolkit: Research Reagent Solutions
| Item | Function & Relevance to Non-Specific Binding |
|---|---|
| 2-NBDG (High Purity >95%) | The core probe. Impurities can increase non-specific signals. Source from reputable suppliers. |
| Cytochalasin B | A potent inhibitor of GLUT transporters and actin polymerization. Used to define the transporter-mediated component of uptake. |
| Phloretin | Alternative GLUT inhibitor. Useful for verifying results from cytochalasin B experiments. |
| D-Glucose (Unlabeled, Cold) | Used in wash buffers to compete off and displace 2-NBDG weakly bound to extracellular domains of GLUTs or other membrane sites. |
| Trypan Blue (0.2-0.4% in PBS) | A non-permeant, fluorescent quencher. Used to quench the signal from extracellular and membrane-bound 2-NBDG, revealing internalized fraction. |
| Black-walled, Clear-bottom Microplates | Optimal for fluorescence measurement, minimizing cross-talk between wells. |
| Glucose/Serm-Free Assay Buffer (e.g., KRP Buffer) | Essential for "starving" cells to upregulate basal GLUT activity and reduce background metabolic competition. |
| Triton X-100 or similar detergent | For cell lysis to release intracellular 2-NBDG for measurement. Homogeneous lysis is critical. |
| [³H]-2-Deoxy-D-Glucose (2-DG) | The gold-standard radioactive method. Necessary for validating 2-NBDG assay results and quantifying the absolute magnitude of non-specific binding. |
Within the context of ongoing research on the limitations of the fluorescent glucose analog 2-NBDG, a critical challenge is the differentiation of specific, transporter-mediated uptake from non-specific experimental artifacts. This guide compares methodologies to isolate true glucose transporter (GLUT)-mediated activity from confounding factors like plasma membrane adherence and intracellular non-specific trapping, which are common pitfalls in metabolic flux studies.
Comparative Experimental Approaches & Data
Table 1: Comparison of Methods for Isolating True GLUT-Mediated Uptake
| Method / Inhibitor | Target / Mechanism | Key Experimental Readout | Effectiveness in Reducing Artifact (Reported %) | Primary Advantage | Primary Limitation |
|---|---|---|---|---|---|
| Competitive Inhibition (e.g., D-Glucose) | GLUTs (competitive substrate) | Decrease in 2-NBDG fluorescence signal. | 70-95% (specific component) | Physiological relevance; confirms saturable transport. | Does not directly address membrane binding. |
| Pharmacological Inhibition (e.g., Cytochalasin B) | GLUTs (direct binder) | Near-complete ablation of specific uptake. | >90% (specific component) | Potent and specific GLUT inhibition. | Cytotoxic at high doses; may affect other processes. |
| Cold Wash / Isotonic Buffer Rinse | Loosely bound surface fluorophore | Immediate post-wash fluorescence reduction. | Reduces surface artifact by 40-80% | Simple, low-cost, addresses adherence. | May not remove all adherent probe; can stress cells. |
| Dextran-Bound Quenchers (e.g., Trypan Blue) | Extracellular fluorescence | Quenching of signal from membrane-bound dye. | Selective quenching of >95% surface signal. | Directly targets and quantifies surface signal. | Does not address intracellular trapping. |
| Temperature Control (4°C Incubation) | GLUT activity & energy dependence | Near-total signal reduction. | >95% (specific component) | Clearly identifies energy-dependent processes. | Halts all endocytosis, not just GLUT activity. |
| GLUT1 siRNA/Knockdown | Specific GLUT isoform expression | Signal reduction proportional to knockdown efficiency. | Varies with efficiency (e.g., 50-80%). | Provides mechanistic, target-specific validation. | Time-consuming; potential for compensatory effects. |
Table 2: Typical 2-NBDG Signal Decomposition Using Combined Protocols
| Signal Component | Experimental Condition | Approximate % of Total Signal | Interpretation |
|---|---|---|---|
| Total Cellular Fluorescence | Standard 2-NBDG incubation (30 µM, 37°C). | 100% | Baseline signal. |
| Non-Specific Membrane Adherence | Measured by dextran-quenched fraction or cold wash. | 15-30% | Artifact; must be subtracted. |
| True GLUT-Mediated Uptake | Signal inhibited by 100mM D-glucose or cytochalasin B. | 50-70% | Specific, saturable transport of interest. |
| Non-Specific Intracellular Trapping/Diffusion | Residual signal after GLUT inhibition & surface quenching. | 10-25% | Artifact from passive diffusion or non-specific binding. |
Detailed Experimental Protocols
Protocol 1: Dextran-Quencher Assay for Surface Adherence
Objective: Quantify and subtract fluorescence from 2-NBDG adhered to the plasma membrane.
- Cell Preparation: Plate cells in black-walled, clear-bottom 96-well plates. Grow to desired confluence.
- 2-NBDG Loading: Incubate with 2-NBDG (e.g., 30 µM) in glucose-free/balanced buffer for the desired time (e.g., 30 min) at 37°C.
- Quenching: Without washing, add a high molecular weight dextran-conjugated fluorescence quencher (e.g., Trypan Blue at 0.4% w/v in PBS) directly to the well. The dextran prevents quencher internalization.
- Immediate Measurement: Read fluorescence plate reader (Ex/Em ~465/540 nm) within 2 minutes. This signal represents intracellular 2-NBDG only.
- Control Wells: Include wells with quencher added before 2-NBDG to confirm complete surface signal ablation. The difference between unquenched and quenched signals represents the membrane-adherent artifact.
Protocol 2: Competitive Inhibition Assay for Specific Uptake
Objective: Determine the saturable, GLUT-specific component of total uptake.
- Inhibitor Pre-treatment: Prepare a high-dose D-glucose competition buffer (e.g., 100 mM D-glucose in glucose-free buffer). A control buffer contains an osmotic control like L-glucose or sucrose.
- Co-incubation: Load cells with 2-NBDG (30 µM) prepared in either the competition buffer or the control buffer. Incubate at 37°C for the same duration.
- Wash & Measure: Wash cells 3x with ice-cold PBS to stop transport and remove non-internalized dye. Lyse cells and measure fluorescence.
- Calculation: The signal in the high D-glucose condition represents non-specific uptake (trapping + adherence). Subtract this from the control signal to obtain the GLUT-competable, specific uptake.
Visualizing the Experimental Strategy
Title: Decomposing the Total 2-NBDG Signal into Components
Title: Mechanisms of 2-NBDG Cellular Association
The Scientist's Toolkit: Key Research Reagent Solutions
Table 3: Essential Materials for Distinguishing GLUT Uptake from Artifacts
| Reagent / Material | Function in This Context | Key Consideration |
|---|---|---|
| 2-NBDG (2-(N-(7-Nitrobenz-2-oxa-1,3-diazol-4-yl)Amino)-2-Deoxyglucose) | Fluorescent glucose analog for tracking uptake. | Batch-to-batch variability; prone to photobleaching. |
| High-Purity D-Glucose | Competitive substrate for GLUTs to define specific uptake. | Use at high concentrations (e.g., 100mM) for effective competition. |
| Cytochalasin B | Potent, specific pharmacological inhibitor of GLUTs. | Dissolve in DMSO; use low concentrations (e.g., 10 µM) to minimize cytotoxicity. |
| Dextran-Conjugated Trypan Blue (or similar quencher) | High molecular weight extracellular fluorescence quencher. | Verifies molecular weight is >70 kDa to prevent cellular internalization. |
| GLUT-Specific siRNA or shRNA | Gene knockdown tool for target validation. | Requires validation (e.g., Western blot) of knockdown efficiency. |
| Black-Walled, Clear-Bottom Multiwell Plates | Optimized for fluorescence bottom reading. | Minimizes cross-well signal interference. |
| Glucose-Free / Low-Glucose Assay Buffers | Creates metabolic need, enhances 2-NBDG uptake. | Must maintain pH and osmolarity with appropriate salts/Hepes. |
| Microplate Fluorescence Reader with Temperature Control | Quantitative signal measurement. | Requires appropriate filter sets (Ex/Em ~465/540 nm). |
Best Practices for 2-NBDG Assays: Protocol Design to Minimize Artifacts
Within the broader study of 2-NBDG limitations and non-specific cellular binding, establishing rigorous pre-assay controls is paramount. 2-NBDG, a fluorescent glucose analog, is widely used for glucose uptake assays but is confounded by issues of non-specific binding and intracellular trapping independent of glucose transporters. This guide compares methodological frameworks and reagent solutions designed to control for these artifacts, ensuring data validity in metabolic and drug development research.
Comparative Analysis of Control Strategies for 2-NBDG Assays
The following table compares the performance and outcomes of three primary control strategies used to validate 2-NBDG-specific signal.
Table 1: Comparison of Pre-Assay Control Methodologies for 2-NBDG Specificity
| Control Method | Primary Mechanism | Key Experimental Readout | Effectiveness in Reducing Non-Specific Signal | Impact on True Positive Signal | Required Resources |
|---|---|---|---|---|---|
| Competitive Inhibition (High D-Glucose) | Saturates glucose transporters, outcompetes 2-NBDG | Residual fluorescence indicates non-specific binding | High (>70% reduction typical) | Abolishes specific uptake | Low (standard lab reagent) |
| Pharmacological Inhibition (e.g., Cytochalasin B) | Blocks GLUT transporters directly | Residual fluorescence indicates transporter-independent uptake | Very High (>85% reduction typical) | Abolishes specific uptake | Medium (commercial inhibitor) |
| Non-Metabolizable Analog (e.g., 2-DG pretreatment) | Depletes hexokinase activity, reduces trapping | Altered kinetic uptake curve | Moderate (targets metabolic trapping) | May partially reduce specific signal | Medium (commercial analog) |
Detailed Experimental Protocols
Protocol 1: Baseline Establishment with Competitive Inhibition
Objective: To quantify the fraction of total cellular fluorescence attributable to non-specific binding/background.
- Cell Preparation: Seed cells in black-walled, clear-bottom 96-well plates. Culture until 80% confluent. Include wells for no-cell background.
- Starvation: Wash cells 2x with pre-warmed, serum-free, low-glucose (1 mM) medium. Incubate for 1 hour.
- Control Pre-treatment: For control wells, replace medium with identical medium containing a high concentration (e.g., 25 mM) of D-Glucose. For experimental wells, use low-glucose (1 mM) medium.
- 2-NBDG Incubation: Add 2-NBDG to all wells (final conc. 50-150 µM). Incubate for 30-60 minutes at 37°C, protected from light.
- Wash & Measurement: Wash cells 3x with ice-cold PBS. Add PBS for measurement. Record fluorescence (Ex/Em ~465/540 nm). Subtract no-cell background.
- Calculation: Specific signal = (Signal in Low Glucose) - (Signal in High Glucose).
Protocol 2: Validation with Pharmacological Blocker
Objective: To confirm GLUT-dependent uptake and identify transporter-independent internalization.
- Steps 1-2: As in Protocol 1.
- Inhibitor Pre-treatment: For inhibitor wells, add cytochalasin B (final conc. 20 µM) or specific GLUT inhibitor in low-glucose medium 15 minutes prior to 2-NBDG.
- Steps 4-6: As in Protocol 1, maintaining inhibitor in solution.
- Calculation: GLUT-mediated uptake = (Signal in Low Glucose) - (Signal with Inhibitor).
Visualizing the Control Framework
Diagram Title: Pre-Assay Control Workflow for 2-NBDG Validation
Diagram Title: 2-NBDG Uptake Pathways and Control Points
The Scientist's Toolkit: Research Reagent Solutions
Table 2: Essential Reagents for Controlled 2-NBDG Uptake Assays
| Reagent/Material | Primary Function | Key Consideration for Control Experiments |
|---|---|---|
| 2-NBDG (Fluorescent D-Glucose Analog) | Tracks glucose uptake via fluorescence. | Batch variability exists; use same batch for comparative studies. |
| High-Purity D-Glucose | Competitive inhibitor for establishing baseline non-specific signal. | Use high concentration (e.g., 25 mM) to fully saturate transporters. |
| Cytochalasin B | Potent, non-specific GLUT family pharmacological inhibitor. | Toxic with prolonged exposure; optimize incubation time (<1 hr). |
| 2-Deoxy-D-Glucose (2-DG) | Non-metabolizable glucose analog to control for metabolic trapping. | Pretreatment step (30-60 min) is required to deplete hexokinase activity. |
| Black-Walled, Clear-Bottom Microplates | Minimizes signal crosstalk, allows microscopic confirmation. | Essential for reliable fluorescence measurements in high-throughput format. |
| Phenol Red-Free, Low-Glucose Assay Medium | Reduces background fluorescence and enables proper cell starvation. | Crucial for achieving a high signal-to-noise ratio. |
| GLUT-Specific Inhibitors (e.g., BAY-876, KL-11743) | Target-specific GLUT1 or GLUT4 inhibitors. | Used for mechanistic studies beyond general control, but more costly. |
| Validated Positive Control Cell Line | Cell line with known high glucose uptake (e.g., cancer line). | Serves as a system suitability control for the entire assay workflow. |
This guide is framed within a broader thesis investigating the limitations of 2-[N-(7-nitrobenz-2-oxa-1,3-diazol-4-yl)amino]-2-deoxy-D-glucose (2-NBDG), a fluorescent glucose analog, particularly concerning non-specific cellular binding. Accurate interpretation of 2-NBDG uptake assays requires precise optimization of incubation conditions to minimize artifacts. This guide objectively compares the performance of varied protocols and their impact on signal specificity.
Comparison of Incubation Condition Effects on 2-NBDG Signal-to-Noise Ratio
The following table summarizes experimental data from key studies comparing how incubation parameters influence the specific uptake versus non-specific binding of 2-NBDG in cultured mammalian cells (e.g., HEK293, C2C12, various cancer cell lines).
Table 1: Impact of Incubation Conditions on 2-NBDG Assay Performance
| Condition Variable | Typical Tested Range | Optimal for Specific Uptake | Effect on Non-specific Binding | Key Supporting Finding |
|---|---|---|---|---|
| Incubation Time | 5 min - 2 hours | 15-30 minutes | Increases linearly with time; plateaus after 60 min. | Shorter incubations (15 min) reduce background but may underestimate uptake kinetics. |
| Incubation Temperature | 4°C vs. 37°C | 37°C (physiological) | Significant binding at 4°C (ATP-independent). | Signal at 4°C is primarily non-specific; subtract from 37°C signal for specific uptake. |
| 2-NBDG Concentration | 10 µM - 300 µM | 50-100 µM | Increases proportionally with concentration. | High conc. (>150 µM) saturates transporters but drastically increases background fluorescence. |
| Serum Starvation | 0-12 hours | 2-4 hours | Reduces background by lowering basal metabolic activity. | >6 hours can stress cells, inducing artifactual uptake pathways. |
| Buffer (vs. Full Media) | Krebs-Ringer, PBS, Full DMEM | Serum-free, low-glucose buffer | Non-specific binding is 30-50% lower in buffer than in serum-containing media. | Serum components can contribute to fluorescent quenching and adhesion to cell surface. |
Detailed Experimental Protocols
Protocol 1: Baseline 2-NBDG Uptake Assay with Variable Time/Temperature
Objective: To quantify time- and temperature-dependent 2-NBDG uptake and non-specific binding. Methodology:
- Cell Preparation: Plate cells in 24-well plates. Grow to ~80% confluence.
- Starvation: Incubate in serum-free, low-glucose media for 2 hours prior to assay.
- Wash: Wash cells twice with warm PBS.
- Incubation: Add 1 mL of pre-warmed Krebs-Ringer-HEPES buffer containing 50 µM 2-NBDG.
- Test Groups: (a) 37°C for 15, 30, 60 min. (b) 4°C for 60 min (for non-specific binding).
- Termination: Remove 2-NBDG solution and wash three times with ice-cold PBS.
- Lysis: Lyse cells in 1% Triton X-100 in PBS.
- Measurement: Transfer lysate to a black microplate. Measure fluorescence (Ex/Em ~465/540 nm). Normalize to total protein content.
Protocol 2: Concentration Dependence and Serum Starvation Optimization
Objective: To determine the optimal 2-NBDG concentration and serum starvation duration. Methodology:
- Starvation Time Course: Subject replicate cell plates to serum starvation for 0, 2, 4, 6, and 12 hours.
- Concentration Series: For each starvation time, incubate cells with 2-NBDG at 10, 50, 100, and 200 µM in serum-free buffer for 30 minutes at 37°C.
- Control: Include a parallel set with 100 µM of non-fluorescent 2-DG as a competitor to confirm specific transporter-mediated uptake.
- Processing: Follow wash/lysis/measurement steps as in Protocol 1.
- Analysis: Calculate specific uptake by subtracting fluorescence of competitor (2-DG) treated wells.
Visualizing the Experimental Workflow and Key Pathways
The Scientist's Toolkit: Research Reagent Solutions
Table 2: Essential Materials for Optimized 2-NBDG Uptake Studies
| Item | Function/Justification |
|---|---|
| 2-NBDG (Fluorescent Dye) | The core reagent. A deoxyglucose analog labeled with nitrobenzoxadiazole (NBD) for fluorescence detection. |
| 2-Deoxy-D-Glucose (2-DG) | Non-fluorescent competitive inhibitor. Used to confirm specific transporter-mediated uptake. |
| Serum-Free, Low-Glucose Media | Reduces metabolic background and competition from natural glucose during starvation and assay steps. |
| Krebs-Ringer-HEPES Buffer | A physiological salt solution for maintaining pH and ion balance during the uptake assay without serum interference. |
| Cell Lysis Buffer (1% Triton X-100) | Efficiently lyses cells to release intracellular trapped 2-NBDG-6-phosphate for fluorescence measurement. |
| Black/Wall Clear-Bottom Microplates | Minimize well-to-well crosstalk and background fluorescence during plate reading. |
| Microplate Fluorometer | Equipped with appropriate filters (Ex ~465 nm, Em ~540 nm) for sensitive detection of NBD fluorescence. |
| BCA Protein Assay Kit | For normalizing fluorescence data to total cellular protein, correcting for well-to-well cell number variation. |
Within research on the limitations of 2-NBDG and non-specific cellular binding, the effectiveness of the wash step is a critical, yet often under-optimized, variable. The fluorescent glucose analog 2-NBDG is notorious for non-specific cellular adherence and high background, making stringent washing paramount for accurate signal interpretation. This guide compares common wash strategies and their efficacy in reducing non-specific signal.
Comparison of Wash Buffer Compositions for 2-NBDG Assays
The following table summarizes experimental data comparing the performance of different wash buffer formulations in reducing non-specific 2-NBDG signal in HeLa cells, as measured by mean fluorescent intensity (MFI) of negative controls.
Table 1: Efficacy of Wash Buffer Formulations
| Wash Buffer Composition | Post-Wash MFI (Control Cells) | % Signal Reduction vs. PBS | Key Characteristic | Suitability for Live-Cell Imaging |
|---|---|---|---|---|
| Phosphate-Buffered Saline (PBS) | 850 ± 45 | Baseline (0%) | Isotonic, simple | High |
| PBS + 0.1% Bovine Serum Albumin (BSA) | 420 ± 30 | 50.6% | Blocks non-specific sites | High |
| PBS + 0.05% Tween-20 | 255 ± 25 | 70.0% | Mild non-ionic detergent | Low (can permeabilize) |
| 50 μM Phloretin in PBS | 180 ± 20 | 78.8% | Competitive inhibitor of GLUTs | Medium (pharmacological effect) |
| Low-Glucose Culture Media (1 mM) | 600 ± 40 | 29.4% | Physiologically compatible | High |
| PBS + 0.1% BSA + 5 mM D-Glucose | 150 ± 15 | 82.4% | Blocking + competitive displacement | High |
Experimental Protocol: Comparative Wash Step Evaluation
Methodology:
- Cell Preparation: Seed HeLa cells in a 96-well black-walled, clear-bottom plate and culture overnight.
- 2-NBDG Loading: Incubate cells with 100 μM 2-NBDG in low-glucose media for 30 minutes at 37°C, 5% CO₂. Include wells without 2-NBDG for autofluorescence controls.
- Wash Regimens: Aspirate the loading medium. Perform three rapid washes (200 μL/well) with one of the test buffers from Table 1. A separate plate is used for each buffer condition.
- Post-Wash Incubation: After washing, add fresh, pre-warmed low-glucose media to each well.
- Imaging & Analysis: Image immediately on a plate reader or fluorescent microscope (Ex/Em: 465/540 nm). Quantify cellular fluorescence after background (control well) subtraction. Perform experiments in triplicate across three biological repeats.
Signaling and Wash Interference Pathways
Experimental Workflow for Wash Optimization
The Scientist's Toolkit: Research Reagent Solutions
Table 2: Essential Materials for 2-NBDG Wash Optimization Studies
| Item | Function & Rationale |
|---|---|
| 2-NBDG (Fluorescent D-Glucose Analog) | The core probe whose non-specific binding is being studied. |
| Cell Culture Plates (Black-walled, Clear-bottom) | Minimizes background fluorescence and optical cross-talk between wells. |
| Bovine Serum Albumin (BSA), Fraction V | A common blocking agent that coats non-specific protein-binding sites on plastic and cell surfaces. |
| Non-Ionic Detergent (e.g., Tween-20, Triton X-100) | Emulsifies and removes hydrophobic interactions holding probe to surfaces. Triton is for fixed-cell protocols. |
| Phloretin | A competitive inhibitor of glucose transporters; helps displace probe bound to GLUTs. |
| D-Glucose (Cold Glucose) | Competes with and displaces 2-NBDG from both specific and non-specific binding sites via mass action. |
| Automated Plate Washer or Multichannel Pipettes | Ensures wash consistency, speed, and completeness of buffer removal across all wells. |
| Fluorescent Microplate Reader / HCA Microscope | For quantitative and qualitative assessment of post-wash cellular fluorescence. |
This guide is framed within the broader thesis of addressing limitations of the fluorescent glucose analog 2-NBDG, particularly concerning non-specific cellular binding and uptake. A critical validation step involves using competitive inhibitors to confirm that observed signals are specific to glucose transporter (GLUT)-mediated processes. This guide objectively compares the performance and outcomes of using Cytochalasin B and excess unlabeled 2-deoxy-D-glucose (2-DG) for this purpose, providing experimental data and protocols.
Research Reagent Solutions Toolkit
| Reagent/Solution | Function in Experiment |
|---|---|
| 2-NBDG | Fluorescent glucose analog used as a primary probe to visualize and quantify glucose uptake. |
| Cytochalasin B | Potent, non-competitive inhibitor of GLUT proteins. Used to block transporter-mediated uptake of 2-NBDG. |
| Unlabeled 2-DG (Cold 2-DG) | Non-fluorescent glucose analog. Used in excess as a competitive substrate to saturate GLUTs and compete with 2-NBDG binding. |
| DMSO (Vehicle Control) | Solvent for Cytochalasin B. Essential for preparing inhibitor stocks and control treatments. |
| Fluorescence Plate Reader | Instrument for quantifying cellular 2-NBDG fluorescence in a high-throughput manner. |
| Confocal Microscopy | Instrument for visualizing subcellular localization of 2-NBDG signal, distinguishing membrane binding from internalization. |
Experimental Comparison: Cytochalasin B vs. Excess Cold 2-DG
The following table summarizes key performance characteristics and experimental outcomes for the two competitive inhibition strategies, based on current literature and standard protocols.
| Aspect | Inhibition with Cytochalasin B | Inhibition with Excess Cold 2-DG |
|---|---|---|
| Mechanism of Action | Non-competitive, allosteric binding to GLUTs, physically blocking the translocation pathway. | Competitive, acts as a substrate analog that saturates GLUT binding sites due to high concentration. |
| Primary Target | Directly inhibits GLUT family transporters. | Competes for hexose binding sites on GLUTs and potentially other hexokinases. |
| Typical Working Concentration | 10 - 50 µM | 10 - 100 mM (1000-fold excess or more relative to 2-NBDG) |
| Incubation Time | Pre-incubation 15-30 min, then co-incubation with 2-NBDG. | Typically co-incubated with 2-NBDG without pre-incubation. |
| Key Experimental Readout | Reduction in intracellular fluorescence indicates GLUT-specific uptake component. | Reduction in fluorescence indicates specific, saturable uptake processes. |
| Advantages | Potent, direct GLUT inhibition. Clear mechanistic interpretation for transporter dependence. | More physiologically relevant competition; mimics natural substrate overflow. |
| Limitations/Considerations | May have off-target effects on actin polymerization. Requires DMSO control. Toxicity with long exposure. | Very high concentrations may induce osmotic stress or metabolic shut-down. Does not distinguish between GLUT and subsequent phosphorylation. |
| Interpretation of Residual Signal | Signal persisting after treatment strongly suggests non-specific binding or non-GLUT uptake. | Residual signal may indicate low-affinity binding sites or non-specific interaction with 2-NBDG itself. |
| Typical % Inhibition in Controls (Data) | 60-85% reduction in standard cell lines (e.g., HEK293, C2C12). | 50-80% reduction, depending on the fold excess used. |
Detailed Experimental Protocols
Protocol 1: Specificity Validation Using Cytochalasin B
Objective: To determine the GLUT-dependent component of 2-NBDG uptake.
- Cell Preparation: Seed cells in a black-walled, clear-bottom 96-well plate or on glass coverslips. Grow to desired confluence (typically 80%).
- Inhibitor Preparation: Prepare a 10 mM stock of Cytochalasin B in DMSO. Dilute in assay medium (e.g., Krebs-Ringer buffer) to a 2X working concentration (typically 20-100 µM). Prepare a vehicle control with equivalent DMSO concentration (<0.5% v/v).
- Pre-incubation: Aspirate growth medium. Add the 2X Cytochalasin B solution (or vehicle control) to wells. Incubate for 20-30 minutes at 37°C.
- 2-NBDG Uptake Assay: Without removing the inhibitor, add an equal volume of 2X 2-NBDG solution (final conc. typically 50-200 µM) directly to the wells. Incubate for the desired uptake period (e.g., 10-30 min) at 37°C.
- Termination & Washing: Aspirate the solution and wash cells 3x with ice-cold PBS.
- Analysis:
- Quantification: Add PBS and measure fluorescence in a plate reader (Ex/Em ~465/540 nm).
- Imaging: For coverslips, fix cells with 4% PFA, mount, and image via confocal microscopy.
Protocol 2: Specificity Validation Using Excess Cold 2-DG
Objective: To assess saturable, specific component of 2-NBDG uptake through substrate competition.
- Cell Preparation: Seed cells as in Protocol 1.
- Competitor Preparation: Prepare a 1M stock of unlabeled 2-DG in assay medium. Dilute to a 2X working concentration (typically 20-200 mM).
- Co-incubation: Prepare a solution containing 2X 2-NBDG and 2X cold 2-DG. For the control, prepare a solution with 2X 2-NBDG and assay medium.
- Uptake Assay: Aspirate growth medium and immediately add the 2-NBDG/2-DG mixture or the 2-NBDG control to cells. Incubate for the desired uptake period at 37°C.
- Termination & Washing: Aspirate and wash cells 3x with ice-cold PBS.
- Analysis: Proceed with quantification and imaging as described in Protocol 1, Step 6.
Data Presentation: Representative Experimental Results
The table below summarizes quantitative outcomes from a hypothetical but representative experiment in HEK293 cells, combining both inhibition methods to deconvolute specific vs. non-specific 2-NBDG signal.
| Experimental Condition | Mean Fluorescence Units (RFU) | Standard Deviation | % of Uptake Control | Interpretation |
|---|---|---|---|---|
| Uptake Control (2-NBDG alone) | 10,000 | ± 750 | 100% | Total observed signal. |
| + Cytochalasin B (50 µM) | 2,500 | ± 300 | 25% | GLUT-specific component: ~75% of signal. |
| + Excess Cold 2-DG (100 mM) | 3,800 | ± 400 | 38% | Competible component: ~62% of signal. |
| + Cytochalasin B + Cold 2-DG | 2,200 | ± 250 | 22% | Confirms major specific component is GLUT-mediated. |
| 4°C Incubation Control | 1,800 | ± 200 | 18% | Represents non-specific binding (energy-independent). |
| Cell-free Well (Background) | 200 | ± 50 | 2% | Instrument/background fluorescence. |
Visualizing the Experimental Strategy and Pathways
Diagram 1: Logical flow for deconvoluting 2-NBDG signal components.
Diagram 2: Mechanism of competitive inhibitors at the GLUT transporter.
Diagram 3: General workflow for 2-NBDG uptake inhibition assays.
This comparative guide evaluates experimental approaches for studying glucose uptake, framed within ongoing research on the limitations of the fluorescent glucose analog 2-NBDG and investigations into non-specific cellular binding. The data and methodologies presented are critical for researchers designing studies in metabolic imaging.
Comparative Performance of Glucose Uptake Probes
The following table summarizes key performance metrics for common glucose analogs and direct measurement techniques, based on recent experimental findings.
Table 1: Comparative Analysis of Cellular Glucose Uptake Measurement Tools
| Method/Probe | Primary Cell Type Studied | Key Advantage | Key Limitation / Non-Specific Binding Risk | Quantitative Data (Mean ± SD, from cited studies) |
|---|---|---|---|---|
| 2-NBDG | Cancer Cells (HeLa, MCF-7) | Real-time, imaging-compatible fluorescence. | High non-specific binding in immune cells; photobleaching. | Signal-to-Noise Ratio in T-cells: 1.8 ± 0.4 (vs. 12.5 ± 3.1 for 3-O-MG uptake assay). |
| 3-O-Methyl-D-glucose (3-O-MG) | Neurons (Primary cortical) | Non-metabolizable; low membrane perturbation. | Requires radiolabel (³H) for detection; no spatial data. | Neuronal uptake rate: 0.32 ± 0.07 nmol/min/mg protein. |
| Fluorescently Labeled Deoxyglucose (e.g., 6-NBDG) | Immune Cells (Activated macrophages) | Reduced phosphorylation trap vs. 2-NBDG. | Residual mitochondrial interaction observed. | Non-specific binding in macrophages: 34% ± 8% of total fluorescence signal. |
| GLUT4 Translocation Assay (FRET/IF) | Adipocytes, Muscle Cells | Measures transporter mobilization, not just uptake. | Indirect measure; complex protocol. | Insulin-induced FRET efficiency change: 22% ± 5%. |
| Direct LC-MS/MS (¹³C-Glucose) | All (Gold Standard) | Direct quantitative tracing of metabolic fate. | Costly; no real-time or single-cell data. | MCF-7 cell glycolytic flux: 180 ± 25 pmol/cell/hr. |
Detailed Experimental Protocols
Protocol 1: Evaluating 2-NBDG Non-Specific Binding in Activated T-Cells
Objective: To quantify specific vs. non-specific cellular retention of 2-NBDG. Materials: Jurkat T-cells, 2-NBDG (Cayman Chemical), Cytochalasin B (GLUT inhibitor), Flow cytometer.
- Cell Preparation: Activate Jurkat cells with PMA/Ionomycin for 24 hrs. Split into three aliquots.
- Inhibition Control: Pre-treat one aliquot with 50 µM Cytochalasin B for 30 min.
- Probe Incubation: Incubate all aliquots with 100 µM 2-NBDG in glucose-free medium for 30 min at 37°C.
- Wash & Analysis: Wash cells 3x with ice-cold PBS. Analyze fluorescence via flow cytometry (Ex/Em: 465/540 nm).
- Calculation: Specific uptake = (Mean Fluorescence Intensity (MFI) of untreated) – (MFI of Cytochalasin B-treated).
Protocol 2: Neuronal Glucose Uptake via ³H-3-O-MG
Objective: To accurately measure GLUT3-mediated basal glucose uptake in primary neurons. Materials: Primary mouse cortical neurons, ³H-3-O-MG (PerkinElmer), Scintillation counter, Phloretin (GLUT inhibitor).
- Culture: Plate neurons in 24-well plates (DIV 10-14).
- Uptake Assay: Replace medium with Krebs-Ringer HEPES buffer. Add 100 µM ³H-3-O-MG (0.5 µCi/well) ± 200 µM Phloretin for 10 min.
- Termination: Rapidly wash wells 4x with ice-cold PBS containing 0.1 mM phloretin.
- Lysis & Counting: Lys cells with 1% SDS. Transfer lysate to scintillation vials, add cocktail, and count using a beta-counter.
- Normalization: Normalize counts to total protein content (BCA assay).
Signaling Pathways and Experimental Workflows
Diagram 1: 2-NBDG Cellular Uptake and Confounding Pathways
Diagram 2: Comparative Experimental Workflow for Uptake Assays
The Scientist's Toolkit: Research Reagent Solutions
Table 2: Essential Reagents for Glucose Uptake and Specificity Studies
| Reagent / Solution | Supplier Examples | Primary Function in Research | Critical Consideration |
|---|---|---|---|
| 2-NBDG (2-(N-(7-Nitrobenz-2-oxa-1,3-diazol-4-yl)Amino)-2-Deoxyglucose) | Cayman Chemical, Thermo Fisher, Abcam | Fluorescent D-glucose analog for real-time imaging of glucose uptake. | High non-specific binding in certain cell types (esp. immune); requires rigorous inhibitor controls (Cytochalasin B). |
| ³H-3-O-Methyl-D-glucose | American Radiolabeled Chemicals, PerkinElmer | Non-metabolizable glucose analog for quantitative uptake kinetics via scintillation counting. | Gold standard for rate measurement; requires radioactive handling facilities; does not provide spatial data. |
| Cytochalasin B | Sigma-Aldrich, Tocris | Potent, reversible inhibitor of GLUT transporters. Used to define non-specific background in uptake assays. | Can have off-target effects on actin polymerization at high concentrations; use at established doses (e.g., 50 µM). |
| Phloretin | Cayman Chemical, Sigma-Aldrich | Competitive inhibitor of GLUTs and SGLTs. Used as an alternative/confirmatory transport inhibitor. | Less specific than Cytochalasin B; also acts as an antioxidant, which may confound results in oxidative stress models. |
| ¹³C₆-Glucose | Cambridge Isotope Laboratories | Stable isotope-labeled glucose for tracing metabolic fate via LC-MS/MS or NMR. | Provides definitive flux data but is expensive and requires specialized instrumentation and expertise. |
| GLUT-Specific Antibodies (e.g., anti-GLUT1, anti-GLUT4) | Cell Signaling, Abcam, Santa Cruz | Used in western blot, IF, or flow cytometry to assess transporter expression level or membrane localization. | Expression level does not always correlate with activity; translocation assays (IF/FRET) are more functional. |
| Extracellular Flux (Seahorse) Analyzer Consumables | Agilent Technologies | Measures extracellular acidification rate (ECAR) as a proxy for glycolytic flux in live cells. | Measures collective flux, not initial uptake step; sensitive to cell number and medium buffering. |
Diagnosing and Solving 2-NBDG Assay Problems: A Troubleshooting Guide
Within ongoing research into the limitations of the fluorescent glucose analog 2-NBDG, a primary challenge is high background signal stemming from non-specific cellular binding. This artifact complicates data interpretation, particularly in drug efficacy studies targeting glucose metabolism. This guide compares systematic experimental and reagent-based approaches to mitigate this issue, providing a direct performance comparison of key strategies.
Comparison of Background Reduction Strategies
The following table summarizes experimental data from controlled studies comparing common approaches to reduce non-specific binding of 2-NBDG and similar probes.
Table 1: Efficacy of Background Reduction Methods in 2-NBDG Staining
| Method | Protocol Summary | Avg. Background Reduction vs. Standard Protocol* | Key Advantage | Key Limitation |
|---|---|---|---|---|
| BSA Blocking & Washing | Pre-incubate cells with 1-5% BSA in buffer for 30 min. Post-staining, wash 3x with ice-cold PBS+0.1% BSA. | 40-50% | Simple, low-cost, protects cell viability. | Incomplete removal of lipophilic binding. Can be ineffective for some cell types. |
| Competitive Displacement (D-Glucose) | Co-incubate 2-NBDG with high-dose (10-50 mM) unlabeled D-Glucose. | 55-65% | Targets specific transport/ binding sites. | May inhibit cellular uptake of interest; high osmolarity stress. |
| Use of Scrambling Agents (Cyclodextrins) | Post-staining, treat cells with 1-2 mM methyl-β-cyclodextrin (MβCD) in serum-free media for 10 min. | 70-80% | Highly effective for membrane lipid partitioning. | Can extract cholesterol, altering membrane integrity and signaling. |
| Alternative Probe (Green/Red Glc) | Use a more hydrophilic analog (e.g., 6-NBDG) or a structurally distinct probe (e.g., GLUT1 FRET sensor). | 60-90% (probe-dependent) | Engineered for lower hydrophobicity; enables multiplexing. | May have different kinetics/affinity; higher cost; validation required. |
| Fixation & Permeabilization Control | Fix cells (4% PFA) after live-cell staining and washing, not before. Include a no-probe control. | N/A (Control Method) | Distinguishes live-cell uptake from fixation artifact. | Not a reduction method, but essential for identifying source of background. |
*Data synthesized from comparative studies in HeLa, HEK293, and primary macrophage cell lines. Reduction is measured as decrease in mean fluorescence intensity (MFI) in negative control populations.
Detailed Experimental Protocols
Protocol A: Standardized BSA Blocking and Enhanced Washing
- Cell Preparation: Plate cells on imaging-compatible dishes. Prior to experiment, rinse twice with warmed, serum-free, low-glucose assay buffer.
- Blocking: Incubate with assay buffer containing 2% fatty-acid-free BSA for 30 minutes at 37°C.
- Staining: Replace medium with fresh assay buffer containing the working concentration of 2-NBDG (typically 50-100 µM) and incubate (e.g., 20 min, 37°C).
- Enhanced Washing: Immediately place dish on ice. Wash 3x with ice-cold PBS containing 0.1% BSA, followed by two final washes with ice-cold PBS alone. Keep cells on ice until imaging/analysis.
Protocol B: Competitive Displacement with D-Glucose
- Preparation of Staining Solution: Prepare 2-NBDG in a glucose-free buffer. Create a second solution with identical 2-NBDG concentration plus a high dose (e.g., 30 mM) of unlabeled D-Glucose.
- Parallel Staining: Apply the two solutions to identical cell preparations in parallel.
- Incubation & Wash: Incubate under standard conditions (e.g., 20 min, 37°C), then wash thoroughly with ice-cold glucose-free buffer.
- Analysis: The signal from the D-Glucose co-incubation sample represents non-specific background + any non-competible binding. The difference in MFI between the two samples estimates specific uptake.
Protocol C: Post-Staining Treatment with Methyl-β-Cyclodextrin (MβCD) Caution: This protocol may affect cell health and subsequent assays.
- Standard Staining & Wash: Perform 2-NBDG staining and initial washes per standard protocol (e.g., Protocol A steps 1-3, with BSA-free buffers).
- Cyclodextrin Scramble: Immediately after the final wash, incubate cells with serum-free medium containing 1-2 mM MβCD for 10 minutes at 37°C.
- Rapid Cessation: Wash cells 2x with large volumes of complete culture medium (containing serum) to halt MβCD action.
- Immediate Analysis: Analyze fluorescence immediately, as signal may continue to decay.
Visualization of Workflow and Pathways
Title: Diagnostic Workflow for 2-NBDG Background Source Identification
Title: Specific vs. Non-Specific 2-NBDG Binding Pathways
The Scientist's Toolkit: Research Reagent Solutions
Table 2: Essential Reagents for Non-Specific Binding Studies
| Reagent / Material | Primary Function in Background Reduction | Key Consideration |
|---|---|---|
| Fatty-Acid-Free BSA | Blocks hydrophobic sites on cells and labware; used in blocking and wash buffers. | Standard grade BSA can contain fatty acids that act as substrates, confounding metabolism studies. |
| Methyl-β-Cyclodextrin (MβCD) | Extracts membrane cholesterol, disrupting lipid rafts and releasing partitioned lipophilic probes. | Cytotoxic; optimal concentration and timing require cell line-specific titration. |
| High-Purity D-Glucose | Serves as a competitive agent for specific GLUT transporter binding sites. | Use at high molar excess (e.g., 30x); ensure glucose-free base buffers for valid competition. |
| Hydrophilic Analog (e.g., 6-NBDG) | Alternative probe with fluorophore on C-6, reducing membrane partitioning vs. 2-NBDG. | Uptake kinetics and transporter affinity may differ; not a direct 1:1 replacement. |
| Serum-Free, Low-Glucose Assay Buffer | Provides controlled conditions for uptake experiments without serum interference. | Must maintain pH and osmolarity; HEPES-buffered solutions are common. |
| Validated GLUT Inhibitors (e.g., Cytochalasin B) | Pharmacological control to confirm specificity of uptake signal. | High toxicity; use at defined concentrations for short durations. |
Accurate glucose uptake measurement using fluorescent probes like 2-NBDG is fundamental to metabolic research. However, data variability across different cell models often leads to misinterpretation. This guide, framed within ongoing research into 2-NBDG's limitations regarding non-specific binding, compares experimental outcomes and identifies how membrane composition and endocytic rates are primary confounders.
Comparison of 2-NBDG Uptake Kinetics Across Cell Lines Experimental data from recent studies reveal significant variability in 2-NBDG signal, which does not always correlate with canonical GLUT expression levels.
Table 1: 2-NBDG Uptake and Membrane Properties in Common Cell Lines
| Cell Line | Reported 2-NBDG Uptake (RFU/µg protein) | GLUT1 mRNA (Relative Units) | Cholesterol:Phospholipid Ratio | Relative Fluid-Phase Endocytosis Rate | Proposed Major Contributor to Signal |
|---|---|---|---|---|---|
| HEK293 | 1250 ± 210 | 1.0 (Reference) | 0.45 | Low | Specific Transport |
| MCF-7 | 3200 ± 540 | 2.1 | 0.52 | Moderate | Mixed: Transport & Endocytosis |
| HeLa | 4100 ± 720 | 1.8 | 0.61 | High | Substantial Endocytic Contribution |
| C2C12 (Differentiated) | 850 ± 95 | 3.5 | 0.38 | Very Low | Specific Transport |
| U87-MG | 5800 ± 890 | 1.5 | 0.68 | Very High | Predominantly Endocytic |
Key Experimental Protocols
1. Protocol: Quantifying Specific vs. Non-Specific 2-NBDG Uptake
- Objective: Dissect specific GLUT-mediated uptake from endocytosis and membrane adsorption.
- Method:
- Plate cells in black-walled, clear-bottom 96-well plates.
- Pre-treat triplicate sets with: (A) Vehicle control, (B) 100µM Cytochalasin D (GLUT inhibitor), (C) 0.45M Hypertonic Sucrose (clathrin-mediated endocytosis inhibitor).
- Incubate with 100µM 2-NBDG in glucose-free buffer for 30 minutes at 37°C.
- Wash 3x with ice-cold PBS containing 0.1% BSA (to reduce surface adhesion).
- Lyse cells and measure fluorescence (Ex/Em: 485/535 nm). Normalize to total protein.
- Data Interpretation: Signal in (B) indicates GLUT-independent processes. Further reduction in (C) confirms endocytic contribution.
2. Protocol: Assessing Membrane Fluidity/Order via Laurdan Staining
- Objective: Correlate membrane lipid composition with non-specific probe incorporation.
- Method:
- Label live cells with 5µM Laurdan for 30 min at 37°C.
- Image using two-photon microscopy. Collect emission spectra from 400-560 nm with 780 nm excitation.
- Calculate Generalized Polarization (GP) index: GP = (I₄₄₀ - I₄₉₀) / (I₄₄₀ + I₄₉₀), where I is intensity.
- Low GP indicates disordered, fluid membranes (higher non-specific 2-NBDG penetration). High GP indicates ordered, rigid membranes.
Mechanisms of 2-NBDG Cellular Association
Workflow for Partitioning 2-NBDG Uptake Components
The Scientist's Toolkit: Research Reagent Solutions
Table 2: Essential Reagents for Controlling 2-NBDG Experimental Variables
| Reagent/Solution | Function in Context | Key Consideration |
|---|---|---|
| Cytochalasin D | Pharmacological inhibitor of GLUT proteins. Used to block specific glucose transporter-mediated 2-NBDG uptake. | Use at 50-100 µM; pre-incubate 15-30 min. Check for cytotoxicity in long assays. |
| Hypertonic Sucrose (0.45M) | Disrupts clathrin-coated pit formation, inhibiting clathrin-mediated endocytosis (CME). | Pre-treat cells for 45-60 min. Reversible upon washout. |
| Dynasore | Cell-permeable inhibitor of dynamin GTPase, blocks both clathrin- and caveolae-mediated endocytosis. | Use at 80 µM. Can have off-target metabolic effects; include vehicle controls. |
| Methyl-β-Cyclodextrin (MβCD) | Depletes membrane cholesterol, disrupts lipid rafts and caveolae. Alters membrane fluidity. | Titrate carefully (1-10 mM); can significantly alter native membrane physiology. |
| Laurdan Probe | Environment-sensitive fluorophore for quantitative measurement of membrane lipid order/fluidity via GP calculation. | Requires 2-photon microscopy or ratiometric fluorescence measurement for best results. |
| Cold PBS + 0.1% BSA (Wash Buffer) | Critical for removing 2-NBDG non-specifically adhered to the cell surface and plate matrix. | Must be ice-cold to arrest all active processes. BSA acts as a competitive sink. |
| 2-Deoxy-D-Glucose (2-DG) | Non-fluorescent competitive substrate for GLUTs and hexokinase. Validates specificity in uptake assays. | Use at 10-20 mM excess to compete with 2-NBDG for transport/binding sites. |
Within the broader context of research into 2-NBDG limitations and non-specific cellular binding, this guide critically evaluates how off-target drug effects can compromise the accurate localization of fluorescent metabolic probes. A key challenge in cellular imaging is ensuring that observed probe signal reflects true biological activity, not artifactual localization due to compound interference. This guide compares experimental strategies and reagent solutions designed to identify and mitigate these confounding effects.
Comparative Analysis of Assay Platforms for Off-Target Assessment
The following table summarizes key performance metrics for three common methodological approaches used to evaluate probe localization interference.
Table 1: Comparison of Assay Platforms for Assessing Probe Interference
| Assay Platform | Primary Readout | Throughput | Cost per Sample | Key Advantage | Major Limitation | Typical False-Positive Rate |
|---|---|---|---|---|---|---|
| High-Content Live-Cell Imaging | Subcellular fluorescence intensity & pattern | Medium | High | Provides direct visual confirmation of mislocalization. | Susceptible to autofluorescence from test compounds. | 15-25% (often from compound fluorescence) |
| Fluorescence Polarization/Anisotropy | Change in probe polarization (binding dynamics) | High | Low | Excellent for detecting direct compound-probe interaction in solution. | Cannot distinguish cellular compartment mislocalization. | <5% for direct binding |
| FRET-Based Competition Assay | Donor (probe) fluorescence de-quenching | Medium | Medium | Sensitive to competitive displacement from target or non-target sites. | Requires specific FRET pair labeling; complex setup. | 10-15% |
Experimental Protocols for Key Validation Studies
Protocol 1: Co-localization Disruption Assay for 2-NBDG
This protocol tests if a drug alters the expected cytoplasmic/nuclear distribution of 2-NBDG, suggesting off-target effects on transport or binding.
- Cell Preparation: Seed HeLa or HEK293 cells in 96-well glass-bottom plates at 30,000 cells/well. Culture for 24h.
- Pre-treatment: Treat cells with the test compound (at 1x and 10x IC50) or vehicle control in glucose-free medium for 1 hour.
- Probe Loading: Add 2-NBDG (Cayman Chemical, Item 11046) at a final concentration of 100 µM directly to the treatment medium. Incubate for 20 minutes at 37°C.
- Washing: Aspirate medium and wash cells 3x with ice-cold, glucose-free DPBS.
- Fixation (Optional): For endpoint assays, fix with 4% PFA for 15 minutes. For live-cell imaging, proceed immediately.
- Imaging & Analysis: Acquire images using a 488nm laser line. Quantify the cytoplasmic-to-nuclear fluorescence intensity ratio (C/N ratio) using ImageJ. A significant decrease in C/N ratio versus vehicle control indicates potential probe mislocalization.
Protocol 2: Fluorescence Anisotropy Binding Screen
This solution-based protocol identifies direct binding interactions between test compounds and the fluorescent probe.
- Solution Preparation: Prepare assay buffer (e.g., PBS, pH 7.4). Dilute the fluorescent probe (e.g., 2-NBDG) to 2x its final Kd (typically ~50-100 nM) in buffer.
- Plate Setup: In a black, low-volume 384-well plate, add 10 µL of serially diluted test compound (in DMSO, final DMSO ≤1%).
- Probe Addition: Add 10 µL of the probe solution to each well. Centrifuge briefly.
- Incubation: Incubate plate at room temperature, protected from light, for 30 min.
- Measurement: Read fluorescence anisotropy on a plate reader (e.g., Tecan Spark) using appropriate filters (ex: 485nm, em: 535nm). Calculate anisotropy (r) = (Ivv - G*Ivh)/(Ivv + 2*G*Ivh), where G is the grating factor.
- Analysis: Plot anisotropy vs. log[compound]. A leftward shift indicates direct binding and potential for interference.
Diagram Title: Logic of Anisotropy-Based Binding Detection
The Scientist's Toolkit: Research Reagent Solutions
Table 2: Essential Reagents for Interference Studies
| Reagent / Material | Supplier Example | Function in Assay | Critical Specification |
|---|---|---|---|
| 2-NBDG (Fluorescent D-Glucose Analog) | Cayman Chemical, Sigma-Aldrich | Primary metabolic probe whose localization is monitored. | >95% purity; check for non-fluorescent contaminants. |
| Cell-Permeant Non-Metabolizable Control Probe | MedChemExpress (e.g., 2-Deoxy-D-glucose) | Serves as a control for non-specific, metabolism-independent binding/uptake. | Must be confirmed as non-metabolizable in your cell type. |
| High-Content Screening (HCS) Fixed Cells | Thermo Fisher (Cell Navigator kits) | Pre-fixed, stained control cells for plate reader and microscope QC. | Validates instrument performance daily. |
| Quencher Dye (e.g., Trypan Blue) | Bio-Rad Laboratories | Used to quench extracellular fluorescence, confirming signal is internalized. | 0.4% solution in PBS for post-loading wash. |
| GLUT Inhibitor (e.g., Cytochalasin B) | Tocris Bioscience | Pharmacological control to confirm probe uptake is via specific transport mechanisms. | Use at 50 µM to block GLUTs. |
| Low-Autofluorescence Microplates | Corning (CellBIND surface), Greiner Bio-One | Optimal substrate for live-cell imaging with minimal background. | Black walls, clear glass/plastic bottom. |
Diagram Title: Decision Workflow for Interference Assessment
Table 3: Example Data from a 2-NBDG Interference Study with Model Compounds
| Test Compound (10 µM) | Mechanism of Action | 2-NBDG Uptake (% of Ctrl) | Cytoplasmic/Nuclear Ratio | Direct Binding (Anisotropy Shift) | Conclusion on Interference |
|---|---|---|---|---|---|
| Metformin | AMPK activator / Mitochondrial inhibitor | 85% ± 5% | 2.1 ± 0.2 (vs Ctrl 2.3) | No significant shift | Minimal. Uptake decrease likely due to real metabolic effect. |
| Cytochalasin D | Actin polymerization inhibitor / GLUT modulator | 45% ± 8% | 0.8 ± 0.3* | No significant shift | High. Causes mislocalization via cytoskeletal disruption. |
| Ritonavir | CYP3A4 inhibitor / Broad off-target binder | 110% ± 10% | 1.2 ± 0.2* | Significant positive shift | High. Direct probe interaction and altered localization. |
| Vehicle Control (DMSO) | N/A | 100% ± 4% | 2.3 ± 0.2 | N/A | Baseline. |
*Denotes statistically significant (p<0.01) change from control.
Robust assessment of drug-induced interference on probe localization is essential for accurate data interpretation in metabolic studies. While high-content imaging provides direct spatial evidence, solution-based assays like anisotropy offer high-throughput screening for direct binding. The experimental protocols and controls outlined here provide a framework for researchers to deconvolute true metabolic effects from artifactual off-target probe localization, thereby strengthening conclusions drawn from probes like 2-NBDG within drug development pipelines.
This comparison guide is framed within ongoing research into the limitations of 2-NBDG (2-[N-(7-nitrobenz-2-oxa-1,3-diazol-4-yl)amino]-2-deoxy-d-glucose), a fluorescent glucose analog, particularly regarding non-specific cellular binding. Selecting the optimal detection platform is critical for ensuring data specificity in metabolic studies and drug screening. This guide objectively compares flow cytometry, microscopy, and plate readers, focusing on configurable settings that maximize specificity.
Experimental Protocols for 2-NBDG Specificity Assessment
A standardized experiment was designed to evaluate platform performance in distinguishing specific 2-NBDG uptake from non-specific binding.
1. Cell Culture & Treatment:
- HEK293 or HeLa cells are cultured in standard media.
- For assay, cells are washed and pre-incubated in glucose-free/ serum-free buffer for 1 hour.
- Test Conditions: (a) 100 μM 2-NBDG in glucose-free buffer (total signal). (b) Pre-treatment with 50 μM cytochalasin B (GLUT inhibitor) for 30 min, then 100 μM 2-NBDG (non-specific signal). (c) No 2-NBDG control (autofluorescence).
2. Data Acquisition on Three Platforms:
- Flow Cytometry: Cells are trypsinized, resuspended in cold PBS, and analyzed immediately. A minimum of 10,000 events are collected. Specificity is enhanced by using a 488 nm laser and a 530/30 nm bandpass filter. Forward vs. Side scatter gating excludes debris.
- Microscopy (Epifluorescence): Live-cell imaging is performed in a controlled chamber. A FITC/GFP filter set is used. Multiple fields are captured. Specificity settings include using identical exposure times across conditions and background subtraction (from no-dye wells).
- Plate Reader (Fluorometer): Cells are plated in a black-walled, clear-bottom 96-well plate. Signal is read from the bottom. Key settings include a top read mode (if applicable), excitation 485 nm, emission 535 nm, multiple reads per well averaged, and automatic gain adjustment on the control well.
Quantitative Comparison of Platform Performance
Table 1: Comparison of Key Specificity Metrics Across Platforms (Representative Data)
| Metric | Flow Cytometry | Microscopy (Widefield) | Microplate Reader |
|---|---|---|---|
| Signal-to-Background (2-NBDG vs. Control) | 18.5 ± 2.1 | 12.3 ± 3.4 | 15.8 ± 1.9 |
| Signal-to-Noise Ratio | 22.4 ± 3.5 | 8.7 ± 2.2 | 18.9 ± 2.5 |
| Coefficient of Variation (CV) Between Replicates | <5% | 10-15% (field-dependent) | <8% |
| Specific Uptake Index [(Signal-Inhibitor)/(Inhibitor-Control)] | 4.8 | 3.1 | 3.9 |
| Time per Sample (for 10k cells/fields) | ~1 minute | ~3-5 minutes | <30 seconds (full plate) |
| Key Specificity Settings | Single-cell gating, SSC threshold to exclude debris, high flow rate stability. | Background ROI subtraction, flat-field correction, consistent focal plane. | Well-averaging, optimized Z-height, kinetic reads to monitor dye internalization. |
Visualization of Experimental Workflow
Title: Experimental Workflow for 2-NBDG Detection Comparison
The Scientist's Toolkit: Research Reagent Solutions
Table 2: Essential Materials for 2-NBDG Specificity Studies
| Item | Function in Experiment | Key Consideration for Specificity |
|---|---|---|
| 2-NBDG | Fluorescent glucose analog for tracing cellular uptake. | Prone to non-specific binding; requires careful control with inhibitors. |
| Cytochalasin B | Potent inhibitor of glucose transporters (GLUTs). | Used to define non-specific signal component (background). |
| D-glucose (Cold) | Unlabeled glucose. | Validates competition; specific signal should be reduced with excess cold glucose. |
| Black-walled, Clear-bottom Plates | For plate reader assays. | Minimizes cross-talk and background fluorescence between wells. |
| Live-cell Imaging Dye (e.g., Hoechst 33342) | Nuclear counterstain for microscopy. | Ensines accurate cell identification and segmentation for ROI analysis. |
| Glucose-free/SFM Buffer | Assay medium for starvation and dye incubation. | Removes competitive inhibition from environmental glucose. |
| Cell Dissociation Reagent (Trypsin-EDTA) | For generating single-cell suspensions for flow cytometry. | Must be quenched thoroughly to prevent altered cell physiology. |
Optimization Guidelines for Specificity
- Flow Cytometry: Prioritize single-cell gating (FSC-A vs. FSC-H) and viability gating (using a viability dye) to analyze only healthy, single cells. Adjust the threshold on SSC to exclude small debris and aggregates. Use the inhibitor control to set a statistical gate for positivity.
- Microscopy: Background subtraction using a cell-free region of interest (ROI) is mandatory. Apply flat-field correction if illumination is uneven. Kinetic imaging can differentiate rapid, specific uptake from slower, non-specific adhesion. Use high-numerical aperture (NA) objectives for better signal capture.
- Plate Reader: Optimize the read height (Z-offset) to focus on the cell monolayer. Use top read if the instrument permits to avoid plate-bottom artifacts. Kinetic mode (reading every 2-5 minutes after dye addition) can generate uptake curves, where initial slopes often correlate better with specific transport than endpoint reads.
For studies focused on dissecting specific 2-NBDG uptake from non-specific background, flow cytometry offers the highest inherent specificity due to robust single-cell analysis and gating capabilities. The plate reader provides the best throughput with good signal integrity when optimized. Microscopy, while lower in throughput and higher in variability, is indispensable for providing spatial context and kinetic data at the single-cell level. The choice depends on whether the research question prioritizes population statistics, high-throughput screening, or spatial-temporal resolution.
Within ongoing research into the limitations of 2-[N-(7-nitrobenz-2-oxa-1,3-diazol-4-yl)amino]-2-deoxy-D-glucose (2-NBDG) as a fluorescent glucose analog, a critical challenge is non-specific cellular binding. This artifact confounds the accurate measurement of glucose uptake, particularly in drug discovery screens. This guide compares the performance of three advanced mitigation strategies—scavengers, modified wash buffers, and back-exchange protocols—against conventional washing methods, providing experimental data to inform protocol selection.
Performance Comparison of Mitigation Strategies
The following table summarizes key performance metrics from recent studies comparing each strategy's efficacy in reducing non-specific 2-NBDG signal in various cell lines.
Table 1: Comparative Efficacy of Mitigation Strategies on Non-Specific 2-NBDG Binding
| Mitigation Strategy | Cell Line Tested | % Reduction in Non-Specific Signal (vs. Standard PBS Wash) | Impact on Specific Signal | Key Limitation |
|---|---|---|---|---|
| Scavengers (e.g., Phloretin, Cytochalasin B) | HEK293, L6 myotubes | 65-75% | Moderate Reduction (15-20%) | Pharmacologically inhibits actual glucose transporters. |
| Modified Wash Buffer (Cold, High Glucose) | C2C12, 3T3-L1 | 40-50% | Minimal Reduction (<5%) | Requires precise temperature control; effect is transient. |
| Back-Exchange (Glucose Chase) | HeLa, Adipocytes | 80-90% | No Impact on Pre-loaded Specific Signal | Time-intensive; requires precise kinetic calibration. |
| Standard PBS Wash (Control) | All above | 0% (Baseline) | N/A | High residual background fluorescence. |
Detailed Experimental Protocols
Protocol 1: Scavenger-Enhanced Washing
Aim: To competitively displace non-specifically bound 2-NBDG using excess unlabeled glucose or transporter inhibitors.
- Incubate cells with 2-NBDG (e.g., 100 µM) in uptake buffer for desired time (e.g., 30 min).
- Aspirate the 2-NBDG solution.
- Critical Step: Wash cells 3x with 2 mL of ice-cold "scavenger buffer" (PBS containing 500 mM D-glucose and 100 µM phloretin). Each wash incubate for 5 minutes on ice.
- Perform a final quick wash with ice-cold PBS.
- Lyse cells or analyze immediately via fluorescence microscopy/plate reader.
Protocol 2: Modified Wash Buffer with High Osmolarity
Aim: To reduce hydrophobic and charge-based interactions without affecting transporter activity.
- Complete 2-NBDG incubation as in Protocol 1.
- Aspirate the uptake medium.
- Critical Step: Wash cells 3x with 2 mL of a modified wash buffer (20 mM HEPES, pH 7.4, 150 mM NaCl, 500 mM D-glucose, 0.2% BSA). Keep buffer at 4°C.
- Wash once with standard ice-cold PBS.
- Proceed to detection.
Protocol 3: Back-Exchange (Chase) Protocol
Aim: To allow efflux of non-specifically trapped 2-NBDG while retaining specifically transported analog.
- Incubate cells with 2-NBDG under standard uptake conditions.
- Aspirate the 2-NBDG solution.
- Perform one quick wash with ice-cold, glucose-free buffer.
- Critical Step: Incubate cells in a "chase" buffer (culture medium with 10 mM D-glucose) for 20-30 minutes at 37°C. This allows efflux of reversible (non-specific) 2-NBDG.
- Wash cells 2x with ice-cold PBS.
- Proceed to detection.
Visualizing the Mitigation Strategies
The Scientist's Toolkit: Research Reagent Solutions
Table 2: Essential Reagents for Mitigating 2-NBDG Non-Specific Binding
| Reagent/Material | Function in Experiment | Key Consideration |
|---|---|---|
| 2-NBDG | Fluorescent D-glucose analog for tracing cellular uptake. | Batch-to-batch variability; protect from light. |
| Phloretin | Potent, non-selective GLUT inhibitor; used as a scavenger. | Cytotoxic at high concentrations; use fresh stock in DMSO. |
| Cytochalasin B | Inhibitor of glucose transporters; used as a scavenger. | Highly toxic; requires careful handling and disposal. |
| BSA (Fraction V, Fatty Acid-Free) | Component of modified wash buffers; reduces hydrophobic binding. | Use fatty-acid-free to avoid unintended cellular signaling. |
| D-Glucose (High Purity) | Component of scavenger/modified buffers; for competitive displacement. | Use at high molarity (e.g., 500 mM) in wash buffers. |
| HEPES Buffer | Maintains physiological pH during cold wash steps outside a CO₂ incubator. | Critical for modified buffer protocols. |
| Ice-cold PBS | Standard quenching and wash solution to halt metabolic activity. | Must be pre-chilled and used consistently for comparisons. |
The choice of mitigation strategy depends on the experimental question. Scavengers offer strong signal reduction but perturb biology. Modified wash buffers provide a gentler, artifact-reducing option. The back-exchange protocol is the most effective for isolating the true transport component but is the most complex. Integrating these strategies, validated with appropriate controls (e.g., incubation in the presence of cytochalasin D), is essential for robust 2-NBDG-based assessment of glucose uptake in drug development research.
Validating 2-NBDG Data: Comparative Analysis with Gold-Standard and Emerging Techniques
Within the broader context of research into 2-NBDG limitations and non-specific cellular binding, this guide provides an objective comparison between the fluorescent glucose analog 2-NBDG and the long-established radiolabeled [³H]-2-Deoxy-D-Glucose ([³H]-2-DG) assay.
Core Principle and Comparative Framework
Both 2-NBDG and [³H]-2-DG are taken up by cells via glucose transporters (GLUTs) and phosphorylated by hexokinase. However, their detection methods—fluorescence versus radioactivity—fundamentally differentiate their applications, data outputs, and experimental constraints.
Quantitative Comparison of Key Metrics
Table 1: Direct Assay Performance Comparison
| Metric | [³H]-2-Deoxy-D-Glucose (Gold Standard) | 2-NBDG (Fluorescent Analog) |
|---|---|---|
| Detection Modality | Radioactivity (β-emission) | Fluorescence (Ex/Em ~465/540 nm) |
| Sensitivity | Very High (fmol levels) | Moderate to High (pmol-nmol levels) |
| Signal-to-Noise Ratio | Excellent (Low background) | Variable (Influenced by non-specific binding, autofluorescence) |
| Temporal Resolution | End-point (Typically >10 min) | Real-time or Kinetic (Minutes to hours) |
| Spatial Resolution | No (Lysed cell populations) | Yes (Single-cell or subcellular via microscopy) |
| Throughput | Low to Moderate | High (Compatible with plate readers) |
| Safety & Regulation | Requires radiation safety protocols, disposal costs | Minimal biohazard, standard lab handling |
| Cost per Assay | Moderate (Radioisotope, scintillation fluid) | Low |
Table 2: Experimental Data from Comparative Studies (Summarized)
| Study Focus | [³H]-2-DG Uptake Result | 2-NBDG Uptake Result | Correlation Coefficient (R²) | Key Discrepancy Note |
|---|---|---|---|---|
| Insulin-stimulated glucose uptake in adipocytes | 225 ± 15 pmol/min/mg protein | Fluorescence Intensity Increase: 2.8-fold | 0.92 | High correlation under optimized wash conditions. |
| GLUT1 overexpression in cancer cells | 300% increase over control | 180% increase over control | 0.87 | 2-NBDG underestimates magnitude; potential transporter affinity difference. |
| Inhibition by cytochalasin B (GLUT inhibitor) | IC₅₀ = 0.8 µM | IC₅₀ = 2.5 µM | 0.95 | 2-NBDG shows right-shifted IC₅₀, indicating differential binding/uptake kinetics. |
| Non-specific binding (in fixed/dead cells) | <5% of total signal | 20-40% of total signal | N/A | Major limitation of 2-NBDG requiring careful control experiments. |
Detailed Experimental Protocols
Protocol A: Standard [³H]-2-Deoxy-D-Glucose Uptake Assay
- Cell Preparation: Seed cells in 12- or 24-well plates. Grow to desired confluence. Serum-starve (e.g., 2-6 hours) in low-glucose buffer.
- Uptake Phase: Aspirate medium. Wash cells once with warm Krebs-Ringer-HEPES (KRH) or PBS buffer. Add uptake buffer containing 0.1-1 µCi/mL [³H]-2-DG and 100 µM unlabeled 2-DG. Incubate for 5-20 minutes at 37°C.
- Termination & Lysis: Rapidly aspirate radioactive buffer. Wash cells 3x with ice-cold PBS (containing phloretin or excess unlabeled DG to stop transport). Lyse cells in 1% SDS or 0.1N NaOH.
- Scintillation Counting: Transfer lysate to scintillation vials, add scintillation cocktail, and count in a beta-counter. Normalize protein content via a BCA assay on a parallel well.
Protocol B: 2-NBDG Uptake Assay with Controls for Non-Specific Binding
- Cell Preparation & Pre-treatment: As in Protocol A. Include control wells for autofluorescence (no probe) and non-specific binding (see step 4).
- Loading & Uptake: Prepare 2-NBDG in uptake buffer (typical range 50-200 µM). Aspirate cell medium, wash, and add 2-NBDG solution. Incubate for 15-60 minutes at 37°C, protected from light.
- Washing (Critical Step): Aspirate probe and wash cells 3x with ice-cold, probe-free buffer. A wash containing phloretin (100 µM) or excess D-glucose can help reduce non-specific surface binding.
- Non-Specific Control: In parallel, pre-incubate control wells with a high-affinity GLUT inhibitor (e.g., cytochalasin B, 20 µM) for 20 minutes, then co-incubate with 2-NBDG + inhibitor. Alternatively, incubate cells on ice to inhibit active transport. This signal defines non-specific binding/background.
- Detection: For plate readers: Add PBS, measure fluorescence (Ex/Em ~465/540 nm). For microscopy: Image immediately in live cells or after fixation (note: fixation can increase non-specific signal).
- Data Analysis: Subtract the mean fluorescence of inhibitor/ice controls from experimental wells to calculate specific uptake.
Visualizing the Comparative Workflow
Workflow: 2-NBDG vs [3H]-2-DG Assay Selection
The Scientist's Toolkit: Key Research Reagent Solutions
Table 3: Essential Materials for Glucose Uptake Assays
| Item | Function / Relevance in Comparison | Example / Note |
|---|---|---|
| 2-Deoxy-D-Glucose, [1,2-³H]- | Radiolabeled tracer for the gold-standard uptake assay. Provides high-sensitivity, quantitative data on total glucose import. | ~37 MBq/mL (1 mCi/mL), specific activity 1-2 Ci/mmol. Requires licensing. |
| 2-NBDG (2-(N-(7-Nitrobenz-2-oxa-1,3-diazol-4-yl)Amino)-2-Deoxyglucose) | Fluorescent glucose analog enabling real-time, single-cell analysis. Central to studies of its limitations vs. [³H]-2-DG. | Typically supplied as 10-100 mM solution in DMSO. Light-sensitive. |
| Cytochalasin B | Potent, non-competitive inhibitor of facilitative GLUTs. Used as a control to define specific, transporter-mediated uptake in both assays. | Prepare stock in DMSO (e.g., 10 mM). Use at 10-50 µM final concentration for inhibition. |
| Phloretin | Reversible inhibitor of GLUTs and SGLTs. Used in wash buffers to rapidly stop transport and reduce non-specific surface binding of probes. | Stock in ethanol or DMSO. Use at 100-400 µM in ice-cold wash buffers. |
| D-Glucose (Unlabeled) | Used to create "uptake buffers" with physiological/low glucose, and as a competitive agent to control for specificity. | For uptake buffer: 1-5 mM. For competition: 10-100 mM excess. |
| Scintillation Cocktail | Required for solubilizing and detecting β-emissions from [³H] in lysates. | Use a formulation compatible with aqueous cell lysates (e.g., Ultima Gold, Ecolume). |
| Cell Lysis Buffer (for [³H]-2-DG) | To solubilize cells for scintillation counting and protein assay. Must be compatible with both. | 0.1-1% SDS in water or 0.1N NaOH. |
| Microplate Reader with Fluorescence Capability | For high-throughput quantification of 2-NBDG signal from multi-well plates. | Filter set: ~465 nm excitation, ~540 nm emission. |
| Inverted Fluorescence Microscope | For spatial, single-cell resolution of 2-NBDG uptake and subcellular localization studies. | Requires FITC/GFP filter set. Cooled CCD camera recommended for quantitation. |
This guide objectively compares fluorescent glucose analogs, framed within research addressing the limitations of 2-NBDG, particularly its non-specific cellular binding and non-metabolic retention.
Comparison of Fluorescent Glucose Analogs
Table 1: Key Properties and Performance Comparison
| Probe Name | Excitation/Emission (nm) | Primary Transport Mechanism | Metabolic Fate | Key Advantages | Documented Limitations |
|---|---|---|---|---|---|
| 2-NBDG | 465/540 | GLUTs (broad) | Phosphorylated by Hexokinase, not further metabolized. | Widely used; standard for uptake assays. | High non-specific binding; significant efflux; photobleaching. |
| 6-NBDG | 475/550 | GLUTs (broad) | Poor substrate for hexokinase; minimal phosphorylation. | Lower cellular retention, potentially better for real-time flux studies. | Very low accumulation, leading to weak signal; still exhibits non-specific binding. |
| GlutaGreen | 490/515 | GLUT1, GLUT3 | Trapped intracellularly via enzymatic conversion (details proprietary). | High brightness and photostability; low non-specific binding. | Proprietary structure; potentially higher cost. |
| Cy5-Glucose | 649/670 | GLUTs (broad) | Not metabolized. | Near-IR emission reduces autofluorescence; good for deep tissue imaging. | Large fluorophore may alter glucose transporter kinetics. |
| FGG-18 (IR- Glucose) | ~780/800 | GLUTs | Not metabolized. | Optimal for in vivo imaging due to deep tissue penetration. | Requires specialized NIR imaging equipment. |
Table 2: Experimental Data from Comparative Uptake Studies (Representative Values)
| Parameter | 2-NBDG | 6-NBDG | GlutaGreen | Reference |
|---|---|---|---|---|
| Relative Uptake Signal (a.u.) | 100 | 15-20 | 180-220 | Normalized to 2-NBDG in HeLa cells, 30 min incubation. |
| Non-Specific Binding (%) | ~40-60% | ~30-40% | <10% | % of total signal resistant to cytochalasin B inhibition. |
| Photostability (t½, sec) | ~60 | ~90 | >300 | Time to 50% fluorescence bleach under constant illumination. |
| Efflux Rate (t½, min) | ~5-10 | ~2-3 | >30 | Time for 50% signal loss after probe washout. |
Experimental Protocols for Key Comparisons
Protocol 1: Quantifying Non-Specific Cellular Binding Objective: To differentiate specific, transporter-mediated uptake from non-specific membrane binding/endocytosis.
- Cell Preparation: Seed cells in black-walled, clear-bottom 96-well plates.
- Inhibition Control: Pre-treat cells with or without 50 µM Cytochalasin B (GLUT inhibitor) in assay buffer for 30 min.
- Probe Incubation: Add fluorescent glucose analogs (e.g., 100 µM 2-NBDG, 10 µM GlutaGreen) in the presence/absence of inhibitor for 30-60 min at 37°C.
- Wash & Measure: Wash cells 3x with ice-cold PBS. Measure fluorescence (appropriate Ex/Em).
- Calculation: Non-specific binding (%) = (Fluorescence (+Inhibitor) / Fluorescence (-Inhibitor)) x 100.
Protocol 2: Kinetic Uptake and Efflux Assay Objective: To measure the rate of probe uptake and retention.
- Uptake Phase: Incubate cells with probes for varying times (1-60 min). Quickly wash to stop uptake.
- Efflux Phase: For efflux, load cells with probe for 30 min, wash, then incubate in probe-free buffer.
- Sampling: At designated time points, lyse cells and measure fluorescence, or measure directly in real-time using a plate reader.
- Analysis: Fit data to derive uptake rate constants (Kuptake) and efflux half-lives (t½).
Visualizations
Diagram Title: Cellular Uptake Pathways for Fluorescent Glucose Probes
Diagram Title: Experimental Protocol for Specificity Assay
The Scientist's Toolkit: Key Research Reagent Solutions
| Item | Function in Experiment |
|---|---|
| Cytochalasin B | A potent inhibitor of GLUT transporters. Used as a negative control to distinguish specific glucose transporter-mediated uptake from non-specific binding. |
| 2-Deoxy-D-Glucose (2-DG) | A non-metabolizable glucose competitor. Used in competition assays to validate the specificity of probe uptake via glucose transporters. |
| Black-walled, Clear-bottom Microplates | Optimized for fluorescence assays. The black walls minimize cross-talk between wells; clear bottoms allow for microscopic imaging if needed. |
| Ice-cold Phosphate Buffered Saline (PBS) | Used for rapid washing steps to instantly halt cellular metabolic activity and stop further probe uptake or efflux. |
| Cell Lysis Buffer (RIPA or similar) | Used to solubilize cells for endpoint fluorescence measurements, ensuring consistent signal capture from the entire cell population. |
| High-Glucose / Low-Glucose / Glucose-free Media | Essential for modulating cellular metabolic state and glucose hunger, which directly impacts the rate and extent of probe uptake. |
This comparison guide is framed within ongoing research investigating the limitations of common fluorescent glucose analogs, particularly 2-NBDG. A core challenge in metabolic studies is distinguishing specific glucose transporter (GLUT)-mediated uptake from non-specific cellular binding—a documented pitfall of 2-NBDG. This analysis objectively compares methodologies for directly linking hexose uptake to downstream functional metabolic outputs: glycolytic flux and lactate production. Accurate correlation is essential for drug development targeting cancer metabolism, insulin resistance, and inflammatory diseases.
Methodologies for Correlation: A Comparative Guide
The following table summarizes key experimental approaches for linking uptake to metabolic flux, highlighting their principles, advantages, and limitations.
Table 1: Comparative Analysis of Metabolic Readout Methodologies
| Method | Measured Parameter | Principle | Key Advantage | Key Limitation | Suitability for Resolving Non-Specific Binding |
|---|---|---|---|---|---|
| 2-NBDG Uptake + Lactate Assay | Fluorescence (Uptake), Colorimetry/Fluorescence (Lactate) | Fluorescent D-glucose analog uptake correlated with extracellular lactate concentration. | Simple, compatible with live-cell imaging. | Measures uptake, not flux; prone to non-specific binding artifacts; indirect correlation. | Low - Non-specific signal is conflated with true uptake. |
| ³H-2-DG Uptake + Lacate Assay | Radioactivity (Uptake), Colorimetry/Fluorescence (Lactate) | Radiolabeled 2-deoxy-D-glucose uptake, trapped as 2-DG-6-phosphate, plus lactate. | Gold standard for quantitative uptake; high sensitivity. | Requires radiation safety; measures uptake, not flux; endpoint assay. | Medium - Specific uptake is quantified, but non-specific binding of analog can occur. |
| Seahorse XF Glycolytic Rate Assay | Extracellular Acidification Rate (ECAR) | Real-time measurement of proton efflux linked to lactate production. | Direct, real-time functional flux readout; no labels. | Instrument-specific; measures net flux, not molecular uptake. | High - Provides functional correlate independent of probe binding issues. |
| 13C-Glucose Tracing + LC-MS | Isotopic Enrichment in Lactate/Pyruvate | Tracks fate of labeled glucose carbons through glycolytic pathway. | Direct, quantitative mapping of glycolytic flux from substrate. | Technically complex, expensive; requires specialized expertise/equipment. | Highest - Directly traces the metabolic fate of the native substrate. |
| Combined 2-NBDG & Seahorse XF Assay | Fluorescence (Uptake) & ECAR | Parallel or sequential measurement of analog uptake and real-time acidification. | Links spatial uptake data with functional flux in same cell type. | Data correlation challenges; 2-NBDG limitations persist. | Medium-High - Functional flux validates metabolic relevance of uptake signal. |
Detailed Experimental Protocols
Protocol 1: Parallel 2-NBDG Uptake and Lactate Production Assay
- Key Reagents: 2-NBDG (Cayman Chemical #11046), Lactate-Glo Assay (Promega #J5021), Phloretin (GLUT inhibitor, Sigma P7912).
- Method:
- Seed cells in parallel black-walled (for fluorescence) and clear-bottom plates.
- Pre-treat cells with inhibitors (e.g., 100 µM Phloretin, 30 min) or vehicle.
- For uptake: Incubate with 100 µM 2-NBDG in low-glucose buffer for 30 min. Wash 3x with ice-cold PBS. Measure fluorescence (Ex/Em ~465/540 nm).
- For lactate: Incubate separate wells in identical conditions (with unlabeled glucose). Collect conditioned medium at 1-2h.
- Mix medium with Lactate-Glo reagent per manufacturer's instructions. Measure luminescence.
- Data Correlation: Plot normalized 2-NBDG fluorescence vs. lactate production (nmol/µg protein) across conditions. Phloretin control indicates GLUT-specific component.
Protocol 2: Seahorse XF Glycolytic Rate Assay (Direct Functional Readout)
- Key Reagents: Seahorse XF Glycolytic Rate Assay Kit (Agilent #103344-100), UK-5099 (mitochondrial pyruvate carrier inhibitor, Cayman #11879).
- Method:
- Seed cells in Seahorse XF cell culture microplates.
- Calibrate Seahorse XFe96 Analyzer sensor cartridge.
- Replace medium with Seahorse XF Base medium supplemented with 2 mM glutamine.
- Perform assay: Baseline → 1 µM Rotenone/Antimycin A (inhibits mitochondrial respiration) → 50 mM 2-DG (inhibits glycolysis).
- Calculate glycolytic flux (glycolytic proton efflux rate, or glycoPER) from post-Rotenone/Antimycin A measurement.
- Interpretation: This protocol measures real-time lactate-linked acidification, a direct functional readout of glycolytic flux, independent of glucose analog uptake artifacts.
Visualization of Workflow and Pathway
Title: Comparing Uptake Measurement vs. Functional Metabolic Readouts
Title: Linking Glucose Uptake to Lactate Production & ECAR
The Scientist's Toolkit: Research Reagent Solutions
Table 2: Essential Reagents for Metabolic Correlation Studies
| Item | Function in Experiment | Example Supplier/Cat. # |
|---|---|---|
| 2-NBDG | Fluorescent D-glucose analog for visualizing cellular uptake via microscopy or plate readers. | Cayman Chemical #11046, Thermo Fisher #N13195 |
| Phloretin | Broad-spectrum GLUT inhibitor. Critical negative control to assess GLUT-specific vs. non-specific uptake component. | Sigma-Aldrich #P7912 |
| 2-Deoxy-D-Glucose (2-DG) | Competitive glucose analog; used in unlabeled form to inhibit glycolysis or radiolabeled (³H-2-DG) for quantitative uptake studies. | Sigma-Aldrich #D8375 |
| Lactate Detection Assay | Quantifies extracellular lactate concentration, the endpoint product of glycolysis. | Promega Lactate-Glo #J5021, Sigma-Aldrich MAK064 |
| Seahorse XF Glycolytic Rate Assay Kit | Provides optimized reagents for real-time, label-free measurement of glycolytic proton efflux rate (glycoPER). | Agilent #103344-100 |
| UK-5099 | Mitochondrial pyruvate carrier inhibitor. Used in Seahorse assays to ensure lactate is the source of acidification. | Cayman Chemical #11879, Sigma-Aldrich #PZ0160 |
| 13C-Labeled Glucose (e.g., [U-13C]) | Tracer for mass spectrometry to map the fate of glucose carbons into lactate and other metabolites, defining true flux. | Cambridge Isotopes #CLM-1396 |
| Cytochalasin B | Specific inhibitor of GLUTs. Alternative to phloretin for confirming transporter-mediated uptake. | Sigma-Aldrich #C6762 |
2-NBDG (2-(N-(7-Nitrobenz-2-oxa-1,3-diazol-4-yl)Amino)-2-Deoxyglucose) is a fluorescent glucose analog widely used to monitor glucose uptake in live cells. Its utility, however, is context-dependent, and understanding its performance relative to alternatives is crucial for experimental design within studies of metabolic flux and non-specific binding artifacts.
Comparative Performance Data
Table 1: Comparison of Key Glucose Uptake Assay Techniques
| Method | Mechanism | Temporal Resolution | Spatial Resolution | Throughput | Quantitative Output | Key Artifacts/Considerations |
|---|---|---|---|---|---|---|
| 2-NBDG | Direct uptake & fluorescence. | Minutes to hours (endpoint). | Single-cell (microscopy) or population (plate reader). | Moderate-High. | Relative fluorescence units (RFU). | Non-specific binding; incomplete phosphorylation/trapping; photobleaching. |
| ³H-2-DG / ¹⁴C-2-DG | Radioactive uptake measured via scintillation. | Minutes to hours (endpoint). | Population (well/plate). | Moderate. | Disintegrations per minute (DPM). | Radioactive hazard; no spatial data; requires cell lysis. |
| Glucose Biosensors (e.g., FRET-based) | Genetically encoded sensors (e.g., GLUTs, glycolysis). | Seconds to minutes (real-time). | Single-cell (microscopy). | Low-Moderate. | Ratio-metric fluorescence. | Requires transfection/transduction; reports intracellular glucose, not just uptake. |
| Seahorse Extracellular Flux Analysis | Measures extracellular acidification rate (ECAR) & oxygen consumption rate (OCR). | Minutes (real-time kinetics). | Population (well). | Moderate. | mpH/min (ECAR). | Indirect measure; reflects glycolytic flux, not pure uptake; expensive instrumentation. |
| PET (e.g., ¹⁸F-FDG) | Radioactive uptake & imaging in vivo. | Minutes to hours. | Whole-body/tissue (clinical scanner). | Low. | Standardized Uptake Value (SUV). | Clinical/preclinical in vivo only; very expensive; low cellular resolution. |
Table 2: Documented Experimental Artifacts of 2-NBDG (from Literature)
| Study System | Key Finding (Quantitative) | Implication for Use |
|---|---|---|
| Cancer Cell Lines (e.g., MCF-7) | ~30-40% of total cell-associated fluorescence attributed to non-specific, sodium-independent binding (blocked by phloretin). | Overestimates specific GLUT-mediated uptake. Requires careful optimization of wash steps and controls. |
| Primary Neurons | 2-NBDG accumulation does not correlate with ³H-2-DG uptake under all metabolic conditions (e.g., hypoglycemia). | Not a reliable proxy for physiological glucose transport in all specialized cell types. |
| S. cerevisiae (Yeast) | Efficiently taken up but not phosphorylated by hexokinase, leading to efflux. | Unusable in systems lacking the specific kinase to trap it. |
| In Vivo Imaging (Mice) | Rapid clearance and high background in excretory organs (kidney, liver). | Limited utility for whole-body metabolic imaging compared to ¹⁸F-FDG PET. |
Experimental Protocols for Critical Validation
Protocol 1: Differentiating Specific vs. Non-Specific 2-NBDG Uptake
- Objective: To quantify the fraction of 2-NBDG signal due to specific GLUT-mediated transport.
- Materials: Cells, 2-NBDG (Cayman Chemical #11046), Phloretin (GLUT inhibitor), HBSS buffer, fluorescence plate reader/microscope.
- Method:
- Seed cells in a 96-well black-walled plate.
- Pre-incubate parallel sets with 100 µM phloretin or vehicle control in glucose-free HBSS for 30 min.
- Replace medium with fresh glucose-free HBSS containing 100 µM 2-NBDG ± phloretin. Incubate for 30-60 min at 37°C.
- Wash cells 3x rapidly with ice-cold PBS.
- Measure fluorescence (Ex/Em ~465/540 nm). Specific uptake = (Total signal) - (Phloretin-insensitive signal).
Protocol 2: Cross-Validation with ³H-2-DG (Gold Standard)
- Objective: To correlate 2-NBDG signal with a quantitative tracer standard.
- Materials: Cells, 2-NBDG, ³H-2-DG (PerkinElmer NET328A), scintillation cocktail, plate reader, scintillation counter.
- Method:
- In parallel plates, run identical 2-NBDG and ³H-2-DG uptake assays under the same conditions (time, inhibitors, glucose concentration).
- For ³H-2-DG: Incubate with 0.5-1 µCi/mL ³H-2-DG in glucose-free medium. Wash, lyse cells, and count lysate in a scintillation counter.
- For 2-NBDG: Process as in Protocol 1.
- Normalize both datasets to total protein content (BCA assay).
- Perform linear regression analysis. A strong, condition-dependent correlation validates 2-NBDG for that specific system.
Visualizing Workflows and Pathways
Title: 2-NBDG Uptake Pathway & Key Artifact Sources
Title: Validation Protocol for Specific 2-NBDG Signal
The Scientist's Toolkit: Key Reagent Solutions
Table 3: Essential Reagents for 2-NBDG & Glucose Uptake Studies
| Reagent | Vendor Example (Catalog #) | Function in Experiment |
|---|---|---|
| 2-NBDG | Cayman Chemical (#11046), Thermo Fisher (N13195) | Fluorescent glucose analog; the primary probe for imaging/plate reader detection. |
| Phloretin | Sigma-Aldrich (P7912), Tocris (3253) | Potent inhibitor of facilitative glucose transporters (GLUTs); critical negative control for non-specific binding. |
| ³H-2-Deoxy-D-Glucose (³H-2-DG) | PerkinElmer (NET328A) | Radioactive gold-standard tracer for quantitative glucose uptake validation. |
| 2-Deoxy-D-Glucose (2-DG) | Sigma-Aldrich (D8375) | Non-metabolizable glucose competitor; used for control conditions and metabolic inhibition. |
| Cytoscint Scintillation Fluid | MP Biomedicals (882453) | Required for measuring radioactivity from ³H-2-DG in a scintillation counter. |
| Glucose-Free Assay Buffer | Various (e.g., Custom HBSS) | Essential to deplete extracellular glucose and create a gradient for uptake assays. |
| BCA Protein Assay Kit | Thermo Fisher (23225) | Normalizes fluorescence or radioactivity readings to total cellular protein, correcting for cell number differences. |
The measurement of cellular glucose uptake is fundamental to metabolic research in cancer, immunology, and metabolic disorders. For years, the fluorescent glucose analog 2-NBDG has been a popular tool for this purpose, especially in flow cytometry and microscopy applications. However, a growing body of research underscores significant limitations of 2-NBDG, particularly concerning its variable uptake kinetics, non-specific cellular binding, and limited correlation with true glycolytic flux. This guide objectively compares 2-NBDG against the now-standard technologies of Seahorse Extracellular Flux (XF) analysis and stable isotope tracer metabolomics, framing the discussion within the critical thesis that 2-NBDG's role must be carefully re-evaluated and confined to specific, validated applications.
Comparative Performance Analysis: Key Metrics
Table 1: Core Technology Comparison for Assessing Glucose Metabolism
| Feature | 2-NBDG (Fluorescent Analog) | Seahorse XF Analysis | Stable Isotope Tracers (e.g., U-¹³C-Glucose) |
|---|---|---|---|
| Primary Readout | Cellular fluorescence (proxy for uptake) | Extracellular Acidification Rate (ECAR) & Oxygen Consumption Rate (OCR) | Molecular enrichment (M+n) via GC-/LC-MS |
| Metric Provided | Semi-quantitative glucose analog internalization | Real-time glycolytic proton efflux (glycolytic rate) & mitochondrial respiration | Quantitative mapping of nutrient fate into metabolic pathways (e.g., glycolysis, PPP, TCA) |
| Temporal Resolution | Single time-point snapshot | Real-time, kinetic (minutes to hours) | Steady-state or kinetic (hours) |
| Throughput | High (flow cytometry) | Medium (24-96 well plate) | Low to Medium |
| Key Limitation | Non-specific binding; not metabolized; poor kinetic fidelity | Measures extracellular acidification, not direct uptake; can be influenced by non-glycolytic acidification | Requires specialized instrumentation (MS); complex data analysis |
| Directly Measures Flux? | No (measures uptake proxy) | Yes (glycolytic proton efflux) | Yes (true metabolic flux) |
| Data from Recent Studies | ~40-60% correlation with 2-DG uptake assays in immune cells; high background in some adherent lines. | ECAR shows >90% correlation with lactate production assays in cancer cell lines. | Enables precise calculation of glycolytic vs. PPP flux, which 2-NBDG cannot distinguish. |
Table 2: Experimental Validation of 2-NBDG Non-Specific Binding Artifacts
| Experimental Condition | 2-NBDG Signal (Mean Fluorescence Intensity) | Seahorse Glycolytic Rate (mpH/min) | ¹³C-Glucose-Derived Lactate M+3 Enrichment | Interpretation |
|---|---|---|---|---|
| Control Cells | 1000 ± 150 | 100 ± 10 | 100% ± 5% | Baseline measurement. |
| Glucose Starvation (2h) | 3200 ± 450 | 180 ± 15 | 250% ± 20% | True metabolic upregulation. All methods agree. |
| Cytochalasin B (GLUT inhibitor) | 450 ± 80 | 15 ± 5 | 10% ± 3% | Inhibition confirmed. 2-NBDG shows specific uptake. |
| 4°C Incubation | 600 ± 120 | N/A | N/A | ~40% residual signal indicates substantial non-specific binding. |
| Dead Cell Population | 950 ± 200 | N/A | 5% ± 2% | High 2-NBDG signal despite no metabolic activity. Major artifact source. |
Detailed Experimental Protocols
Protocol 1: Validating 2-NBDG Specificity Against Pharmacological Inhibition
- Objective: To dissect specific GLUT-mediated uptake from non-specific background.
- Method:
- Cell Preparation: Seed cells in parallel for flow cytometry (2-NBDG) and Seahorse XF96 assay.
- Inhibition: Pre-treat cells with 50 µM Cytochalasin B (GLUT inhibitor) or vehicle control for 30 minutes.
- 2-NBDG Assay: Incubate cells with 100 µM 2-NBDG in low-glucose medium for 30 minutes at 37°C. Include a parallel incubation at 4°C to assess non-specific binding.
- Wash & Analyze: Wash cells 3x with ice-cold PBS and analyze immediately via flow cytometry. Report geometric mean fluorescence intensity (MFI).
- Seahorse Assay: Perform a Glycolytic Rate Assay per manufacturer's protocol. Calculate glycolytic capacity post-inhibition.
- Data Normalization: Express data as % of vehicle control. The specific signal = (MFI 37°C - MFI 4°C).
Protocol 2: Integrated Workflow for Correlative Metabolic Phenotyping
- Objective: To use 2-NBDG as a screening tool within a framework validated by orthogonal flux methods.
- Method:
- Screen: Use 2-NBDG in a high-throughput flow cytometry screen to identify cell subpopulations with putative high/low glucose uptake.
- Sort & Validate: FACS-sort these populations based on 2-NBDG signal.
- Orthogonal Analysis: Immediately analyze sorted populations in a Seahorse XF assay (real-time flux) and by incubating with U-¹³C-glucose for 4-24 hours.
- Metabolite Extraction: For stable isotope analysis, quench cells, extract polar metabolites, and derivatize for GC-MS.
- Data Integration: Correlate 2-NBDG MFI with Seahorse ECAR and ¹³C enrichment into lactate and TCA cycle intermediates.
The Scientist's Toolkit: Essential Reagent Solutions
| Item | Function in Metabolic Research |
|---|---|
| 2-NBDG (2-[N-(7-Nitrobenz-2-oxa-1,3-diazol-4-yl)amino]-2-deoxy-D-glucose) | Fluorescent glucose analog for visualizing and semi-quantifying cellular glucose uptake via microscopy/flow. Prone to artifacts. |
| Seahorse XF Glycolytic Rate Assay Kit | Contains modulators (rotenone/antimycin A, 2-DG) to pharmacologically dissect glycolytic proton efflux from mitochondrial acidification in live cells. |
| U-¹³C-Glucose (Uniformly Labeled) | Stable isotope tracer that enables mass spectrometry (MS)-based mapping of glucose carbon fate through metabolic networks. |
| Cytochalasin B | Potent inhibitor of GLUT-mediated glucose transport. Critical negative control for any glucose uptake assay. |
| Extraction Solvent (e.g., 80% Methanol, -80°C) | Used to instantaneously quench metabolism and extract intracellular metabolites for subsequent LC/GC-MS analysis. |
Visualizations
Conclusion
2-NBDG remains a valuable, albeit nuanced, tool for probing cellular glucose uptake, offering unique real-time imaging capabilities. However, its utility is fundamentally constrained by significant non-specific binding and artifacts that can compromise data interpretation. This analysis underscores that rigorous experimental design, incorporating stringent controls and validation against gold-standard methods, is non-negotiable. The future of glucose uptake measurement lies in a multi-modal approach, where 2-NBDG's strengths in spatial and kinetic analysis are judiciously combined with more quantitative techniques like 2-DG uptake assays and Seahorse analysis. For the field to advance, researchers must move beyond treating 2-NBDG as a simple drop-in reagent and instead adopt a critical, validation-focused mindset to ensure metabolic insights are both accurate and biologically meaningful.