Bioengineering vs Biomedical Engineering: Demystifying Definitions, Scope, and Applications for Researchers
This article provides a comprehensive analysis for researchers and drug development professionals on the distinct yet overlapping fields of bioengineering and biomedical engineering.
Bioengineering vs Biomedical Engineering: Demystifying Definitions, Scope, and Applications for Researchers
Abstract
This article provides a comprehensive analysis for researchers and drug development professionals on the distinct yet overlapping fields of bioengineering and biomedical engineering. It begins with foundational definitions and core principles, explores specific methodologies and real-world applications in drug discovery and device development, addresses common challenges and optimization strategies in translational research, and concludes with a comparative validation of educational paths and career trajectories. The goal is to clarify the scopes to inform interdisciplinary collaboration and project design.
Core Principles Unveiled: Defining Bioengineering and Biomedical Engineering from First Principles
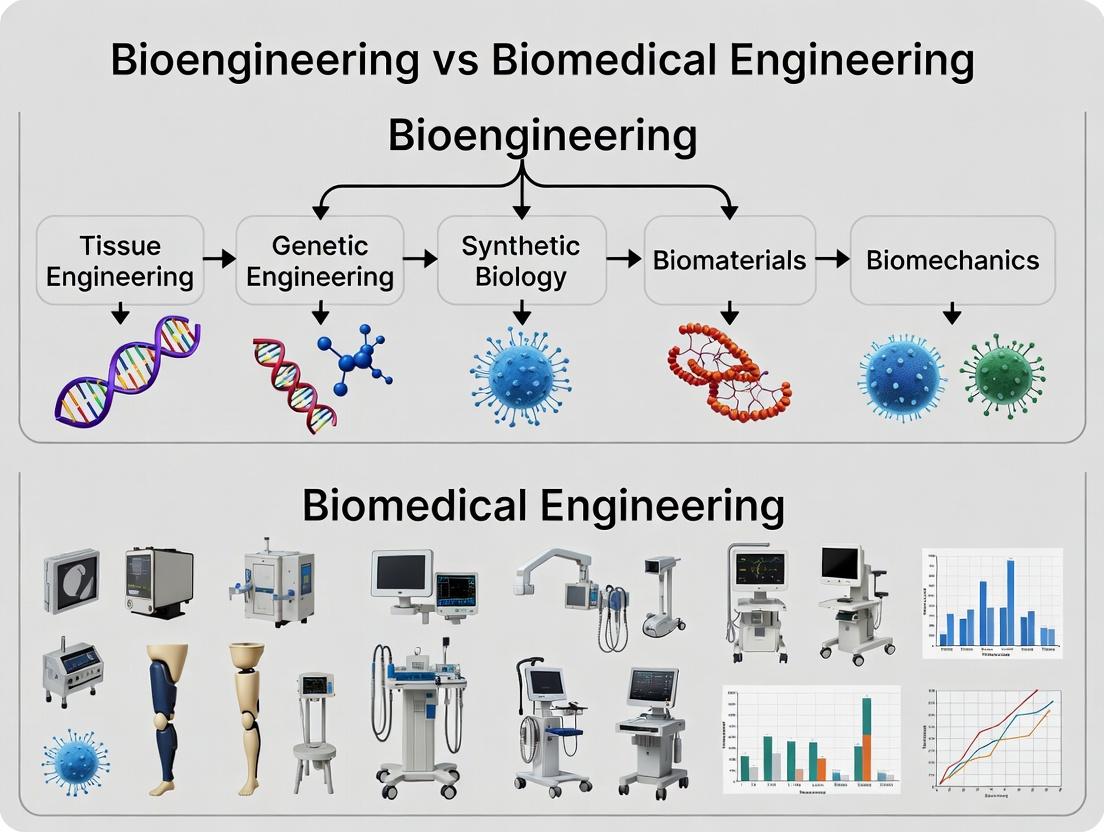
Within academic and industrial discourse, a persistent conflation exists between "bioengineering" and "biomedical engineering." This whitepaper operates within a broader thesis that delineates these fields. Biomedical engineering is a subset primarily focused on applying engineering principles to human health, medicine, and diagnostics (e.g., prosthetics, MRI machines). In stark contrast, Bioengineering is the foundational discipline that applies engineering principles to all biological systems—from biomolecules and cells to tissues, organisms, and entire ecosystems. It is the broader umbrella under which biomedical engineering resides. This document provides an in-depth technical guide to the core principles of bioengineering across its full spectrum.
Foundational Principles Across Scales
Bioengineering integrates knowledge from molecular biology, systems biology, thermodynamics, kinetics, and transport phenomena to analyze and manipulate biological systems. The core equation governing many processes across scales is the general mass balance for any system component i:
Accumulation = In – Out + Generation – Consumption
This principle applies equally to a metabolite in a bioreactor, a cell population in tissue, or a nutrient in an ecosystem.
Quantitative Analysis of Bioengineering Subfields
Table 1: Core Data and Applications Across Bioengineering Scales
| System Scale | Characteristic Length | Key Engineering Principles | Example Applications | Quantitative Metric (Typical Range/Value) |
|---|---|---|---|---|
| Biomolecular | 1 nm – 100 nm | Reaction kinetics, catalysis, binding affinity | Enzyme engineering, biosensors, synthetic pathways | Binding constant (Kd): 1 nM – 1 mM; Turnover number (kcat): 10² – 10⁷ s⁻¹ |
| Cellular | 1 µm – 100 µm | Mass transport, signal transduction, metabolic flux | Metabolic engineering, stem cell bioprocessing, phage therapy | Growth rate (µ): 0.01 – 2.0 h⁻¹; Yield (Yx/s): 0.1 – 0.5 g cells/g substrate |
| Tissue & Organ | 100 µm – 1 m | Mechanics, fluid dynamics, scaffold design | 3D bioprinting, organ-on-a-chip, artificial organs | Young's Modulus (soft tissue): 0.1 – 100 kPa; Shear stress (vascular): 1 – 70 dyn/cm² |
| Organismal | 0.1 m – 10 m | Systems integration, control theory, pharmacokinetics | Genetic engineering of crops, transgenic animals, bioremediation | Photosynthetic efficiency (crops): 3 – 6%; Bioconcentration factor (pollutant): 10 – 10⁵ L/kg |
| Ecosystem | 1 km – 10⁴ km | Population dynamics, material/energy balances, resilience engineering | Wastewater treatment, synthetic ecology, carbon sequestration | Nitrogen removal rate (wastewater): 0.05 – 0.3 kg N/m³-day; Biodiversity index (Shannon H'): 1.5 – 4.5 |
Core Methodologies and Experimental Protocols
Protocol: Directed Evolution of Enzymes (Biomolecular Scale)
Objective: Engineer an enzyme for enhanced thermostability or novel substrate specificity. Workflow:
- Diversity Generation: Create a mutant library via error-prone PCR (e.g., 0.1-1 mM Mn²⁺ to increase Taq polymerase error rate) or DNA shuffling.
- Selection/Screening: Clone library into an expression host (e.g., E. coli). Perform high-throughput screening on solid media with chromogenic substrates or use fluorescence-activated cell sorting (FACS) for binding assays.
- Analysis & Iteration: Isolate positive clones, sequence, and characterize kinetics (determine new kcat and Km). Use as templates for subsequent rounds of evolution. Key Parameters: Mutation rate (0.5-2 mutations/kb), library size (>10⁶ variants), selection pressure stringency.
Protocol: Metabolic Flux Analysis (MFA) in Bioreactors (Cellular Scale)
Objective: Quantify intracellular reaction rates in a living cell network. Workflow:
- Tracer Experiment: Grow cells in a controlled bioreactor with a defined medium where a key carbon source (e.g., [1-¹³C]glucose) is isotopically labeled.
- Steady-State Cultivation: Maintain cells at exponential growth until isotopic steady state is achieved (typically 3-5 residence times).
- Mass Spectrometry: Harvest cells, quench metabolism, and derive metabolites. Analyze mass isotopomer distributions (MIDs) of proteinogenic amino acids via GC-MS.
- Computational Solution: Use a stoichiometric model of central metabolism. Input extracellular fluxes (uptake/secretion rates) and MIDs. Solve for intracellular fluxes using constraint-based modeling (e.g., elementary flux modes) and least-squares regression. Key Parameters: Labeling pattern, measurement errors, network stoichiometry completeness.
Protocol: Constructed Wetland for Wastewater Remediation (Ecosystem Scale)
Objective: Design a bioengineered ecosystem for nitrogen and organic contaminant removal. Workflow:
- System Design: Engineer a saturated subsurface flow wetland. Determine hydraulic loading rate (HLR: 0.05-0.3 m/day) and aspect ratio (length:width > 3:1) based on projected inflow.
- Media & Planting: Fill with gravel/media of specific porosity (~0.4). Plant selected macrophyte species (e.g., Phragmites australis) to promote rhizosphere microbial communities.
- Operation & Monitoring: Pump pre-treated wastewater through the system. Monitor redox potential gradients along the flow path. Sample influent and effluent weekly for BOD5, Total N, NH₄⁺, NO₃⁻, and Total P.
- Performance Analysis: Calculate removal efficiencies and first-order rate constants (k) for each pollutant. Adjust HLR or vegetation if performance declines. Key Parameters: Hydraulic retention time (HRT: 2-10 days), contaminant loading rate, temperature, plant health.
The Scientist's Toolkit: Key Research Reagent Solutions
Table 2: Essential Materials for Cross-Scale Bioengineering Research
| Reagent/Material | Primary Function | Example Use Case | Key Considerations |
|---|---|---|---|
| Site-Directed Mutagenesis Kits | Introduces specific point mutations into DNA sequences. | Creating enzyme active-site variants for mechanistic studies. | Fidelity, efficiency, compatibility with large plasmids. |
| ¹³C/¹⁵N Isotopically Labeled Substrates | Enables tracing of atoms through metabolic networks. | Metabolic Flux Analysis (MFA) for quantifying pathway activity. | Isotopic purity (>99%), position of label, cost. |
| Recombinant Protein Expression Systems | High-yield production of proteins in host cells (bacterial, insect, mammalian). | Manufacturing therapeutic enzymes or structural proteins for biomaterials. | Solubility, post-translational modifications, scalability. |
| Engineered Hydrogels (e.g., PEG-based, Matrigel) | Mimic extracellular matrix for 3D cell culture and tissue engineering. | Stem cell differentiation studies, organoid development, wound healing models. | Stiffness tunability, degradability, bioactive ligand presentation. |
| CRISPR-Cas9 Systems & gRNA Libraries | Precise genome editing and large-scale functional genomics. | Creating knock-out/knock-in organisms, synthetic gene circuits, gene drives. | Off-target effects, delivery method (viral, electroporation), repair pathway control. |
| Next-Generation Sequencing (NGS) Kits | High-throughput DNA/RNA sequencing for genomic analysis. | Screening mutant libraries, microbiome analysis, single-cell transcriptomics. | Read length, depth, error rate, multiplexing capability. |
| Bio-remediation Consortia (Microbial Inoculants) | Pre-selected mixtures of bacteria/fungi for pollutant degradation. | In-situ cleanup of oil spills, heavy metal sequestration, pesticide breakdown. | Environmental survivability, substrate specificity, non-pathogenicity. |
This whitepaper, situated within a broader thesis delineating the definitions and scopes of bioengineering versus biomedical engineering, posits that the latter is fundamentally distinguished by its direct and deliberate clinical focus. While bioengineering encompasses the application of engineering principles to any biological system, biomedical engineering is specifically architected to translate technological innovation into patient-centered diagnostic, therapeutic, and rehabilitative solutions. This document serves as a technical guide to the core methodologies and translational pathways that characterize this clinical bridge.
Core Translational Pathways & Methodologies
The clinical impact of biomedical engineering is realized through three primary translational pathways: Diagnostic Systems, Therapeutic Devices, and Regenerative Strategies. Each pathway employs distinct, yet often overlapping, experimental and development protocols.
Diagnostic Systems: Biosensor Development for Point-of-Care Testing
Objective: To develop a rapid, quantitative electrochemical biosensor for detecting cardiac troponin I (cTnI), a key biomarker for myocardial infarction, at the point of care. Experimental Protocol:
- Electrode Functionalization: Clean screen-printed carbon electrodes (SPCEs) via cyclic voltammetry (CV) in 0.5 M H₂SO₄. Immerse in a solution of 1-ethyl-3-(3-dimethylaminopropyl)carbodiimide (EDC) and N-hydroxysuccinimide (NHS) to activate carboxyl groups. Incubate with anti-cTnI monoclonal antibodies for 1 hour at 25°C.
- Blocking: Treat the electrode with 1% bovine serum albumin (BSA) for 30 minutes to block non-specific binding sites.
- Sample Incubation: Apply diluted human serum samples containing cTnI to the functionalized SPCE for 15 minutes.
- Signal Generation & Measurement: Introduce redox-labeled (e.g., horseradish peroxidase) secondary antibodies specific to a different cTnI epitope. After washing, add an electrochemical substrate (e.g., 3,3',5,5'-tetramethylbenzidine (TMB) with H₂O₂). Apply a constant potential and measure the resulting amperometric current.
- Calibration: Construct a calibration curve by plotting current response against the logarithm of known cTnI concentrations.
Quantitative Performance Metrics of Recent cTnI Biosensors: Table 1: Comparison of Electrochemical cTnI Biosensor Performance Parameters (2021-2023)
| Transduction Method | Linear Range (ng/mL) | Limit of Detection (pg/mL) | Analysis Time (min) | Reference |
|---|---|---|---|---|
| Amperometric (Nanocomposite) | 0.01 - 50 | 3.2 | < 20 | Biosens. Bioelectron. 2021 |
| Electrochemiluminescence | 0.0005 - 10 | 0.17 | 15 | Anal. Chem. 2022 |
| Impedimetric (Graphene-based) | 0.1 - 1000 | 85 | 30 | ACS Sens. 2023 |
Therapeutic Devices: Closed-Loop Artificial Pancreas System
Objective: To implement a closed-loop control algorithm that dynamically modulates insulin pump infusion rates based on real-time continuous glucose monitor (CGM) data. Experimental Protocol (Clinical Validation):
- System Components: Integrate a FDA-approved CGM, an insulin pump, and a control algorithm (e.g., Model Predictive Control) on a dedicated hardware controller.
- In-Silico Testing: Use the FDA-accepted UVA/Padova Type 1 Diabetes Simulator cohort to test algorithm safety and efficacy under meal and exercise challenges.
- Clinical Study Design: Conduct a randomized crossover trial with 30 participants with Type 1 diabetes. Each participant completes two 48-hour periods: one using the closed-loop system and one using their standard insulin pump therapy (open-loop).
- Primary Endpoint Measurement: The percentage of time the participant's glucose level is in the target range (70-180 mg/dL), as measured by the CGM.
- Data Analysis: Compare time-in-range (TIR) between closed-loop and open-loop periods using a paired t-test. Report secondary endpoints including time in hypoglycemia (<70 mg/dL), hyperglycemia (>180 mg/dL), and mean glucose.
Key Research Reagent Solutions for Biomedical Engineering: Table 2: Essential Materials for Featured Research Areas
| Item | Function | Example Application |
|---|---|---|
| Screen-Printed Electrodes (SPCEs) | Low-cost, disposable substrate for electrochemical sensing. | Point-of-care biosensor development. |
| EDC/NHS Crosslinker Kit | Activates carboxyl groups for covalent immobilization of biomolecules. | Antibody functionalization on biosensor surfaces. |
| Recombinant Antigens/Antibodies | High-purity, consistent proteins for assay development and calibration. | Biosensor target capture and signal generation. |
| Type 1 Diabetes Simulator (Software) | Validated computational model of glucose-insulin dynamics for pre-clinical testing. | Testing artificial pancreas control algorithms. |
| Human Induced Pluripotent Stem Cells (hiPSCs) | Patient-derived cells capable of differentiation into various lineages. | Tissue engineering and disease modeling. |
| Electrospun Polycaprolactone (PCL) Scaffolds | Biodegradable, fibrous matrices that mimic extracellular structure. | Scaffolds for regenerative medicine. |
| PDMS (Polydimethylsiloxane) | Silicone-based polymer for rapid prototyping of microfluidic devices. | Organ-on-a-chip fabrication. |
Regenerative Strategies: Engineered Tissue Constructs
Objective: To fabricate a mesenchymal stem cell (MSC)-seeded, gradient scaffold for osteochondral (bone-cartilage) interface regeneration. Experimental Protocol:
- Scaffold Fabrication: Create a bi-phasic scaffold using 3D printing/electrospinning. The "bone" phase uses Polycaprolactone (PCL) with 20% hydroxyapatite (HA) nanoparticles. The "cartilage" phase uses pure PCL. A transitional gradient zone is engineered by varying the HA concentration from 20% to 0% over 500 µm.
- Cell Seeding & Culture: Isolate human MSCs from bone marrow aspirate. Seed MSCs onto the scaffold at a density of 2x10⁶ cells/cm³. Culture in a biphasic medium: the first week in chondrogenic medium (TGF-β3, ITS, ascorbate), then switch the lower bone phase to osteogenic medium (Dexamethasone, β-glycerophosphate, ascorbate) using a custom perfusion bioreactor to maintain distinct chemical environments.
- Histological & Mechanical Analysis: At 4 and 8 weeks, assess constructs. Process for histology (H&E, Safranin O for proteoglycans, Alizarin Red for calcium). Perform unconfined compression testing to determine compressive modulus.
Visualization of Core Concepts
BME Clinical Translation Bridge
Electrochemical cTnI Biosensor Workflow
Closed-Loop Artificial Pancreas System
Synthesis and Scope Delineation
The methodologies and pathways detailed herein crystallize the definition of biomedical engineering within the bioengineering spectrum. Its scope is explicitly bounded by the imperative to solve clinical problems. This is operationalized through rigorous, quantitative experimentation (as outlined in the protocols and tables) and the development of integrated systems (visualized in the diagrams) that directly interface with human pathophysiology. The field's output is not merely knowledge or technology, but a tangible bridge to enhanced patient care, distinguishing it from the broader, more fundamental exploration of biological systems that characterizes bioengineering.
Historical Evolution and Philosophical Divergence of Both Fields
This whitepaper situates the historical and philosophical analysis of bioengineering and biomedical engineering within a broader research thesis aimed at clarifying their definitions and scopes. For researchers and drug development professionals, precise disciplinary boundaries dictate funding avenues, regulatory frameworks, and core methodological approaches. The divergence is not merely semantic but foundational to research trajectories.
Historical Evolution
Bioengineering: Roots in Foundational Sciences
Bioengineering (BE) emerged from the mid-20th century convergence of biology with engineering principles from chemical, mechanical, and electrical fields. Its philosophical core is application-agnostic: it seeks to understand and manipulate biological systems using engineering tools, whether the output is a medical device, agricultural product, or biomaterial. Key historical milestones include the development of quantitative systems biology, metabolic engineering, and the design-build-test-learn paradigm from synthetic biology.
Biomedical Engineering: Clinically-Driven Genesis
Biomedical Engineering (BME) originated more directly from clinical needs and the medical device industry post-World War II. Its philosophy is application-specific: the direct improvement of human health and the practice of medicine. Its evolution is marked by close ties to medical schools and hospitals, focusing on diagnostics, therapeutics, and rehabilitation. The field was formally recognized with the establishment of academic departments and professional societies like the IEEE Engineering in Medicine and Biology Society (EMBS).
Table 1: Historical Milestones and Institutionalization
| Era | Bioengineering (BE) Key Milestone | Biomedical Engineering (BME) Key Milestone |
|---|---|---|
| 1950s | Development of quantitative biological models; early bioprocessing. | First artificial cardiac pacemakers; hemodialysis machines. |
| 1970s | Advent of genetic engineering (recombinant DNA). | Commercialization of medical imaging (CT, MRI). |
| 1990s | Rise of systems biology and tissue engineering. | Proliferation of minimally invasive surgical devices. |
| 2000s | Synthetic biology and CRISPR-based genome editing platforms. | Growth of neural interfaces and wearable medical sensors. |
| 2010s-Present | AI-driven biomolecular design and advanced biomaterials. | Personalized diagnostics (liquid biopsy) and digital health platforms. |
Philosophical Divergence in Scope and Approach
The philosophical divide centers on the primacy of the problem versus the primacy of the tool.
- Bioengineering Philosophy: Asks, "What fundamental engineering principles can be derived from or applied to biological systems?" It is inherently exploratory and broad, often working at the molecular, cellular, or ecosystem level. The end goal may be knowledge generation or a platform technology.
- Biomedical Engineering Philosophy: Asks, "How can engineering solve this specific clinical problem?" It is hypothesis-driven and patient-focused, typically operating at the tissue, organ, or whole-body system level. The end goal is a translatable product or procedure.
This divergence manifests in research design, validation criteria, and regulatory pathways.
Experimental Protocols Illustrating Divergence
Protocol A: Bioengineering - Developing a Synthetic Genetic Oscillator
This protocol exemplifies the BE focus on foundational design principles in a non-therapeutic context.
Objective: To construct and characterize a synthetic, predictable oscillatory network in E. coli. Detailed Methodology:
- Computational Design: Use ODE-based modeling (e.g., in MATLAB or COPASI) to design a repressor-based negative feedback loop (e.g., using TetR, LacI, and lambda cI promoters).
- DNA Assembly: Assemble the genetic circuit using Golden Gate or Gibson Assembly. Cloning is performed into a mid-copy plasmid with an inducible promoter upstream.
- Transformation: Transform assembled plasmid into a characterized E. coli chassis strain (e.g., DH5α or MG1655).
- Characterization: Inoculate single colonies in LB media with appropriate antibiotic and inducer (e.g., aTc). Load cultures into a microfluidic device or plate reader maintained at 37°C.
- Live-Cell Imaging/Measurement: For fluorescent reporters (e.g., GFP, mCherry), measure fluorescence intensity (Ex/Em: 488/510 nm for GFP) every 10 minutes for 24 hours using time-lapse microscopy or a fluorescence plate reader.
- Data Analysis: Quantify oscillation period, amplitude, and damping ratio from time-series data. Compare to model predictions and iterate on design.
Protocol B: Biomedical Engineering - Testing a Novel Drug-Eluting Coronary Stent
This protocol exemplifies the BME focus on solving a defined clinical problem with rigorous biocompatibility testing.
Objective: To evaluate the in vitro efficacy and safety of a polymer-coated stent releasing an anti-proliferative drug (e.g., Sirolimus). Detailed Methodology:
- Stent Coating & Drug Loading: Use ultrasonic spray coating to apply a biodegradable polymer (e.g., PLGA) containing a precise dose of Sirolimus onto a bare-metal stent. Characterize coating uniformity via SEM.
- Drug Release Kinetics: Immerse coated stents (n=6) in phosphate-buffered saline (PBS, pH 7.4) at 37°C under gentle agitation. At predetermined time points (1 hr, 1, 3, 7, 14, 28 days), sample the PBS and quantify released Sirolimus using High-Performance Liquid Chromatography (HPLC).
- Anti-Proliferative Efficacy: Seed human coronary artery smooth muscle cells (HCASMCs) in 24-well plates. Expose cells to eluates collected from the drug release study. After 72 hours, assess cell viability using a calibrated MTT assay (measure absorbance at 570 nm).
- Hemocompatibility Testing (ISO 10993-4): Perform static in vitro hemolysis assay. Incubate stent samples with fresh human whole blood (anticoagulated with sodium citrate) for 3 hours at 37°C. Measure free hemoglobin in plasma spectrophotometrically at 540 nm. Calculate hemolysis percentage versus positive (water) and negative (saline) controls.
- Statistical Analysis: Use one-way ANOVA with post-hoc Tukey test to compare release profiles, cell viability across eluates, and hemolysis rates against controls (p < 0.05 considered significant).
Visualizations
Signaling Pathway: Growth Factor (VEGF) Induced Angiogenesis
Experimental Workflow: Comparative Analysis of Research Approaches
The Scientist's Toolkit: Key Research Reagent Solutions
Table 2: Essential Research Reagents and Materials
| Item & Typical Vendor/Example | Field of Use | Function & Brief Explanation |
|---|---|---|
| Gibson Assembly Master Mix (NEB) | BE (Synthetic Biology) | Enzymatic mix for seamless, one-step assembly of multiple DNA fragments, crucial for constructing genetic circuits. |
| PDMS (Sylgard 184, Dow) | BE/BME (Microfluidics) | Silicone elastomer used to fabricate microfluidic devices for cell culture, organ-on-a-chip, and single-cell analysis. |
| Recombinant Human VEGF (R&D Systems) | BME (Tissue Engineering) | Growth factor protein used to induce endothelial cell proliferation and formation of vascular networks in vitro. |
| PLGA (Lactel Absorbable Polymers) | BME (Drug Delivery) | Biodegradable copolymer used as a controlled-release matrix for drugs in coatings, microparticles, and scaffolds. |
| Anti-pERK1/2 Antibody (Cell Signaling Tech) | BE/BME (Signaling Analysis) | Phospho-specific antibody for detecting activated ERK via Western blot, indicating MAPK pathway activity. |
| Matrigel (Corning) | BME (Cell Migration/Invasion) | Basement membrane extract providing a 3D gel for cell invasion assays and in vitro angiogenesis tube formation assays. |
| CRISPR-Cas9 Nickase (Integrated DNA Tech) | BE (Genome Editing) | Engineered Cas9 variant that nicks single DNA strands, reducing off-target effects for precise genetic modifications. |
| MTT Cell Proliferation Assay Kit (Cayman Chem) | BME (Biocompatibility) | Colorimetric assay to quantify cell metabolic activity/viability, used for testing material cytotoxicity. |
Table 3: Comparative Quantitative Metrics in Recent Literature (2019-2024)
| Metric | Typical Bioengineering Study (Focus: Platform) | Typical Biomedical Engineering Study (Focus: Therapy) |
|---|---|---|
| Primary Output | Novel algorithm, genetic circuit, or material property data. | Device performance specs or in vivo efficacy/safety data. |
| Time to Initial Result | 3-6 months (rapid design-build-test cycles). | 12-24 months (extensive biocompatibility testing required). |
| Key Performance Indicator (KPI) | Predictability (R² of model vs. data), yield (mg/L), throughput. | Biocompatibility (% viability, hemolysis), efficacy (% stenosis reduction). |
| Common Validation Model | In vitro (cell line), in silico, or simple model organism (yeast, E. coli). | In vitro (primary cells), then validated in rodent or porcine in vivo model. |
| Regulatory Path Consideration | Indirect or pre-competitive. | Directly informs FDA/EMA submission (e.g., 510(k), PMA). |
| Sample Size Justification | Statistical power for model parameter estimation. | Statistical power to show superiority/non-inferiority to standard of care. |
The discourse surrounding "bioengineering" versus "biomedical engineering" is a foundational element in understanding the convergence of biology, engineering, and medicine. This whitepaper operates within the thesis that:
- Biomedical Engineering (BME) is classically defined as the application of engineering principles and design concepts to medicine and biology for healthcare purposes (e.g., medical devices, imaging systems, prosthetics). Its scope is predominantly applied, with a patient- and clinically-oriented focus.
- Bioengineering (BE) is often the broader term, encompassing the integration of engineering with biological sciences at all scales—from the molecular to the ecological. It includes BME but also extends to areas like synthetic biology, biomaterials for non-medical uses, and metabolic engineering.
The "Core Scientific Pillars" discussed herein represent the convergence point of these disciplines. This guide focuses on the integrated methodologies where biological discovery (Biology), quantitative analysis and design (Engineering), and translational application (Medicine) are inseparable, particularly in modern drug development.
Quantitative Landscape of Convergent Research
Recent data (2023-2024) highlights the growth and impact of convergent research. The following table summarizes key metrics from funding analyses and publication trends.
Table 1: Quantitative Indicators of Convergence in Bioengineering/Biomedical Research
| Indicator | Value/Source | Description & Implication |
|---|---|---|
| NIH Investment in Convergent Approaches | ~$3.2 Billion (FY2023) | Estimated allocation across NIH institutes for projects explicitly integrating engineering, physical sciences, and life sciences. Signals institutional priority. |
| Annual Growth in "Convergence" Publications | 12-15% (2020-2024) | Rate derived from PubMed/Scopus queries for terms like "convergence science," "organ-on-a-chip," and "quantitative systems pharmacology." |
| Market Size for Organs-on-Chips | $320.5 Million (2024) | Projected global market, growing at CAGR of 34.2%. Serves as a proxy for adoption of engineered biological systems in drug development. |
| Clinical Trial Success Rate (Oncology) | ~5.3% (Phase I to Approval) | Benchmark against which convergent tools (e.g., patient-derived organoids for preclinical testing) aim to improve predictive validity. |
| High-Throughput Screening Capacity | >100,000 compounds/week | Current capability of integrated robotic liquid handling, automated microscopy, and AI-based image analysis platforms. |
Experimental Protocols: Methodologies at the Convergence
Protocol: Functional Drug Screening using Patient-Derived Organoids (PDOs)
This protocol exemplifies convergence: Biology (patient tumor biology), Engineering (microfabrication, fluidics), Medicine (personalized therapeutic response).
1. PDO Establishment & Culture:
- Material: Surgically resected or biopsied tumor tissue.
- Dissociation: Mechanically mince tissue, then enzymatically digest with Collagenase/Hyaluronidase (2 mg/mL) in Advanced DMEM/F12 for 1-2 hours at 37°C.
- Embedding: Resuspend cell clusters in Cultrex Reduced Growth Factor Basement Membrane Extract (BME). Plate 50 μL domes in pre-warmed 24-well plates. Polymerize BME at 37°C for 30 min.
- Culture: Overlay with organoid-specific medium containing niche factors (e.g., R-spondin-1, Noggin, Wnt3a). Culture at 37°C, 5% CO₂, with medium changes every 3-4 days. Passage every 7-14 days via mechanical/BME dome disruption and enzymatic dissociation.
2. High-Content Screening Workflow:
- Seeding for Assay: Dissociate PDOs to single cells/small clusters. Seed into 384-well microplates pre-coated with BME at a density of 500-1000 cells/well.
- Compound Treatment: After 72h of growth, add compound library via acoustic liquid handling (nL volumes). Include DMSO controls and reference cytotoxic agents. Use at least 8-point dose-response curves.
- Incubation & Staining: Treat for 120h. Stain live with 4 μM Calcein-AM (viability) and 2 μM Ethidium Homodimer-1 (cytotoxicity) for 1h.
- Imaging & Analysis: Acquire 9-field confocal images per well using an automated high-content microscope (e.g., 10x objective). Use integrated analysis software to segment organoids and quantify metrics: Total Organoid Area (TOA), Viability Index (Calcein+ area/TOA), and morphological parameters.
Protocol: Quantifying Intracellular Signaling Dynamics via FRET Biosensors
This protocol applies engineering principles (optics, kinetics) to measure biological signaling in live cells for mechanistic drug profiling.
1. Biosensor Transduction & Cell Preparation:
- Material: Lentiviral particles encoding an AKT or ERK FRET biosensor (e.g., Eevee-iAkt or Eevee-iERK).
- Transduction: Seed target cells (e.g., HEK293, cancer cell line) in a 6-well plate. At 50% confluency, add viral supernatant with 8 μg/mL polybrene. Spinfect at 1000 × g for 1h at 32°C. Replace medium after 24h.
- Selection & Seeding: Apply puromycin selection (1-2 μg/mL) for 72h to enrich transduced cells. Seed selected cells onto 35mm glass-bottom imaging dishes.
2. Live-Cell Imaging & Stimulation:
- Imaging Setup: Use an inverted microscope with environmental control (37°C, 5% CO₂), a dual-emission photometry system, or a sensitive CCD camera. Use a 440 nm laser for CFP excitation; collect emissions at 480 nm (CFP channel) and 535 nm (FRET/YFP channel).
- Baseline Acquisition: Acquire ratiometric (535nm/480nm) images every 30 seconds for 5 minutes to establish baseline FRET.
- Stimulation: Perfuse pre-warmed medium containing stimulus (e.g., 100 ng/mL EGF for ERK activation) or drug inhibitor. Continue acquisition for 45-60 minutes.
- Calibration: At endpoint, add saturating inhibitor (e.g., 10 μM LY294002 for AKT) and ionomycin/Forskolin to define minimum and maximum FRET ratios.
3. Data Analysis:
- For each cell, calculate R = FRET channel intensity / CFP channel intensity over time.
- Normalize to baseline: ΔR/R₀ = (R - R₀) / R₀.
- Extract kinetic parameters: Time to peak, Amplitude, and Decay half-life.
Visualization of Convergent Concepts
Diagram 1: PI3K-AKT-mTOR Pathway & Pharmacological Inhibition
Diagram 2: PDO High-Content Screening Experimental Workflow
The Scientist's Toolkit: Key Research Reagent Solutions
Table 2: Essential Materials for Convergent Cell-Based Assays
| Item | Function & Rationale |
|---|---|
| Basement Membrane Extract (BME, e.g., Cultrex) | Solubilized extracellular matrix proteins that gelate at 37°C. Provides a 3D scaffold mimicking the in vivo niche for organoid culture. Critical for maintaining polarized structures and signaling. |
| Organoid Growth Media Supplements (R-spondin-1, Noggin, Wnt3a) | Recombinant proteins that recapitulate key stem cell niche signaling pathways (Wnt, BMP inhibition). Essential for the long-term expansion of stem cell-derived organoids. |
| Lentiviral FRET Biosensors (e.g., Eevee-iAKT) | Genetically encoded molecular tools for real-time, live-cell quantification of kinase activity. Enables dynamic measurement of drug effects on signaling networks with high spatiotemporal resolution. |
| Live-Cell Fluorescent Dyes (Calcein-AM, Ethidium Homodimer-1) | Viability/Cytotoxicity indicators. Calcein-AM (permeant, esterase-activated) marks live cells green. EthD-1 (impermeant, DNA-binding) marks dead cells red. Allows multiplexed endpoint analysis in high-content screens. |
| Tyrosine Kinase Inhibitor Library | A curated collection of small molecules targeting diverse kinase nodes. Used in phenotypic screens to map signaling dependencies and identify synergistic drug combinations. |
| Acoustic Liquid Handler (e.g., Echo) | Non-contact, nanoliter-scale compound transfer instrument. Enables rapid, precise, and miniaturized compound dosing for high-throughput dose-response assays, conserving precious reagents like PDOs. |
| Automated Confocal Imager (e.g., ImageXpress) | Microscope system with automated stage, environmental control, and confocal optics. Allows for high-resolution, multi-dimensional (z-stack, time, multi-channel) imaging of 3D models in microplates. |
| AI-Powered Image Analysis Software (e.g., CellProfiler, IN Carta) | Software that uses machine learning algorithms to segment complex 3D objects (organoids), extract hundreds of morphological and intensity features, and classify phenotypes beyond simple viability. |
Key Professional Societies and Their Defining Publications (e.g., BMES vs. AIChE)
1. Introduction Within the broader thesis on defining the scope of bioengineering versus biomedical engineering, professional societies and their flagship publications serve as critical demarcations of intellectual focus, professional identity, and technical discourse. This guide provides a technical comparison of key societies, their defining publications, and the experimental paradigms they champion, tailored for researchers and drug development professionals.
2. Society Comparison: Core Data The following table summarizes quantitative data and core foci for four major societies.
Table 1: Key Professional Societies - Data and Scope Comparison
| Society | Full Name & Acronym | Primary Discipline | Flagship Journal(s) & Impact Factor (approx.) | Approx. Membership |
|---|---|---|---|---|
| BMES | Biomedical Engineering Society | Biomedical Engineering | Annals of Biomedical Engineering (~4.0) | 7,000+ |
| AIChE | American Institute of Chemical Engineers | Chemical Engineering | AIChE Journal (~3.8); Biotechnology Progress (~2.6) | 60,000+ |
| APS | American Physical Society | Physics | Physical Review Letters (~9.0); Physical Review E (~2.4) | 50,000+ |
| IEEE EMBS | IEEE Engineering in Medicine and Biology Society | Electrical/Bioengineering | IEEE Transactions on Biomedical Engineering (~4.4) | 10,000+ |
Table 2: Defining Research Scope and Applications
| Society | Defining Research Scope | Typical Application in Drug Development |
|---|---|---|
| BMES | Human health-centric: biomechanics, biomaterials, tissue engineering, medical devices. | Biomaterial scaffolds for drug delivery, engineered tissue models for toxicity screening. |
| AIChE | Molecular-scale processes, transport phenomena, reaction kinetics, scalable bioprocessing. | Bioreactor design for monoclonal antibody production, downstream purification process optimization. |
| APS | Fundamental physical principles in biological systems: mechanobiology, biophysical dynamics. | Single-molecule studies of drug-target interactions, microfluidic device physics for lab-on-a-chip. |
| IEEE EMBS | Biomedical instrumentation, signal/image processing, computational modeling, neuroengineering. | Wearable biosensors for pharmacokinetics, medical imaging analysis for therapeutic monitoring. |
3. Experimental Protocol Paradigms Each society emphasizes distinct methodological approaches. Below are detailed protocols representative of their core literature.
3.1 BMES-Focused Protocol: In Vitro Hydrogel Scaffold for 3D Cell Culture
- Objective: To create a biomimetic 3D microenvironment for testing cell-drug interactions.
- Materials: See "The Scientist's Toolkit" (Section 5).
- Methodology:
- Hydrogel Preparation: Methacrylated gelatin (GelMA) is dissolved in PBS containing 0.5% w/v lithium phenyl-2,4,6-trimethylbenzoylphosphinate (LAP) photoinitiator at 37°C.
- Cell Encapsulation: Target cells (e.g., HepG2) are trypsinized, counted, and resuspended in the GelMA precursor solution at a density of 5x10^6 cells/mL.
- Crosslinking: 100 µL of the cell-laden solution is pipetted into a cylindrical mold (5mm diameter) and exposed to 405 nm UV light (5 mW/cm²) for 60 seconds to initiate photocrosslinking.
- Culture & Dosing: Constructs are transferred to 24-well plates, immersed in complete media, and cultured for 48 hours. Media is then replaced with media containing serial dilutions of the drug candidate.
- Analysis (72h post-dose): Viability is assessed via Live/Dead staining (calcein AM/ethidium homodimer-1) and confocal microscopy. Metabolic activity is quantified using a resazurin-based assay.
3.2 AIChE-Focused Protocol: Fed-Batch Bioreactor Kinetics for mAb Production
- Objective: To determine the kinetics of cell growth and monoclonal antibody (mAb) production in a controlled bioreactor.
- Materials: CHO cell line, proprietary chemically defined media and feed, 5L benchtop bioreactor, off-gas analyzer, metabolite analyzer (e.g., Nova Bioprofile), protein A HPLC.
- Methodology:
- Bioreactor Setup & Inoculation: A 5L bioreactor is equipped with control loops for pH (maintained at 7.0±0.1 via CO₂/sparge), dissolved oxygen (maintained at 40% air saturation via cascade control), and temperature (37°C). It is inoculated at a viable cell density (VCD) of 0.5x10^6 cells/mL.
- Batch Phase: Process parameters (VCD, viability, glucose, lactate, glutamine, ammonia) are monitored daily. The batch phase continues until glucose is depleted to <1 g/L.
- Fed-Batch Phase: A pre-defined nutrient feed is initiated per a predetermined exponential feed rate profile, designed to maintain a specific growth rate (µ) of 0.15 day⁻¹.
- Sampling & Analytics: Daily samples are taken for off-line analysis: VCD/viability (via trypan blue exclusion), metabolite concentrations (bioprofile analyzer), and mAb titer (Protein A HPLC).
- Modeling: Data is fit to a Monod-type kinetic model where µ = µmax * [S]/(Ks + [S]), and the Luedeking-Piret equation is used to correlate mAb production rate to growth (α) and non-growth (β) associated coefficients.
4. Visualizing Core Concepts and Workflows
Diagram 1: BMES 3D Hydrogel Drug Screening Workflow (82 chars)
Diagram 2: AIChE Fed-Batch Bioreactor Kinetic Model (75 chars)
5. The Scientist's Toolkit: Key Research Reagent Solutions
Table 3: Essential Materials for Featured Protocols
| Item | Function | Representative Protocol |
|---|---|---|
| Methacrylated Gelatin (GelMA) | Photocrosslinkable hydrogel polymer providing a tunable, biomimetic 3D extracellular matrix for cell culture. | BMES Hydrogel Scaffold |
| Lithium Phenyl-2,4,6-trimethylbenzoylphosphinate (LAP) | A cytocompatible photoinitiator that generates free radicals under visible/UV light to crosslink GelMA. | BMES Hydrogel Scaffold |
| Chemically Defined Media & Feed | Serum-free, precisely formulated nutrients essential for controlled cell growth and product expression in bioprocessing. | AIChE Fed-Batch Bioreactor |
| Protein A Affinity Resin/Cartridge | Chromatography medium that specifically binds the Fc region of antibodies, enabling rapid quantification (HPLC) or purification of mAbs. | AIChE Fed-Batch Bioreactor |
| Off-Gas Analyzer (O₂, CO₂) | Measures oxygen uptake rate (OUR) and carbon dioxide evolution rate (CER) in bioreactor exhaust, key for metabolic analysis. | AIChE Fed-Batch Bioreactor |
From Bench to Bedside: Methodologies and Cutting-Edge Applications in Research & Development
This technical guide details core methodologies within bioengineering, a discipline fundamentally concerned with the analysis, design, and construction of biological systems for targeted applications. This stands in contrast to biomedical engineering, which is primarily focused on the application of engineering principles to medicine and biology for healthcare purposes (e.g., prosthetics, imaging). Here, we dissect the three pillars enabling the transition from biological insight to industrial-scale production.
Synthetic Biology: Constructing Novel Biological Systems
Synthetic biology applies engineering principles to biology for the design and assembly of novel biological components (genes, pathways) and systems. Core to this is the Design-Build-Test-Learn (DBTL) cycle.
Experimental Protocol: Golden Gate Assembly for Modular Construct Assembly
Objective: Assemble multiple DNA fragments (e.g., promoter, gene, terminator) into a destination vector in a single reaction. Materials: DNA fragments with Type IIS restriction sites (e.g., BsaI), BsaI-HFv2 restriction enzyme, T4 DNA Ligase, appropriate buffer, destination vector. Procedure:
- Design: Ensure all fragments have compatible 4-base overhangs generated by BsaI cleavage.
- Reaction Setup: Combine ~50-100 ng of each fragment and vector in equimolar ratios. Add 1 µL BsaI-HFv2, 1 µL T4 DNA Ligase, 1X T4 Ligase Buffer. Total volume: 20 µL.
- Cycling: Incubate in a thermocycler: 37°C for 5 mins (digestion), 20 cycles of (37°C for 3 mins, 16°C for 4 mins) (ligation), 50°C for 5 mins, 80°C for 10 mins (enzyme inactivation).
- Transformation: Transform 2-5 µL into competent E. coli, plate on selective media, and screen colonies.
Diagram Title: Design-Build-Test-Learn (DBTL) Cycle in Synthetic Biology
Metabolic Engineering: Rewiring Cellular Metabolism
Metabolic engineering modifies the metabolic pathways of organisms to optimize the production of target compounds. It integrates genomics, transcriptomics, and flux balance analysis.
Experimental Protocol: CRISPR-Cas9 Mediated Gene Knockout in Yeast
Objective: Disrupt a specific gene in S. cerevisiae to redirect metabolic flux. Materials: pCAS plasmid (expressing Cas9), pRNA plasmid (expressing gRNA), homologous repair template, yeast strain, LiAc/SS carrier DNA/PEG transformation mix. Procedure:
- gRNA Design: Design a 20-nt guide sequence targeting the gene of interest, clone into pRNA plasmid.
- Transformation: Co-transform 100 ng each of pCAS and pRNA plasmids, plus 1 µg of repair template (if needed), into competent yeast cells using the LiAc method.
- Selection & Screening: Plate on appropriate selective media (e.g., -Ura, -Leu). Screen colonies via colony PCR and Sanger sequencing to confirm knockout.
- Phenotypic Analysis: Measure growth (OD600) and product titers (e.g., via HPLC) in controlled bioreactors.
Key Metabolic Engineering Data (2023-2024)
Table 1: Representative Metabolic Engineering Achievements in Model Organisms
| Organism | Target Product | Engineering Strategy | Max Titer (Reported) | Yield (g/g glucose) | Key Pathway Modified |
|---|---|---|---|---|---|
| E. coli | 1,4-Butanediol | Heterologous pathway from Klebsiella, redox balancing | 24 g/L | 0.35 | TCA Cycle, Glycolysis |
| S. cerevisiae | β-Carotene | MVA pathway amplification, cytosolic storage engineering | 2.1 g/L | 0.022 | Mevalonate Pathway |
| C. glutamicum | L-Lysine | Attenuation of feedback inhibition, transporter engineering | 120 g/L | 0.55 | Aspartate Family Pathway |
| Y. lipolytica | Omega-3 Fatty Acids | Heterologous PUFA synthase, peroxisomal engineering | 25% of DCW | N/A | Fatty Acid Synthesis |
Bioprocess Design: Scaling from Flask to Factory
Bioprocess design integrates upstream (biocatalyst development, media optimization) and downstream (product separation, purification) operations to achieve economically viable production.
Experimental Protocol: Fed-Batch Fermentation for High-Density Cultivation
Objective: Maximize cell density and product titer while minimizing metabolic by-products. Materials: Bioreactor with DO/pH/temperature control, sterile feed stock (concentrated carbon/nitrogen source), base (e.g., NH4OH) for pH control, antifoam, inoculum culture. Procedure:
- Batch Phase: Inoculate bioreactor with 5-10% v/v inoculum. Allow cells to consume initial batch nutrients (e.g., 20 g/L glucose). Monitor OD600 and DO.
- Fed-Batch Initiation: Begin exponential feed of concentrated feed solution (e.g., 500 g/L glucose) when batch carbon is depleted (DO spike). Feed rate is calculated to maintain a specific growth rate (µ) below inhibitory levels.
- Process Control: Maintain DO >20% via cascaded agitation/sparging with O2-enriched air. Control pH with base addition. Sample periodically for OD600, substrate, and product analysis.
- Harvest: Terminate at peak productivity or when oxygen transfer becomes limiting. Cool and harvest broth for downstream processing.
Diagram Title: Integrated Bioprocess Design Workflow
The Scientist's Toolkit: Essential Research Reagent Solutions
Table 2: Key Reagents and Materials for Featured Experiments
| Item Name | Function/Application | Example Vendor(s) |
|---|---|---|
| BsaI-HFv2 Restriction Enzyme | Type IIS enzyme for precise DNA fragment generation in Golden Gate assembly. | NEB, Thermo |
| T4 DNA Ligase | Joins DNA fragments with compatible overhangs or blunt ends. | NEB, Thermo |
| pCAS Series Plasmids | Express Cas9 nuclease for CRISPR-mediated genome editing in various hosts. | Addgene, Yeast Toolkit |
| LiAc/SS Carrier DNA/PEG Mix | Chemical transformation mixture for efficient DNA uptake in yeast. | Sigma-Aldrich, In-house prep |
| Defined Fermentation Media (e.g., CDM) | Chemically defined medium for reproducible microbial growth and metabolite production. | Teknova, Custom |
| DO & pH Probes (Sterilizable) | Real-time monitoring of dissolved oxygen and pH in bioreactors for process control. | Mettler Toledo, Hamilton |
| Protein A/G Affinity Resin | High-specificity capture of antibodies or Fc-fusion proteins during downstream purification. | Cytiva, Thermo |
| HPLC Columns (C18, HILIC) | Analytical separation and quantification of metabolites, sugars, and organic acids. | Agilent, Waters |
The distinction between bioengineering and biomedical engineering often centers on scope. Bioengineering is broadly defined as the application of engineering principles to a wide range of biological systems, potentially including agriculture, environmental science, and biotechnology. Biomedical engineering is a specialized subset, explicitly focused on human health and medicine, developing technologies for diagnosis, treatment, and prevention of disease. This whitepaper examines three core biomedical engineering methodologies—Medical Imaging, Biomechanics, and Biomaterial Design—that epitomize the field's clinical and translational focus, directly addressing human medical needs.
Medical Imaging: Quantitative Modalities and Protocols
Medical imaging provides non-invasive visualization and quantification of anatomical structures and physiological processes. Recent advances emphasize quantitative, data-driven diagnostics.
Core Modalities and Quantitative Parameters
The following table summarizes key performance and application data for current primary clinical imaging modalities.
Table 1: Quantitative Comparison of Primary Medical Imaging Modalities
| Modality | Spatial Resolution | Temporal Resolution | Key Quantitative Outputs | Primary Clinical Applications (Examples) |
|---|---|---|---|---|
| CT (Computed Tomography) | 0.2 - 0.5 mm | ~0.3 sec/rotation | Hounsfield Units (HU), Calcium Scoring, Tumor Volume | Trauma, Oncology (staging), Pulmonary embolism |
| MRI (Magnetic Resonance) | 0.5 - 1.0 mm (clinical) | Seconds to minutes | T1/T2 Relaxation Times, ADC Maps (diffusion), CBF (perfusion) | Neuroimaging, MSK soft tissue, Cardiac function |
| PET (Positron Emission Tomography) | 4 - 5 mm | Minutes | Standardized Uptake Value (SUV), Metabolic Rate | Oncology (metastasis), Neurology (Amyloid plaque) |
| Ultrasound | 0.1 - 0.5 mm | 20 - 50 ms/frame | Strain Elastography, Blood Flow Velocity (Doppler) | Obstetrics, Cardiology (echo), Vascular studies |
| Photoacoustic Imaging | 0.1 - 0.3 mm | Seconds | Hemoglobin Concentration, Oxygen Saturation | Angiogenesis monitoring, Sentinel lymph node mapping |
Data synthesized from recent literature (2023-2024). ADC=Apparent Diffusion Coefficient; CBF=Cerebral Blood Flow.
Experimental Protocol: Dynamic Contrast-Enhanced MRI (DCE-MRI) for Tumor Perfusion
Objective: To quantify microvascular permeability and blood flow in a tumor using DCE-MRI. Reagents/Materials: Gadolinium-based contrast agent (e.g., Gd-DTPA), MRI-compatible syringe pump, 3T MRI scanner with dynamic T1-weighted sequence. Protocol:
- Patient/Subject Preparation: Secure IV line for contrast injection. Position subject in scanner.
- Pre-Contrast Scanning: Acquire baseline T1 maps using variable flip angle sequences (e.g., 2°, 5°, 10°, 15°).
- Dynamic Acquisition: Initiate a fast T1-weighted gradient echo sequence (e.g., TWIST or VIBE). After 5 baseline frames, administer contrast agent via power injector at 2-3 mL/s, followed by saline flush.
- Data Acquisition: Continue dynamic scanning for 5-10 minutes post-injection.
- Data Analysis:
- Use pharmacokinetic modeling (e.g., Tofts model) on a voxel-by-voxel basis.
- Fit the time-concentration curve to solve for parameters: Ktrans (volume transfer constant), ve (extravascular extracellular space), and kep (reflux rate constant).
DCE-MRI Quantitative Analysis Workflow
Research Reagent Solutions for Medical Imaging
Table 2: Key Research Reagents for Advanced Imaging
| Reagent/Material | Function | Example Product/Note |
|---|---|---|
| Gd-Based MRI Contrast Agent | Shortens T1 relaxation, enhancing signal in perfusion & angiography. | Gadavist (Gadobutrol); Research: Targeted Gd nanoparticles. |
| 18F-FDG Radiotracer | Glucose analog for PET; accumulates in metabolically active cells (e.g., tumors). | Must be produced in an on-site cyclotron facility due to short half-life. |
| Targeted Microbubbles | Ultrasound contrast agents; bind to specific molecular markers (e.g., VEGFR2). | BR55 (Bracco) for molecular ultrasound imaging. |
| Indocyanine Green (ICG) | NIR fluorescence and photoacoustic contrast agent for surgical guidance. | Used in fluorescence-guided oncology surgery. |
| Ferumoxytol | Iron oxide nanoparticle; off-label use as an MRI contrast agent with long blood pool retention. | Used for MR angiography and macrophage imaging. |
Biomechanics: From Tissue Scales to Medical Devices
Biomechanics applies mechanical principles to biological systems, analyzing forces, motion, and material properties.
Quantitative Properties of Biological Tissues
Table 3: Mechanical Properties of Human Tissues
| Tissue/ Material | Young's Modulus (MPa) | Ultimate Tensile Strength (MPa) | Key Mechanical Function |
|---|---|---|---|
| Cortical Bone | 15,000 - 20,000 | 50 - 150 | Resist bending and compressive loads. |
| Articular Cartilage | 0.7 - 15 (in compression) | 5 - 25 | Provide low-friction, load-bearing surface. |
| Tendon/Ligament | 200 - 2,000 | 50 - 100 | Transmit tensile forces from muscle to bone. |
| Skin | 0.1 - 2 | 2.5 - 16 | Provide protective, elastic covering. |
| Aorta | 0.1 - 0.5 | 0.4 - 1.7 | Distensible conduit for pulsatile blood flow. |
Note: Properties are highly strain-rate and location dependent.
Experimental Protocol: Biaxial Tensile Testing of Planar Soft Tissue
Objective: To characterize the anisotropic, non-linear elastic properties of a soft tissue sample (e.g., heart valve leaflet, skin). Materials: Biaxial testing machine with 4 independent actuators, load cells, tissue bath (for PBS at 37°C), surgical sutures, digital image correlation (DIC) system. Protocol:
- Sample Preparation: Dissect tissue into a ~20x20 mm square. Mark surface with a speckle pattern for DIC. Suture each edge to a set of 4-5 rakes connected to actuators.
- System Calibration: Calibrate load cells and cameras. Zero actuators.
- Preconditioning: Subject the sample to 10 cycles of equibiaxial strain (e.g., 10% strain) to achieve a repeatable mechanical response.
- Testing Protocol: Apply displacement-controlled loading protocols:
- Equibiaxial: Both axes stretched simultaneously to equal ratios.
- Strip Biaxial: Stretch one axis while keeping the other at a constant low force.
- Data Collection: Synchronously record forces from all four actuators and full-field strain maps from DIC cameras.
- Analysis: Fit stress-strain data to a constitutive hyperelastic model (e.g., Fung orthotropic model) to determine material parameters.
Biaxial Soft Tissue Testing Workflow
Biomaterial Design: Engineering for the Biological Environment
Biomaterial design involves creating synthetic or modified natural materials that interact with biological systems for therapeutic or diagnostic purposes.
Key Properties of Major Biomaterial Classes
Table 4: Characteristics of Primary Biomaterial Classes
| Class | Example Materials | Degradation Time | Key Advantages | Primary Applications |
|---|---|---|---|---|
| Non-Degradable Metals | 316L SS, Ti-6Al-4V, Co-Cr alloys | Non-degradable | High strength, fatigue resistance | Fracture fixation, joint replacements, stents |
| Biodegradable Polymers | PLGA, PCL, PGA | Weeks to years | Tunable degradation, drug delivery | Sutures, scaffolds, controlled release devices |
| Hydrogels | Alginate, PEG, Hyaluronic acid | Days to months (often) | High water content, tissue-like | Tissue engineering, wound dressings, drug depots |
| Bioactive Ceramics | Hydroxyapatite, Bioglass 45S5 | Months to years (slow) | Osteoconduction, bone bonding | Bone graft substitutes, coatings |
| Decellularized ECM | Porcine heart valve, Urinary bladder | Integrates/remodels | Native composition & structure | Regenerative medicine scaffolds |
Experimental Protocol: Synthesis and Characterization of a Drug-Loaded PLGA Nanoparticle
Objective: To create and characterize poly(lactic-co-glycolic acid) nanoparticles for sustained drug release. Materials: PLGA (50:50 LA:GA), dichloromethane (DCM), polyvinyl alcohol (PVA), model drug (e.g., Doxorubicin), probe sonicator, stir plate, centrifugation, dynamic light scattering (DLS) instrument, dialysis tubing. Protocol:
- Nanoparticle Formation (Single Emulsion):
- Dissolve 100 mg PLGA and 5 mg drug in 5 mL DCM (oil phase).
- Add oil phase to 20 mL of 1-3% w/v aqueous PVA solution.
- Emulsify using a probe sonicator on ice (60% amplitude, 2 min).
- Stir overnight to evaporate DCM.
- Purification: Centrifuge suspension at 15,000 rpm for 30 min. Wash pellet with DI water 2-3 times to remove PVA and unencapsulated drug.
- Characterization:
- Size & Zeta Potential: Resuspend in DI water, analyze via DLS.
- Drug Loading: Lyse a known nanoparticle mass in DMSO. Quantify drug concentration via UV-Vis spectroscopy against a standard curve.
- Release Kinetics: Place nanoparticle suspension in dialysis bag, immerse in PBS (pH 7.4, 37°C) under gentle agitation. Sample release medium at time points (1h, 4h, 1d, 3d, 7d, etc.) and assay for drug content.
Key Signaling Pathway in Biomaterial Integration: Foreign Body Response
The foreign body response is a critical determinant of biomaterial success or failure.
Foreign Body Response to Biomaterial Implantation
Research Reagent Solutions for Biomaterial Design
Table 5: Essential Reagents for Biomaterial Synthesis & Testing
| Reagent/Material | Function | Example Application |
|---|---|---|
| PLGA (Poly(lactic-co-glycolic acid)) | Biodegradable polymer backbone with tunable degradation rate. | Nanoparticles, porous scaffolds, sutures. |
| Polyethylene Glycol (PEG) | Hydrophilic polymer; confers "stealth" properties, reduces protein adsorption. | PEGylation of surfaces, hydrogel crosslinker. |
| RGD Peptide | Cell-adhesive peptide sequence (Arg-Gly-Asp); promotes integrin binding. | Covalent grafting to materials to enhance cell adhesion. |
| AlamarBlue / MTT | Metabolic activity assays for in vitro cytocompatibility testing. | Quantifying cell viability on biomaterial surfaces. |
| Lipopolysaccharide (LPS) | Toll-like receptor 4 agonist; used to stimulate an inflammatory response in vitro. | Testing anti-inflammatory properties of biomaterials. |
The methodologies of Medical Imaging, Biomechanics, and Biomaterial Design exemplify the applied, human-health focus of biomedical engineering. They converge in modern solutions: imaging guides the placement and monitors the performance of biomaterial-based devices (e.g., a resorbable stent) within the dynamic biomechanical environment of the body. This integrative, problem-solving approach, firmly rooted in clinical translation, continues to define the core scope of biomedical engineering within the broader bioengineering landscape.
Within the academic discourse on bioengineering vs. biomedical engineering, the development of novel pharmaceuticals represents a critical intersection. Bioengineering, emphasizing the application of engineering principles to molecular and cellular systems, is the driving force behind engineered therapeutics—bio-molecules themselves are the product of design. Conversely, biomedical engineering, with its focus on applying engineering to whole organisms and medical devices, heavily informs advanced drug delivery systems—the engineered vehicles and methods for transporting drugs. This guide provides a technical comparison of these two pillars of modern pharmacotherapy.
Engineered Therapeutics: Design at the Molecular Level
Engineered therapeutics are drugs whose core active structure is synthetically designed or biologically engineered. This field is a direct manifestation of bioengineering at the molecular scale.
Core Modalities & Experimental Protocols
A. Monoclonal Antibodies (mAbs) and Bispecifics:
- Protocol (Cell Line Development for mAb Production):
- Gene Construction: Clone genes for antibody heavy and light chains into mammalian expression vectors (e.g., CHO-compatible plasmids).
- Transfection: Co-transfect CHO-S cells using polyethyleneimine (PEI) method.
- Selection & Screening: Apply selective pressure (e.g., methotrexate for dhfr- system). Screen high-producing clones via ELISA and fed-batch shake flask assays.
- Single-Cell Cloning: Perform limiting dilution cloning to ensure clonality.
- Banking: Create Master and Working Cell Banks from the lead clone.
B. Cell Therapies (CAR-T):
- Protocol (CAR-T Cell Manufacturing):
- Leukapheresis: Isolate patient PBMCs.
- T-cell Activation: Stimulate T-cells using anti-CD3/CD28 antibodies.
- Viral Transduction: Transduce activated T-cells with a lentiviral vector encoding the CAR construct (e.g., anti-CD19 scFv-CD28-CD3ζ). A spinoculation protocol (centrifugation at 2000 x g, 90 min, 32°C) enhances transduction.
- Expansion: Culture cells in X-VIVO 15 media with IL-2 (100 IU/mL) for 7-10 days.
- Formulation & Cryopreservation: Harvest, wash, and cryopreserve in CryoStor CS10.
C. Gene Therapies (AAV Vectors):
- Protocol (AAV Vector Production via Triple Transfection):
- Plate HEK293T cells in a multilayer flask system.
- Transfect with three plasmids: i) AAV Rep/Cap plasmid, ii) Adenoviral Helper plasmid, iii) ITR-flanked transgene plasmid, using PEI-pro.
- Harvest cells and media at 72 hours post-transfection.
- Purify via iodixanol gradient ultracentrifugation followed by ion-exchange chromatography.
- Titer via qPCR (genome titer) and ELISA (capsid titer).
Key Signaling Pathways in Engineered Therapeutics
CAR-T Cell Activation Signaling Pathway
Drug Delivery Systems: Engineering for Spatiotemporal Control
Drug Delivery Systems (DDS) are technologies designed to control the rate, time, and location of drug release within the body—a key biomedical engineering challenge.
Core Platforms & Experimental Protocols
A. Lipid Nanoparticles (LNPs) for siRNA/mRNA:
- Protocol (Microfluidic Formulation of mRNA-LNPs):
- Prepare Lipid Mix: Dissolve ionizable lipid (e.g., DLin-MC3-DMA), DSPC, cholesterol, and PEG-lipid in ethanol at a defined molar ratio (e.g., 50:10:38.5:1.5).
- Prepare Aqueous Phase: Dilute mRNA in citrate buffer (pH 4.0).
- Formulation: Use a staggered herringbone micromixer. Pump lipid (in ethanol) and aqueous phases at a 3:1 flow rate ratio (e.g., 12 mL/min : 4 mL/min) using syringe pumps.
- Buffer Exchange & Dialysis: Immediately dilute the output in PBS (pH 7.4) and dialyze against PBS for 18 hours at 4°C to remove ethanol and adjust pH.
- Characterization: Measure size (DLS), PDI, encapsulation efficiency (RiboGreen assay), and zeta potential.
B. Polymeric Micelles for Chemotherapy:
- Protocol (Dialysis Method for Paclitaxel-Loaded Micelles):
- Co-dissolution: Dissolve diblock copolymer (e.g., PEG-PDLLA) and paclitaxel in acetonitrile.
- Film Formation: Remove solvent by rotary evaporation to form a thin, dry film.
- Hydration: Hydrate the film with PBS (pH 7.4) above the polymer's critical micelle temperature (e.g., 60°C) with gentle agitation.
- Dialysis: Dialyze the suspension against PBS for 24 hours to remove unentrapped drug and organic solvent.
- Filtration: Pass through a 0.22 µm filter to sterilize and remove aggregates.
Quantitative Comparison & Research Toolkit
Table 1: Comparative Analysis of Engineered Therapeutics vs. Drug Delivery Systems
| Parameter | Engineered Therapeutics (e.g., CAR-T, AAV) | Drug Delivery Systems (e.g., LNP, Polymeric Micelle) |
|---|---|---|
| Primary Objective | Create a novel bioactive molecule/cell. | Optimize pharmacokinetics/pharmacodynamics of an existing drug. |
| Key Metric (Potency) | EC50, IC50, Cytolytic Activity (in vitro). | Loading Capacity (%), Encapsulation Efficiency (%). |
| Key Metric (Performance) | Functional Titer (IU/mL), Transduction Efficiency (%). | Drug Release Profile (% over time), Circulation Half-life (hours). |
| Major Cost Driver | Vector/Cell Manufacturing Complexity, Quality Control. | Scalability of Nanoformulation, Raw Material Purity. |
| Regulatory Highlight | Genomic Stability, Insertional Mutagenesis Risk. | Particle Heterogeneity (PDI), In Vivo Biodistribution/Toxicity. |
| Typical Development Time | 8-12 years (lengthy CMC and clinical safety phases). | 5-8 years (can be faster for reformulations). |
The Scientist's Toolkit: Essential Research Reagents & Materials
| Item Name | Function in Research |
|---|---|
| HEK293T Cells | Standard cell line for transient protein and viral vector production (e.g., AAV, Lentivirus). |
| CHO-K1/CHO-S Cells | Industry-standard mammalian host for stable cell line development and recombinant protein production. |
| Lentiviral Packaging Mix (3rd Gen) | Plasmid system for safe production of replication-incompetent lentiviral vectors. |
| Ionizable Cationic Lipid (DLin-MC3-DMA) | Critical component of LNPs for encapsulating nucleic acids via electrostatic interaction. |
| PEG-lipid (DMG-PEG2000) | Provides a hydrophilic stealth coating on nanoparticles, reducing clearance by the mononuclear phagocyte system. |
| Anti-CD3/CD28 Magnetic Beads | For robust activation and expansion of human T-cells in vitro. |
| RiboGreen Assay Kit | Fluorescent quantification of free vs. encapsulated RNA/DNA in nanoparticles. |
| Size Exclusion Chromatography (SEC) Columns | For purifying nanoparticles and aggregates from unencapsulated drugs/nucleic acids. |
Workflow for Developing an LNP-based mRNA Therapeutic
LNP-mRNA Therapeutic Development Workflow
Convergence and Future Outlook
The distinction between engineered therapeutics and drug delivery systems is increasingly blurred. LNPs are themselves engineered nanoparticles, and they deliver engineered mRNA. This synergy is the epitome of applied bioengineering. Future directions include smart delivery systems that release biologics in response to disease-specific stimuli and integrated therapeutics where the delivery vector is intrinsically therapeutic. Advancing these fields requires a deep understanding of both molecular-scale design (bioengineering) and system-level pharmacokinetics (biomedical engineering), driving the integrated evolution of both disciplines.
Tissue Engineering and Regenerative Medicine (TERM) represents a quintessential convergence point within the broader discipline of Bioengineering. This field operationalizes the core bioengineering paradigm: the application of engineering principles and quantitative analysis to biological systems to solve medical problems. While Biomedical Engineering often emphasizes the development of devices and diagnostic tools (e.g., MRI machines, prosthetics), Bioengineering encompasses a broader scope that includes the manipulation of biological molecules, cells, and tissues themselves. TERM is fundamentally a bioengineering endeavor, as it requires the integration of cells, scaffolds, and signaling factors—the "tissue engineering triad"—to create functional biological substitutes. This whitepaper serves as a technical guide to the core collaborative frontiers in TERM, emphasizing experimental rigor and current methodologies for a research-focused audience.
Core Principles and Quantitative Landscape
The foundation of TERM rests on emulating native tissue microenvironment. Key quantitative parameters define scaffold design and cell behavior.
Table 1: Critical Scaffold Design Parameters for TERM Applications
| Parameter | Typical Range/Value | Influence on Cell Behavior & Tissue Formation |
|---|---|---|
| Porosity | 70-95% | Influences cell infiltration, nutrient diffusion, and vascularization. |
| Pore Size | 50-300 μm (varies by tissue) | Osteogenesis: >100μm; Angiogenesis: 5-15μm; Neural: 10-100μm. |
| Elastic Modulus | kPa to GPa range | Mechanotransduction; Soft tissue (brain: 0.1-1 kPa), bone (~20 GPa). |
| Degradation Rate | Weeks to months | Must match rate of new tissue deposition; controlled via polymer choice (e.g., PLGA, PCL). |
| Fiber Diameter (Electrospun) | 100 nm - 10 μm | Mimics collagen fibrils; influences cell adhesion, morphology, and differentiation. |
Table 2: Key Cell Sources and Their Characteristics
| Cell Source | Advantages | Challenges / Considerations |
|---|---|---|
| Primary Autologous | No immune rejection, patient-matched. | Limited expansion capability, donor site morbidity. |
| Mesenchymal Stem/Stromal Cells (MSCs) | Multipotent, immunomodulatory, readily isolated. | Donor variability, potential for heterogenous populations. |
| Induced Pluripotent Stem Cells (iPSCs) | Unlimited expansion, patient-specific, pluripotent. | Teratoma risk, high cost, complex differentiation protocols. |
| Immortalized Cell Lines | Consistent, readily available. | Not fully representative of primary physiology, genetic alterations. |
Detailed Experimental Protocols
Protocol: Fabrication of a Gradient Porosity Scaffold via 3D-Bioprinting for Osteochondral Tissue
Objective: To create a scaffold with spatially varying porosity to mimic the transition from subchondral bone (high density) to cartilage (low density).
Materials:
- Bioink A (Bone Layer): 8% (w/v) Alginate, 5% (w/v) nano-hydroxyapatite (nHA), 2 x 10^6/mL human MSCs.
- Bioink B (Cartilage Layer): 4% (w/v) Alginate, 2% (w/v) GelMA, 2 x 10^6/mL human MSCs.
- Crosslinking Solution: 100 mM CaCl₂.
- 3D Bioprinter (extrusion-based).
- Sterile PBS.
Methodology:
- Bioink Preparation: Prepare Bioinks A and B separately under sterile conditions. Maintain at 4°C until printing to prevent premature crosslinking.
- CAD Model Design: Design a cylindrical scaffold (Ø10mm x 4mm) with a digitally defined gradient. The bottom 2mm is assigned printing parameters for Bioink A (smaller nozzle, slower speed for denser structure). The top 2mm is assigned parameters for Bioink B (larger nozzle, faster speed for more porous structure).
- Printing Process: Load bioinks into separate sterile cartridges. Print the scaffold layer-by-layer into a well plate maintained at 10°C.
- Crosslinking: Immediately after printing, immerse the scaffold in 100 mM CaCl₂ solution for 15 minutes to ionically crosslink the alginate.
- Post-processing: Rinse 3x with sterile PBS. Transfer to chondrogenic medium (for top) or osteogenic medium (for bottom) for in vitro culture. Media can be separated using a transwell or by carefully layering.
- Assessment: At 7, 14, and 28 days, analyze for viability (Live/Dead assay), osteogenic markers (ALP, calcium deposition) in the bottom zone, and chondrogenic markers (sGAG production, collagen II) in the top zone.
Protocol: High-Content Screening of Biochemical Cues on iPSC-Derived Cardiomyocyte Maturation
Objective: To systematically identify small molecule or growth factor combinations that enhance structural and functional maturation of iPSC-derived cardiomyocytes (iPSC-CMs).
Materials:
- 96-well plate with optically clear bottom.
- iPSC-CMs (day 10 of differentiation).
- Library of 20 candidate factors (e.g., T3 hormone, IGF-1, Dexamethasone, Forskolin).
- Automated liquid handling system.
- High-content imaging system with environmental control.
- Fixation and staining reagents: anti-α-actinin, anti-TNNI3 (cardiac troponin I), DAPI, Phalloidin.
- Fluorescent calcium-sensitive dye (e.g., Cal-520 AM).
Methodology:
- Plate Preparation: Seed iPSC-CMs at 20,000 cells/well in 96-well plates. Allow to attach for 48 hours in basal maintenance medium.
- Factor Application: Using an automated liquid handler, create a matrix of conditions with single factors and combinations (n=4 per condition). Include negative (maintenance medium) and positive (prolonged culture) controls.
- Culture and Treatment: Treat cells for 14 days, with medium change every 48 hours.
- Endpoint Analysis (Day 14):
- Functional: Load cells with Cal-520 AM in Tyrode's solution. Record spontaneous calcium transients for 60 seconds at 100 fps. Analyze calcium transient duration (CaD80), frequency, and decay tau.
- Structural: Fix and stain for α-actinin, TNNI3, and F-actin. Acquire 20x images per well using high-content imager. Analyze sarcomere length (via FFT of α-actinin signal), cell size, and myofibril alignment.
- Data Analysis: Use multivariate analysis (e.g., principal component analysis) to cluster conditions based on functional and structural maturity parameters. Identify top 3 candidate cocktails for further validation in 3D engineered heart tissue models.
Signaling Pathways in TERM
The differentiation and function of cells in TERM constructs are governed by conserved signaling pathways.
Diagram 1: Core Signaling in Osteogenic Differentiation
Diagram 2: Key Pathways in Angiogenesis for Vascularization
The Scientist's Toolkit: Key Research Reagent Solutions
Table 3: Essential Materials for a Standard 3D In Vitro TERM Experiment
| Item / Reagent | Function & Rationale |
|---|---|
| Gelatin Methacryloyl (GelMA) | A photopolymerizable hydrogel derived from ECM; provides cell-adhesive RGD motifs and tunable mechanical properties via UV crosslinking. |
| Polycaprolactone (PCL) | An FDA-approved, slow-degrading polyester for extrusion 3D printing; provides structural integrity for load-bearing applications. |
| Recombinant Human TGF-β3 | Key cytokine for inducing chondrogenic differentiation of MSCs; activates SMAD2/3 pathway for collagen II and aggrecan production. |
| Y-27632 (ROCK Inhibitor) | Enhances survival of dissociated single cells (e.g., during bioprinting) by inhibiting apoptosis triggered by loss of cell-matrix adhesion. |
| AlamarBlue / CellTiter-Glo | Metabolic and ATP-based assays, respectively, for non-destructive, longitudinal monitoring of cell viability and proliferation in 3D constructs. |
| 4',6-Diamidino-2-Phenylindole (DAPI) | Nuclear counterstain for fluorescence microscopy; essential for quantifying total cell number and visualizing construct architecture. |
| Matrigel / Basement Membrane Extract | A complex, biologically-derived ECM mixture; used for organoid culture and in vivo assays to support angiogenesis and cell invasion. |
| BMP-2 Protein | Potent osteoinductive growth factor; used in bone regeneration studies to drive osteogenic commitment via the SMAD1/5/8 pathway. |
| DyLight or Alexa Fluor-conjugated Antibodies | For multiplex immunofluorescence staining of 3D constructs, enabling visualization of multiple ECM proteins and cell markers simultaneously. |
| LIVE/DEAD Viability/Cytotoxicity Kit | Uses calcein-AM (green, live) and ethidium homodimer-1 (red, dead) to provide a direct visual assessment of cell viability post-processing. |
Future Collaborative Frontiers
The next evolution of TERM lies in deeper collaboration with systems biology, AI, and advanced manufacturing. Organ-on-a-chip platforms represent a microfluidic convergence, allowing for the precise study of tissue-level physiology and drug responses. The integration of machine learning for the design of biomaterials and prediction of cell-scaffold outcomes is accelerating discovery. Furthermore, in vivo bioreactors and electrospun smart scaffolds with controlled release of multiple morphogens are moving the field towards true clinical regeneration of complex tissues like whole joints and organ patches. This trajectory underscores TERM's position at the heart of bioengineering, where the lines between built device and grown tissue are strategically blurred to restore function.
The differentiation between Bioengineering (BE) and Biomedical Engineering (BME) is foundational to understanding the evolution of diagnostic tools. BME traditionally focuses on the application of engineering principles to medicine, emphasizing the design, development, and maintenance of medical devices (e.g., MRI, pacemakers) for diagnosis and therapy. In contrast, BE takes a broader, more fundamental approach, integrating engineering with biological sciences at the molecular and cellular level to create novel biological systems or components. Biosensors are quintessential BE tools, merging biorecognition elements with transducers to create integrated analytical devices. This whitepaper provides a technical comparison, framing biosensors as BE's molecular-scale, integrative diagnostic platforms versus BME's system-level, applied medical devices.
Technical Comparison: Core Principles & Metrics
Table 1: Fundamental Comparison of Biosensors vs. Traditional Medical Diagnostic Devices
| Feature | Biosensors (Bioengineering) | Traditional Medical Devices (Biomedical Engineering) |
|---|---|---|
| Core Principle | Integration of biological recognition element (enzyme, antibody, nucleic acid, cell) with a physicochemical transducer. | Application of physical (e.g., electrical, mechanical, acoustic) or imaging principles to measure physiological parameters. |
| Scale of Interaction | Molecular (µM to pM) to cellular. | Tissue, organ, and whole-body systemic. |
| Primary Output | Quantification of a specific analyte concentration. | Image, physiological waveform, or physical measurement (e.g., pressure, flow). |
| Key Metrics | Sensitivity, Limit of Detection (LOD), Specificity, Dynamic Range, Response Time. | Accuracy, Precision, Sensitivity/Specificity (for diagnostic devices), Safety, Reliability. |
| Development Focus | Interface Design: Biocompatibility, bioreceptor immobilization, signal transduction efficiency. | System Integration: Hardware/software robustness, user interface, patient safety, regulatory compliance. |
| Typical Form Factor | Miniaturized, potential for point-of-care, wearable, or implantable formats. | Bench-top systems (e.g., clinical analyzers) or dedicated bedside/portable units. |
| Example Technologies | Glucose biosensor (electrochemical), SPR-based immunoassay, CRISPR-based nucleic acid sensor. | Electrocardiogram (ECG), Magnetic Resonance Imaging (MRI) scanner, Blood Pressure Monitor. |
Table 2: Quantitative Performance Comparison for Glucose Monitoring
| Parameter | Continuous Glucose Monitor (CGM) Biosensor | Hospital Blood Gas Analyzer (Medical Device) |
|---|---|---|
| Technology Basis | Electrochemical enzyme (glucose oxidase) biosensor. | Photometric/electrochemical multi-analyte clinical analyzer. |
| Sample Type | Interstitial fluid. | Arterial/venous whole blood. |
| Measurement Frequency | Continuous (every 1-5 mins). | Discrete, single time-point. |
| Result Lag Time | 5-15 minutes. | 1-2 minutes. |
| Reported Accuracy (MARD) | 9-10% for leading systems. | Typically <2% coefficient of variation. |
| Primary Use Case | Personal diabetes management, trend analysis. | Critical care diagnostics, laboratory reference. |
Experimental Protocols
Protocol for Fabricating a Model Electrochemical Glucose Biosensor (BE Approach)
Objective: To construct a working amperometric glucose biosensor using screen-printed carbon electrodes (SPCEs). Materials: See "The Scientist's Toolkit" below. Methodology:
- Electrode Pretreatment: Clean SPCEs by applying +1.5V for 60s in 0.1M PBS (pH 7.4).
- Nanomaterial Modification: Deposit 5 µL of graphene oxide (GO) dispersion (2 mg/mL) onto the working electrode. Dry at 37°C. Electrochemically reduce GO to rGO by performing cyclic voltammetry (CV) from -1.5V to 0.5V in PBS.
- Enzyme Immobilization: Mix 10 µL of GOx (10 mg/mL) with 10 µL of Nafion (1% v/v). Pipette 5 µL of the mixture onto the rGO-modified working area. Allow to dry at 4°C for 2 hours.
- Biosensor Calibration: Perform amperometry at +0.7V (vs. Ag/AgCl reference) in stirred PBS. Record steady-state current upon successive additions of glucose standard solutions (0.1, 0.5, 1, 2, 5 mM).
- Sample Analysis: Measure current response for diluted serum samples. Calculate concentration from the calibration curve.
Protocol for Validating a Cardiac Monitoring Device (BME Approach)
Objective: To assess the accuracy of a novel ECG patch device against a standard 12-lead ECG machine. Materials: Novel ECG patch device, FDA-cleared 12-lead ECG machine, conductive gel, data acquisition software. Methodology:
- Subject Preparation: Clean skin sites for standard limb and precordial leads (V1-V6) and for the patch electrodes per manufacturer instructions.
- Simultaneous Data Acquisition: Attach both the standard ECG electrodes and the novel patch device. Record 5 minutes of resting ECG data from both systems simultaneously in a synchronized manner.
- Signal Processing: Extract representative, artifact-free 10-second intervals. For the patch, derive lead-II equivalent signals. For the 12-lead ECG, use the standard lead II.
- Parameter Comparison: Use automated algorithms to calculate: Heart Rate (HR), RR interval, PR interval, QRS duration, QT interval. Perform Bland-Altman analysis to determine the limits of agreement between the two devices for each parameter.
- Statistical Analysis: Calculate mean difference (bias) and 95% confidence intervals. Correlation coefficients (Pearson's r) should exceed 0.95 for key intervals to meet clinical agreement standards.
Visualizations
Diagram 1: Biosensor Core Signaling Pathway
Diagram 2: BE vs. BME Diagnostic Development Workflow
The Scientist's Toolkit: Key Research Reagent Solutions
Table 3: Essential Materials for Electrochemical Biosensor Development
| Item | Function | Example/Supplier |
|---|---|---|
| Screen-Printed Electrodes (SPCEs) | Disposable, low-cost electrochemical cell with integrated working, reference, and counter electrodes. | Metrohm DropSens, BASi. |
| Biological Recognition Element | Provides specificity by binding the target analyte. | Enzymes (Sigma-Aldrich), Antibodies (Abcam), Aptamers (BasePair Bio). |
| Crosslinking Agents | Covalently immobilize bioreceptors onto transducer surfaces to enhance stability. | Glutaraldehyde, EDC/NHS chemistry. |
| Conductive Nanomaterials | Increase electrode surface area, enhance electron transfer, and improve sensitivity. | Graphene oxide, Carbon nanotubes, Gold nanoparticles. |
| Nafion Perfluorinated Resin | Cation-exchange polymer used to encapsulate enzymes, reduce interference, and stabilize the biocomposite layer. | Sigma-Aldrich (5% w/w in aliphatic alcohols). |
| Electrochemical Analyzer | Instrument to apply potentials and measure current, voltage, or impedance. | PalmSens4, CH Instruments, Biologic SP-300. |
| Redox Mediators | Shuttle electrons between enzyme active site and electrode, lowering operating potential. | Ferrocene derivatives, Potassium ferricyanide. |
Navigating Translational Challenges: Troubleshooting and Optimization in Interdisciplinary Projects
Common Pitfalls in Scaling Bioengineered Systems from Lab to Production
Within the broader thesis on bioengineering versus biomedical engineering, this guide focuses on the core bioengineering challenge of scale translation. Bioengineering, defined as the application of engineering principles to manipulate biological systems for fundamental research or industrial production, fundamentally contends with scaling complexity. This contrasts with biomedical engineering's focus on applying engineering to solve human health problems, often at a defined patient or clinical scale. The pitfalls discussed herein are central to bioengineering's scope in moving from benchtop discovery to commercial bioreactor.
Core Technical Pitfalls & Quantitative Analysis
Metabolic and Transport Limitations
Lab-scale cultures often operate in a well-mixed, nutrient-rich regime. Production-scale bioreactors introduce gradients in dissolved oxygen, pH, and nutrients, leading to heterogeneous cell populations and suboptimal yields.
Table 1: Common Parameter Shifts from Lab to Production Scale
| Parameter | Typical Lab Scale (1-10 L) | Typical Production Scale (1,000-20,000 L) | Impact of Discrepancy |
|---|---|---|---|
| Mixing Time | Seconds | 10s to 100s of seconds | Nutrient/gradient zones, stress responses |
| O₂ Mass Transfer (kLa) | High (e.g., 50-150 h⁻¹) | Lower, harder to maintain | Anaerobic pockets, altered metabolism |
| Shear Stress | Low (gentle agitation) | High (sparger/impeller) | Cell damage, viability loss |
| Heat Transfer | Rapid (surface area/volume high) | Slow (surface area/volume low) | Overheating, cooling lag times |
| pO₂/pCO₂ Control | Tight, rapid response | Slower feedback loops | Oscillating dissolved gas levels |
Cell Line Instability and Genetic Drift
Extended passaging required for production can lead to the loss of plasmid or transgene expression, or the selection of faster-growing, low-producing subpopulations.
Table 2: Instability Metrics in Common Production Cell Lines
| Cell System | Typical Lab-Scale Passage # | Max Stable Passages for Production | Common Genetic Drift Mechanism |
|---|---|---|---|
| CHO (Recombinant Protein) | <50 | ~60-80 | Gene amplification loss, promoter silencing |
| HEK 293 (Viral Vectors) | <30 | ~40-50 | Rearrangements in viral genome inserts |
| E. coli (Plasmid-based) | <15 generations | ~50-70 generations | Plasmid segregation without selection |
| Yeast (Integrated Pathway) | <25 | ~100+ | Generally stable; copy number variation |
Detailed Experimental Protocols for Scale-Down Validation
Protocol 1: Mimicking Production-Scale Gradients in a Lab Bioreactor
Objective: To replicate the dissolved oxygen (DO) oscillation profiles observed in large tanks using a bench-top (e.g., 5L) bioreactor.
- Equipment: Bench-top bioreactor with programmable logic control (PLC) for gas mixing (O₂, N₂, air) and agitation speed.
- Calibration: Calibrate DO and pH probes per manufacturer specs.
- Baseline Run: Perform a standard batch fermentation with constant DO control (e.g., 30%) via PID loop. Record cell density, viability, and product titer.
- Oscillation Simulation Program: Program the PLC to cyclically alter the O₂ mixing ratio to induce a sine-wave DO oscillation between 10% and 50% saturation, with a period of 120-300 seconds (simulating poor mixing zones).
- Parallel Run: Repeat the fermentation with identical parameters except for the DO oscillation program.
- Analysis: Compare final titer, specific productivity (qP), and transcriptomic/metabolomic profiles (via RNA-seq and LC-MS) between the stable and oscillating runs. A significant drop (>15%) in titer under oscillation signals high scale-up risk.
Protocol 2: Extended Passaging Stability Study
Objective: Quantify the loss of specific productivity over serial passages simulating a production seed train.
- Cell Culture: Start with a Master Cell Bank (MCB) vial of the production cell line (e.g., CHO-S expressing an mAb).
- Seed Train Simulation: Passage cells at a defined seeding density (e.g., 0.3 x 10⁶ cells/mL) and split ratio every 3-4 days. Maintain parallel lineages (n≥3).
- Sampling: At every 5th passage, inoculate a standardized 14-day production assay in ambr 250 or similar micro-bioreactor. Use consistent medium and feed strategy.
- Analytics: Measure integrated viable cell density (IVCD) and final titer via HPLC or Octet. Calculate specific production rate (qP = titer / IVCD).
- Genomic Analysis: At Passage 0, 25, 50, and endpoint, perform ddPCR or next-gen sequencing on the transgene locus to assess copy number and integrity.
- Modeling: Plot qP vs. passage number. Fit a decay curve (e.g., exponential decay). A decay constant indicating >20% loss before the required production passage number necessitates clone re-screening or process modification.
Visualizing Scaling Challenges
Diagram Title: From Lab Homogeneity to Production Heterogeneity
Diagram Title: Scale-Down Model Validation Workflow
The Scientist's Toolkit: Research Reagent Solutions
Table 3: Essential Materials for Scaling Studies
| Item | Function in Scaling Research | Example Vendor/Product |
|---|---|---|
| ambr 250 High-Throughput Bioreactor System | Parallel, automated micro-bioreactors (100-250 mL) for scale-down modeling and clone screening. | Sartorius |
| Programmable Benchtop Bioreactors with Advanced Gas Mixing | Allows precise simulation of production-scale DO and pCO₂ oscillations. | Eppendorf BioFlo, Applikon ez-Control |
| Single-Use Bioreactors (SUB) - 50L to 2000L | Pilot-scale vessels for intermediate validation, reducing cleaning validation and cross-contamination risk. | Cytiva Xcellerex, Thermo Fisher HyPerforma |
| Live-Cell Analyzers & Metabolomics Kits | Non-invasive monitoring of cell health and rapid quantification of metabolic fluxes (e.g., glucose, lactate, ammonia). | Agilent Seahorse XF, BioProfile FLEX2 |
| Droplet Digital PCR (ddPCR) | Absolute quantification of transgene copy number and detection of low-abundance genetic drift variants in cell banks. | Bio-Rad QX600 |
| Stability-Enhanced Expression Vectors | Utilizes genetic elements (e.g., S/MAR, UCOE) to mitigate transgene silencing during long-term passaging. | Sigma-Aldrich (Now MilliporeSigma) pUC-based vectors with UCOE. |
| Advanced Cell Culture Media & Feeds | Chemically defined, high-performance formulations designed to maintain productivity and viability at high cell densities in large tanks. | Gibco Dynamis, Irvine Scientific BCBoost. |
Navigating the path from lab to production requires moving beyond linear volumetric scaling. It demands a proactive bioengineering approach that uses scale-down models to simulate production heterogeneities, rigorous long-term stability testing, and a toolkit designed for predictive analysis. Success hinges on anticipating the integrated bioprocess and cellular metabolic challenges inherent in the true scope of bioengineering—mastering biological complexity at scale.
Optimizing Biomaterial Compatibility and Reducing Immunogenic Response
Within the broader thesis examining the definition and scope of Bioengineering versus Biomedical Engineering, this paper addresses a core challenge that bridges both disciplines. Biomedical engineering traditionally focuses on applying engineering principles to medicine, often involving the development of devices and prosthetics. Bioengineering, with its broader scope rooted in molecular and systems-level approaches, emphasizes the manipulation of biological systems themselves. The optimization of biomaterials for compatibility represents a convergence point: it requires the applied, problem-solving focus of biomedical engineering alongside the fundamental, molecular-scale understanding of host biology inherent to bioengineering. This guide details the technical strategies born from this interdisciplinary synthesis.
Foundational Immunology of Biomaterial Response
The foreign body response (FBR) is a sequential, immune-mediated process. Initial protein adsorption forms a provisional matrix on the implant surface ("Vroman effect"). This triggers acute inflammation (neutrophils, mast cells), followed by chronic inflammation (macrophages, lymphocytes). Macrophages fuse to form foreign body giant cells (FBGCs), culminating in fibrotic capsule formation, which isolates the implant and often leads to device failure.
Key Immunogenic Signaling Pathways in FBR
Diagram 1: TLR/NF-κB and Inflammasome Pathway in Biomaterial Response
Core Strategies for Optimization
Material Surface Modification
The primary interface dictating immune response.
Quantitative Comparison of Surface Modification Techniques:
| Technique | Typical Reduction in FBGCs (%) | Reduction in Capsule Thickness (vs. control) | Key Mechanism | Longevity In Vivo |
|---|---|---|---|---|
| PEGylation | 40-60% | ~30% | Steric hindrance, reduced protein adsorption | Moderate (weeks-months) |
| Zwitterionic Coating | 60-80% | 40-60% | Hydration layer, ultra-low fouling | High (months) |
| Heparin Immobilization | 50-70% | 35-55% | Binds anti-inflammatory factors, inhibits complement | Moderate |
| Peptide (e.g., RGD) Grafting | Variable (30-70%) | Variable | Directs specific cell adhesion, modulates macrophage polarization | Dependent on peptide stability |
| Topographic Nano-patterning (e.g., 15-20nm pillars) | Up to 90% | 50-70% | Physical disruption of macrophage fusion & signaling | High (intrinsic to material) |
Controlled Release of Immunomodulators
Local delivery minimizes systemic side effects.
Protocol: In Vitro Macrophage Polarization Assay for Drug-Eluting Biomaterial Screening
- Objective: To evaluate the capacity of a biomaterial-released agent to polarize human macrophages from a pro-inflammatory (M1) to an anti-inflammatory/pro-healing (M2) phenotype.
- Materials: THP-1 cell line (human monocytic), PMA (Phorbol 12-myristate 13-acetate), test biomaterial discs (with/without encapsulated agent), LPS (Lipopolysaccharide), IFN-γ, IL-4/IL-13, TRIzol, qRT-PCR reagents, flow cytometry antibodies (CD80, CD206).
- Method:
- Differentiate THP-1 monocytes into macrophages using 100 nM PMA for 48 hours.
- Seed macrophages onto test biomaterial discs placed in 24-well plates. Include control wells with tissue culture plastic.
- Stimulate all wells with LPS (100 ng/mL) and IFN-γ (20 ng/mL) for 24h to induce M1 phenotype.
- Replace media with fresh media containing IL-4/IL-13 (20 ng/mL each) for M2-positive control. For test groups, use fresh media only.
- Incubate for 72 hours, allowing agent release from the biomaterial to influence cells.
- Harvest: a) RNA for qRT-PCR analysis of M1 markers (TNF-α, IL-1β, iNOS) and M2 markers (ARG1, IL-10, CD206). b) Cells for flow cytometry analysis of surface CD80 (M1) and CD206 (M2).
- Calculate fold-change in gene expression and % positive cells for markers relative to LPS/IFN-γ (M1) control.
Biomimicry and Decellularized Matrices
Using native extracellular matrix (ECM) components provides inherent biological recognition.
Diagram 2: Workflow for Creating & Implanting Decellularized ECM Scaffolds
The Scientist's Toolkit: Key Research Reagent Solutions
| Reagent / Material Category | Specific Example(s) | Primary Function in Compatibility Research |
|---|---|---|
| Anti-inflammatory Cytokines for Local Release | IL-1Ra (Anakinra), IL-10, TGF-β1 | Encapsulated within biomaterials to locally antagonize pro-inflammatory signals and promote regulatory immune responses. |
| Small Molecule Immunomodulators | Dexamethasone, Rapamycin (Sirolimus), Tofacitinib (JAK inhibitor) | Incorporated into polymer coatings for sustained release to broadly suppress lymphocyte and macrophage activation. |
| Checkpoint Inhibitor Antibodies | Anti-PD-L1, Anti-CD47 (clone B6H12.2) | Immobilized on material surfaces to deliver "don't eat me" signals, preventing phagocytosis by macrophages. |
| Complement Inhibitors | FH (Factor H) peptides, Compstatin analogs | Coated onto surfaces to prevent activation of the complement cascade, a key initiator of the FBR. |
| Pro-resolving Mediators | Resolvin D1, Maresin 1 | Incorporated into hydrogels or microspheres to actively promote the resolution of inflammation rather than general immunosuppression. |
| ECM-Derived Peptides | RGD, DGEA, GFOGER, Laminin-derived peptides | Grafted onto synthetic materials to promote specific, integrin-mediated cell adhesion that favors healing over fibrosis. |
| Advanced Hydrogel Systems | Thiol-ene click PEG hydrogels, MMP-degradable HA hydrogels | Provide a tunable, hydrated 3D microenvironment that can be functionalized with cues and allow cell infiltration in a controlled manner. |
Advanced & Emerging Experimental Protocols
Protocol: In Vivo Quantitative Histomorphometry of the Foreign Body Capsule
- Objective: To standardize the retrieval and analysis of implanted biomaterials for capsule thickness, cellular composition, and collagen density.
- Materials: Small animal model (e.g., murine subcutaneous or intraperitoneal model), explanted biomaterial with surrounding tissue, 10% neutral buffered formalin, paraffin embedding supplies, microtome, H&E stain, Masson's Trichrome stain, immunohistochemistry (IHC) antibodies (anti-CD68 for macrophages, anti-αSMA for myofibroblasts), light/fluorescent microscope, ImageJ/FIJI software.
- Method:
- Implantation & Retrieval: Implant test and control materials (minimum n=5/group). Euthanize at predetermined endpoints (e.g., 1, 4, 12 weeks). Carefully dissect and retrieve the implant with a 2-3mm margin of surrounding tissue.
- Fixation & Sectioning: Fix tissue in formalin for 24-48h. Process, paraffin-embed, and section (5-7µm thickness). Take sections from the central region of the implant.
- Staining: Perform H&E (general morphology), Masson's Trichrome (collagen fibrosis - blue), and IHC for specific cell markers.
- Quantitative Analysis:
- Capsule Thickness: Using Trichrome-stained sections, take 8-12 radial measurements from the implant surface to the outer capsule edge around the entire circumference. Calculate mean and standard deviation.
- Cellular Density: Count nuclei per high-power field (HPF, 400x) in the capsule from H&E sections (5-8 fields/sample).
- Collagen Density: Use color deconvolution in ImageJ on Trichrome images to isolate the blue channel. Measure the percentage of blue-positive area within a defined region of interest (ROI) encapsulating the capsule.
- Cell-Specific Quantification: For IHC, report the number of positive cells per HPF or the percentage area of positivity.
Data-Driven Design Iteration
The optimization process is cyclical, reliant on quantitative feedback.
Diagram 3: The Biomaterial Optimization Feedback Loop
Optimizing biomaterial compatibility is a quintessential bioengineering challenge that demands a deep integration of materials science, immunology, and cellular biology. The path forward lies in moving from passive, inert materials to active, instructive platforms that dynamically communicate with the host immune system. This evolution perfectly encapsulates the synergy between biomedical engineering's design-for-application ethos and bioengineering's foundational pursuit of controlling biological interactions at a molecular level. Success will be measured by the seamless integration of future biomaterials, transforming them from tolerated objects into regenerative components of the host tissue.
Within the academic discourse on bioengineering versus biomedical engineering—where bioengineering encompasses the fundamental principles of engineering applied to biological systems, and biomedical engineering focuses on applying these principles specifically to medicine and healthcare—understanding the regulatory translation of innovations is paramount. For researchers and development professionals, navigating the U.S. Food and Drug Administration (FDA) framework is a critical step. This guide provides a technical comparison of the pathways for biologics and medical devices.
Foundational Regulatory Definitions and Centers
The FDA's organizational structure assigns products to different centers based on statutory definitions.
- Biologics (including Biosimilars): Regulated by the Center for Biologics Evaluation and Research (CBER). A biologic is defined under Section 351 of the Public Health Service Act (PHSA) and includes "a virus, therapeutic serum, toxin, antitoxin, vaccine, blood, blood component or derivative, allergenic product, protein, or analogous product... applicable to the prevention, treatment, or cure of a disease or condition."
- Medical Devices: Regulated by the Center for Devices and Radiological Health (CDRH). A device is defined under Section 201(h) of the Federal Food, Drug, and Cosmetic (FD&C) Act as an instrument, apparatus, or similar article intended for diagnosis, cure, mitigation, treatment, or prevention of disease, which does not achieve its primary intended purposes through chemical action or metabolism.
Combination products (e.g., a biologic with a delivery device) are assigned to a lead center based on the product's primary mode of action (PMOA).
Comparison of Regulatory Pathways: Key Quantitative Data
The following tables summarize the core pathways, review timelines, and associated metrics.
Table 1: Primary Marketing Authorization Pathways
| Aspect | Biologics (CBER) | Medical Devices (CDRH) |
|---|---|---|
| Premarket Pathway | Biologics License Application (BLA) | Premarket Approval (PMA); 510(k) Notification; De Novo Request |
| Legal Standard | Demonstration of safety, purity, and potency (PHSA) | Demonstration of reasonable assurance of safety and effectiveness (FD&C Act) |
| Typical Clinical Data Requirement | Substantial evidence from adequate and well-controlled investigations, often including two pivotal Phase 3 trials. | Varies: PMA requires valid scientific evidence for safety & effectiveness; 510(k) requires substantial equivalence to a predicate. |
| Manufacturing Review | Integral to BLA. Chemistry, Manufacturing, and Controls (CMC) section is reviewed in detail. Facility inspection via Pre-License Inspection (PLI). | Separate Quality System Regulation. Compliance via routine inspections under 21 CFR Part 820. |
| Post-Market Studies | Often required as Post-Marketing Requirements (PMRs) under Title 21 CFR 601.41. | Frequently mandated as Post-Approval Studies (PAS) for PMA devices. |
Table 2: Representative Review Timelines and Metrics (FY 2023)
| Metric | Biologics (BLA) | Medical Devices (PMA) | Medical Devices (510(k)) |
|---|---|---|---|
| FDA Performance Goal (Standard Review) | 10 months (from filing) | 180 days (administrative review clock) | 90 days (administrative review clock) |
| Actual Median Total Time* (Submission to Decision) | ~12-15 months | ~7-10 months | ~4-6 months |
| Approval/Clearance Rate | ~85-90% (for filed applications) | ~75-80% | ~82-85% |
| Typical Application Volume (Annual) | ~50-70 original BLAs | ~35-50 original PMAs | ~3,000 510(k)s |
Note: Timelines are highly variable and dependent on application quality, data robustness, and the need for review cycles.
Experimental Protocols Supporting Regulatory Submissions
The nature of evidence generation differs fundamentally between the two domains.
Protocol 1: Pivotal Phase 3 Clinical Trial for a Novel Therapeutic Biologic (e.g., Monoclonal Antibody)
- Objective: To evaluate the efficacy and safety of Drug X versus placebo in patients with moderate-to-severe Disease Y.
- Design: Randomized, double-blind, placebo-controlled, parallel-group, multicenter study.
- Population: N=500 patients meeting defined inclusion/exclusion criteria (e.g., specific biomarker status, disease activity score).
- Intervention: IV infusion of Drug X (dose Z mg/kg) or placebo every 2 weeks for 52 weeks.
- Primary Endpoint: Clinical response rate at Week 24 as defined by a validated composite index (e.g., ACR50 in rheumatology).
- Key Methodology: Regular clinical assessments, serial biomarker analysis (e.g., cytokine levels via multiplex ELISA), immunogenicity testing (anti-drug antibody assays), and pharmacokinetic sampling.
Protocol 2: Clinical Study for a High-Risk (PMA) Implantable Device (e.g., Neuromodulator)
- Objective: To evaluate the safety and effectiveness of Device A for the management of chronic Condition B.
- Design: Prospective, single-arm, multicenter, cohort study (often historical controls may be used).
- Population: N=150 patients refractory to standard medical management.
- Intervention: Implantation of Device A with standardized programming.
- Primary Effectiveness Endpoint: Proportion of subjects achieving a ≥50% reduction in symptom score at 90 days post-activation, sustained through 12 months.
- Primary Safety Endpoint: Incidence of serious device- or procedure-related adverse events through 12 months.
- Key Methodology: Implant procedure standardization, blinded endpoint adjudication committee, device performance data logging, and imaging (e.g., CT to confirm lead placement).
Visualizing the Regulatory Decision Logic
Diagram 1: Primary FDA Pathway Logic for Devices
Diagram 2: BLA Development & Review Workflow
The Scientist's Toolkit: Key Research Reagents & Materials
Table 3: Essential Reagents for Biologics & Device Interaction Studies
| Item | Function in Regulatory Science Context |
|---|---|
| Recombinant Human Proteins/Cytokines | Serve as reference standards in potency assays (e.g., cell-based bioassays) for biologics lot release testing. |
| Anti-Drug Antibody (ADA) Assay Kits | Critical for assessing immunogenicity of biologic therapeutics in non-clinical and clinical studies. |
| Primary Human Cell Lines (e.g., HUVEC, Osteoblasts) | Used in in vitro biocompatibility and functional testing for implantable devices (per ISO 10993). |
| ELISA/Multiplex Immunoassay Panels | Quantify biomarkers, residual host cell protein (HCP), or process impurities in biologic drug substance. |
| Extract Solution Media (e.g., MEM, Saline) | Used to prepare device extracts for in vitro cytotoxicity, sensitization, and irritation tests (ISO 10993-5, -10). |
| PCR Reagents for Residual DNA Testing | Quantify residual host cell DNA in biologic products, a key safety specification. |
| Size-Exclusion Chromatography (SEC) Columns | Analyze high molecular weight aggregates of biologics, a critical quality attribute affecting safety. |
| Simulated Body Fluids (SBF) | Assess in vitro degradation and bioactivity of biomaterials used in devices (e.g., absorbable implants). |
Data Integration Challenges in Multi-Omics and Physiological Modeling
This whitepaper addresses a critical frontier in modern bioengineering. While biomedical engineering often focuses on applying engineering principles to human health at the device and systemic level (e.g., prosthetics, imaging), bioengineering encompasses a broader, foundational scope that includes the integrative analysis and in silico modeling of biological systems from the molecular scale upwards. The challenge of multi-omics data integration epitomizes this bioengineering paradigm, requiring the development of novel computational frameworks, algorithms, and theoretical models to synthesize heterogeneous data into predictive physiological models—a core bioengineering endeavor distinct from, yet complementary to, traditional biomedical engineering applications.
Core Technical Challenges in Data Integration
Heterogeneity and Dimensionality
Multi-omics data types vary in scale, resolution, and noise characteristics. Integrating discrete (mutations) with continuous (gene expression) and probabilistic (protein-protein interactions) data remains a fundamental hurdle.
Table 1: Characteristics of Primary Omics Data Types
| Omics Layer | Typical Data Format | Scale (Per Sample) | Key Technical Noise Source |
|---|---|---|---|
| Genomics | Variant calls (VCF) | ~3-5 GB | Sequencing errors, alignment biases |
| Transcriptomics | Gene counts (Matrix) | ~0.5-1 GB | Batch effects, RNA degradation |
| Proteomics | Spectral counts/Intensity | ~0.2-0.5 GB | Ion suppression, low coverage |
| Metabolomics | Peak intensities (LC-MS) | ~0.1-0.3 GB | Instrument drift, matrix effects |
Temporal and Spatial Dynamics
Biological systems are not static. Capturing time-series (e.g., circadian rhythms, drug response) and spatially-resolved (e.g., tumor microenvironments, single-cell spatial transcriptomics) data adds layers of complexity to integration.
Data Processing and Normalization Incompatibility
Each omics technology requires a unique bioinformatics pipeline. Inconsistent normalization across datasets can introduce artifacts that obscure true biological signals.
Table 2: Common Normalization Methods by Omics Type
| Omics Layer | Exemplary Normalization Method | Primary Goal |
|---|---|---|
| RNA-Seq | TMM (Trimmed Mean of M-values), DESeq2's median-of-ratios | Correct for library size and composition |
| Proteomics (LC-MS) | MaxLFQ, iBAQ | Normalize across runs and by protein mass |
| Metabolomics | Probabilistic Quotient Normalization | Account for biological dilution variation |
| 16S rRNA Sequencing | Rarefaction, CSS (Cumulative Sum Scaling) | Handle uneven sequencing depth |
Experimental Protocols for Integrative Multi-Omics Studies
Protocol 1: Longitudinal Multi-Omics Profiling for Drug Response
Objective: To model temporal physiological response to a therapeutic intervention.
- Cohort & Sampling: Administer drug or placebo to matched subject cohorts. Collect serial biospecimens (blood, tissue biopsy if applicable) at pre-dose (T0), early (T1), mid (T2), and late (T3) time points.
- Multi-Omics Assaying:
- Genomics: Whole-exome sequencing from T0 baseline sample.
- Transcriptomics: RNA-Seq from PBMCs or tissue at all time points (T0-T3). Use poly-A selection, stranded library prep, 50M paired-end reads/sample.
- Proteomics & Phosphoproteomics: Liquid Chromatography-Tandem Mass Spectrometry (LC-MS/MS) on plasma and cell lysates. Use TMTpro 16-plex labeling for multiplexing. Enrich phosphopeptides using Fe-NTA or TiO2 beads.
- Metabolomics: Perform both targeted (for known metabolites) and untargeted LC-MS on plasma.
- Data Generation: Process each data layer through its dedicated pipeline (e.g., GATK for genomics, STAR+DESeq2 for RNA-Seq, MaxQuant for proteomics, XCMS for metabolomics).
- Integration: Apply a multi-step integration framework: a) Early Integration: Use dimensionality reduction (Multi-Omics Factor Analysis, MOFA) on concatenated normalized matrices. b) Late Integration: Construct separate network models per omics layer and then integrate using similarity network fusion (SNF). c) Knowledge-Based Integration: Map all data onto prior-knowledge signaling pathways (e.g., KEGG, Reactome) using tools like OmicsIntegrator or PaintOmics.
Protocol 2: Spatial Multi-Omics Integration via CODEX and GeoMx
Objective: To correlate cellular phenotype with omics readouts in tissue architecture.
- Tissue Preparation: Fresh-frozen or FFPE tissue sectioning.
- Spatial Protein Imaging: Use CODEX (Co-Detection by Indexing) with a panel of 40+ antibodies. Perform cyclic staining, imaging, and dye inactivation. Reconstruct whole-slide, single-cell protein expression maps.
- Region-of-Interest (ROI) Selection: Based on protein expression patterns (e.g., tumor core, invasive margin, stroma), select ROIs using GeoMx Digital Spatial Profiler.
- Spatial Transcriptomics/Proteomics: UV-cleave oligonucleotide tags from the selected ROIs. Harvest and sequence (RNA) or count (protein) the tags.
- Data Integration: Align spatial coordinates from CODEX and GeoMx. Use registration algorithms to create a unified coordinate system. Perform joint cell/region clustering across modalities. Train graph neural networks to predict transcriptomic profiles from high-plex protein images.
Visualization of Methodologies and Pathways
Diagram Title: Multi-Omics Data Integration Workflow
Diagram Title: EGFR Signaling & Multi-Omics Data Mapping
The Scientist's Toolkit: Key Research Reagent Solutions
Table 3: Essential Reagents and Materials for Multi-Omics Integration Studies
| Item Name / Kit | Vendor Example | Function in Multi-Omics Workflow |
|---|---|---|
| TMTpro 16-plex | Thermo Fisher Scientific | Isobaric labeling reagent for multiplexed quantitative proteomics, enabling parallel processing of up to 16 samples in one LC-MS/MS run. |
| TruSeq Stranded mRNA Kit | Illumina | Library preparation for RNA-Seq, preserving strand information for accurate transcript quantification. |
| Cell hashing antibodies | BioLegend | Oligonucleotide-conjugated antibodies for sample multiplexing in single-cell RNA-Seq, reducing batch effects and cost. |
| CITE-seq antibodies | TotalSeq, BioLegend | Antibodies conjugated to oligonucleotides for simultaneous surface protein and transcriptome measurement in single cells. |
| GeoMx Human Whole Transcriptome Atlas | NanoString | Oligo-tagged RNA probe set for spatially-resolved, whole-transcriptome profiling from FFPE or fresh-frozen tissue ROIs. |
| CODEX antibody conjugates | Akoya Biosciences | Metal-conjugated antibodies for high-plex (40+) cyclic immunofluorescence imaging of tissue sections. |
| Phosphoprotein Enrichment Kits (TiO2/Fe-NTA) | Pierce, Millipore | Magnetic bead-based enrichment of phosphorylated peptides for deep phosphoproteomic analysis. |
| AllPrep DNA/RNA/Protein Kit | Qiagen | Simultaneous purification of multiple molecular species from a single tissue or cell sample, minimizing source variation. |
The integration of multi-omics data into predictive physiological models represents a quintessential bioengineering challenge, demanding tools that transcend traditional disciplinary boundaries. Success hinges on the co-development of experimental standards, robust computational integration frameworks, and shared data ontologies. Future progress will likely be driven by AI/ML approaches, such as graph neural networks and multimodal deep learning, which can inherently learn from heterogeneous data structures. Overcoming these challenges is paramount for realizing the promise of precision medicine and constructing in silico digital twins of biological systems.
Strategies for Effective Cross-Training and Interdisciplinary Team Management
The distinction between bioengineering (broadly applying engineering principles to biological systems for applications like biomaterials, biomechanics, and computational biology) and biomedical engineering (more narrowly focused on human health and medical applications) creates a natural yet complex interdisciplinary environment. Successful therapeutic development hinges on managing teams that bridge these domains. Effective cross-training is not merely beneficial but essential to navigate the integrated experimental and computational workflows defining modern drug discovery.
Foundational Principles for Cross-Training
Cross-training must move beyond superficial overviews to foster functional literacy. The goal is for a computational biologist to understand the technical constraints of a wet-lab assay, and for a tissue engineer to grasp the assumptions in a pharmacokinetic model.
Core Tenets:
- Just-In-Time Knowledge: Training modules are deployed parallel to project milestones.
- Hands-On Symbiosis: Learning is embedded in collaborative tasks (e.g., joint analysis sessions).
- Jargon Deconstruction: Maintain a living glossary of terms across disciplines.
Quantitative Analysis of Cross-Training Impact
The following table summarizes key metrics from recent studies on interdisciplinary team performance in biopharmaceutical R&D.
Table 1: Impact of Structured Cross-Training on R&D Outcomes
| Metric | Pre-Cross-Training Baseline | Post-Cross-Training Outcome (12-18 months) | Data Source & Context |
|---|---|---|---|
| Project Cycle Time | 100% (Reference) | Reduction of 15-25% | Analysis of 10 mid-size biotechs (2023) |
| Protocol Revision Frequency | 3.2 major revisions per preclinical study | 1.8 major revisions per preclinical study | Longitudinal study, oncology drug development (2022-2024) |
| Cross-Domain Error Identification (Internal Audit) | 42% of critical errors identified post-data-lock | 78% identified during experimental design/analysis phase | Internal audit report, cardiovascular device developer (2024) |
| Team Innovation Index (Patent Disclosures) | 5.1 disclosures/year/team | 8.7 disclosures/year/team | Metric from a multinational Pharma R&D department (2023) |
Experimental Protocol: A Model for Integrated Team Training
This protocol outlines a collaborative session designed to cross-train molecular biologists and data scientists in the context of developing a gene therapy vector.
Title: Integrated Protocol for AAV Capsid Optimization: Combining High-Throughput Screening (HTS) and NGS Data Analysis.
Objective: To collaboratively design an HTS campaign for adeno-associated virus (AAV) capsid variants and analyze the resulting next-generation sequencing (NGS) data to identify leads with improved tropism.
Personnel: Molecular Biology Team (2), Data Science/Bioinformatics Team (2), Project Lead (1).
Workflow:
- Joint Design Phase (Week 1): Teams co-develop the capsid library strategy. Biologists define diversity regions based on known capsid structures. Data scientists design the NGS barcoding strategy for multiplexed tracking of variants in vivo.
- Parallel Execution with Shadowing (Weeks 2-5): Molecular team performs library production, animal injection, and tissue harvesting. Data scientists observe key steps. Data team prepares computational pipelines. Biologists observe pipeline validation on synthetic data.
- Integrated Analysis Sprint (Week 6): Teams work side-by-side. Biologists process tissue for DNA extraction and PCR-amplify capsid sequences. Data scientists process raw NGS reads, performing demultiplexing, alignment, and variant frequency quantification. Critical Joint Session: Teams use a shared visualization dashboard to correlate variant sequences with tissue tropism data, selecting leads for further validation.
Key Output: A shortlist of 5-10 capsid variants with statistically enriched targeting profiles for a specific tissue.
Management Strategies for Interdisciplinary Teams
Structural Recommendations:
- Dual Leadership: Appoint co-leads with complementary expertise (e.g., a bioengineer and a clinician) for complex projects.
- Hybrid Workspaces: Design lab/office spaces that physically collocate wet and dry lab personnel.
- Unified Data Management: Enforce a single source of truth for all project data (e.g., cloud-based ELN/LIMS with integrated computational notebooks).
Communication & Conflict Mitigation:
- Implement a "Peer Teaching" rotation where each team member presents their core methodology.
- Establish a "Pre-Mortem" protocol where the team anticipates potential failures across the disciplinary divide at project inception.
- Use structured decision frameworks (e.g., weighted scoring matrices) to objectively evaluate options when disciplinary biases conflict.
The Scientist's Toolkit: Essential Reagents & Solutions
Table 2: Research Reagent Solutions for Integrated Gene Therapy Workflow
| Item | Function in Protocol | Key Consideration for Cross-Discipline Understanding |
|---|---|---|
| AAV Capsid Library Kit (e.g., site-saturation mutagenesis) | Generates diverse variant pool for screening. | Biologist defines target residues; Data scientist must understand library complexity & representation bias. |
| Barcoded NGS Adapters | Uniquely tags each variant for multiplexed tracking in vivo. | Data scientist designs adapter set; Biologist must ensure compatibility with PCR cleanup protocols. |
| Tissue-Specific Nuclease | Digests non-target tissue capsid DNA, enriching for target tissue variants. | Biologist executes; Data scientist's model must account for this non-linear enrichment step. |
| Spike-In Control DNA | Synthetic DNA sequences with known concentration added pre-NGS. | Critical for both: Biologist adds it correctly; Data scientist uses it to normalize and calculate absolute variant abundance. |
| Cloud-Based Analysis Pipeline (e.g., Nextflow/Snakemake) | Automates NGS data processing from raw reads to variant counts. | Data scientist builds/maintains; Biologist must be able to run basic version and interpret QC outputs. |
In the convergent field of bio/biomedical engineering, the scope of research is defined by the ability to integrate tools and perspectives. Effective cross-training and team management are the operational engines that turn interdisciplinary potential into tangible therapeutic outcomes. By implementing structured, hands-on collaborative protocols and fostering an environment of mutual functional literacy, organizations can significantly accelerate the drug development pipeline and enhance innovation.
Career Paths and Impact Assessment: A Comparative Analysis for Scientific Professionals
This technical guide provides a comparative analysis of the core degree requirements and specializations for Bioengineering (BioE) and Biomedical Engineering (BME) programs. This analysis is framed within the broader thesis research on the definition and scope of these two closely related fields. While often used interchangeably, the distinction lies in their foundational approach: Bioengineering applies engineering principles broadly to biological systems, potentially including agriculture, environmental science, and biotechnology. Biomedical Engineering is a subset of Bioengineering specifically focused on human health and medicine, designing devices, diagnostics, and therapies for clinical application. For researchers, scientists, and drug development professionals, understanding the academic training underpinning each discipline is critical for collaboration, innovation, and translational research.
Core Degree Requirements: Quantitative Comparison
Analysis of current curricula from leading U.S. institutions (e.g., MIT, Johns Hopkins, UC Berkeley, Stanford) reveals distinct emphases in core undergraduate requirements. The following table summarizes typical credit-hour distributions.
Table 1: Comparison of Core Undergraduate Course Requirements
| Course Category | Bioengineering (BioE) Typical Credits | Biomedical Engineering (BME) Typical Credits | Key Distinctions |
|---|---|---|---|
| Mathematics & Core Engineering | 28-32 | 26-30 | Heavy overlap: Calculus, Differential Equations, Linear Algebra, Statistics. BioE may include more computational methods. |
| Fundamental Physical & Engineering Sciences | 24-28 | 20-24 | BioE: Strong emphasis on Transport Phenomena, Thermodynamics, Chemical Reaction Kinetics. BME: Stronger focus on Circuit Theory, Signals & Systems, Biomechanics. |
| Biological Sciences | 20-24 | 20-22 | Overlap: Biology, Biochemistry, Cell Biology. BioE often requires Microbiology, Systems Biology. BME requires Human Physiology, Anatomy. |
| Engineering Depth & Capstone | 16-20 | 18-22 | BioE: Bioprocess Engineering, Biomolecular Engineering. BME: Biomedical Instrumentation, Biomechanics, Biomaterials. Both include a year-long design capstone. |
| Laboratory & Design | 10-14 | 12-16 | BioE labs focus on quantitative measurement in biological systems, bioreactors. BME labs focus on physiological measurements, medical device prototyping. |
Specializations and Research Tracks
Advanced study and research specializations further delineate the fields. The following table outlines common specializations at the graduate level.
Table 2: Common Graduate Specializations and Research Foci
| Specialization Area | Typical in Bioengineering (BioE) | Typical in Biomedical Engineering (BME) | Relevance to Drug Development |
|---|---|---|---|
| Cellular & Molecular Engineering | Core focus. Genetic circuit design, synthetic biology, metabolic engineering. | Applied to tissue engineering, drug delivery vector design. | Enables engineered cell therapies, biocatalysis for synthesis, gene therapy platforms. |
| Biomechanics & Mechanobiology | Often applied to biomaterials and cell-matrix interactions. | Core focus. Orthopedic biomechanics, cardiovascular mechanics, rehabilitation. | Informs drug delivery in mechanical tissues (e.g., cartilage) and device-tissue integration. |
| Biomedical Imaging & Optics | Development of novel contrast agents, molecular imaging probes. | Core focus. Medical imaging systems (MRI, CT, Ultrasound), image processing. | Critical for pharmacokinetic/pharmacodynamic (PK/PD) studies via molecular imaging. |
| Systems & Synthetic Biology | Core focus. Computational modeling of networks, design of biological systems. | Applied to disease network modeling (e.g., cancer signaling networks). | For target discovery, understanding pathway dynamics, and predicting drug effects. |
| Biomaterials & Drug Delivery | Emphasis on smart biomaterials, responsive polymers for delivery. | Emphasis on biocompatibility, implantable drug reservoirs, tissue scaffolds. | Directly relevant to formulation, controlled release, and localized therapeutic delivery. |
| Neuroengineering | Focus on neural interfaces at molecular/cellular level, neuroprosthetic design. | Focus on brain-machine interfaces, neural signal processing, rehabilitation devices. | For CNS drug delivery, closed-loop neuromodulation systems combined with pharmacology. |
Experimental Protocols: Methodologies in Focus
To illustrate the distinct engineering approaches, we detail two key experimental protocols central to each field's research.
Protocol 4.1: Bioengineering – Fed-Batch Bioreactor Cultivation for Recombinant Protein Production
Objective: To maximize yield of a therapeutic protein from engineered E. coli or CHO cells. Detailed Methodology:
- Strain/Line Preparation: Transform host cells with plasmid containing gene of interest and antibiotic resistance. Select single colonies.
- Seed Train: Inoculate 50 mL of defined medium with antibiotic in a 250 mL baffled flask. Incubate (37°C, 220 rpm for E. coli; 37°C, 5% CO2, 120 rpm for CHO) to mid-exponential phase.
- Bioreactor Inoculation: Transfer seed culture to a sterilized bioreactor (e.g., 5L working volume) containing initial batch medium. Set control parameters (pH 7.0, dissolved oxygen >30% saturation via cascade agitation/sparging, temperature).
- Fed-Batch Phase: Upon depletion of initial carbon source (e.g., glucose), initiate feed addition of concentrated nutrient feed (e.g., glucose or glycerol solution for E. coli; proprietary feed for CHO) at a predetermined exponential or constant rate to maintain growth while avoiding overflow metabolism.
- Induction: For inducible systems (e.g., T7/lac), add inducer (IPTG or temperature shift) at target cell density. Reduce temperature if applicable to enhance protein folding.
- Monitoring: Take periodic samples for optical density (OD600), substrate/metabolite analysis (HPLC), and product titer (ELISA).
- Harvest: At decline in viability (<70% for mammalian), terminate culture. Centrifuge (4,000 x g, 20 min) and retain cell pellet (for intracellular) or supernatant (for secreted).
Protocol 4.2: Biomedical Engineering – In Vitro Hemocompatibility Testing per ISO 10993-4
Objective: To evaluate the blood compatibility of a novel polymeric drug-eluting stent coating. Detailed Methodology:
- Sample Preparation: Prepare sterile, flat test articles (1 cm²) of the coating material. Include negative control (medical-grade silicone) and positive control (latex).
- Blood Collection: Draw fresh human whole blood (from healthy, consenting donor, non-medicated) into sodium citrate tubes (3.2%).
- Static Incubation: In a 24-well plate, add 500 µL of whole blood to each test article. Incubate at 37°C for 60 minutes on an orbital shaker (60 rpm).
- Hemolysis Assay: Post-incubation, pipette blood, centrifuge (750 x g, 15 min). Measure absorbance of supernatant at 540 nm. Calculate % hemolysis relative to a water (100% lysis) and saline (0% lysis) control.
- Platelet Activation (Flow Cytometry): Incubate fresh whole blood with test articles as above. After incubation, stain aliquots with fluorescent antibodies (CD41a for platelets, CD62P for activated platelets). Fix, then analyze by flow cytometry. Report % platelets expressing CD62P.
- Thrombogenicity (Scanning Electron Microscopy - SEM): Fix blood-contacted samples in glutaraldehyde (2.5%), dehydrate in ethanol series, critical point dry, and sputter-coat with gold. Image via SEM to quantify platelet adhesion and morphology.
- Coagulation Times: Collect plasma from incubated blood via centrifugation. Perform activated Partial Thromboplastin Time (aPTT) and Prothrombin Time (PT) assays using standard clinical coagulometer.
Visualization of Key Concepts
The Scientist's Toolkit: Research Reagent Solutions
Table 3: Essential Reagents for Featured Experiments
| Item | Function | Example Application (Protocol) |
|---|---|---|
| CHO-K1 or HEK293 Cell Lines | Mammalian protein expression hosts; provide proper folding and post-translational modifications. | Recombinant therapeutic protein production (Protocol 4.1). |
| IPTG (Isopropyl β-D-1-thiogalactopyranoside) | Inducer of lac/T7-based bacterial expression systems. | Triggers recombinant protein expression in E. coli (Protocol 4.1). |
| CD62P (P-Selectin) Antibody | Fluorescently conjugated antibody to detect surface expression of P-selectin on activated platelets. | Flow cytometry analysis of platelet activation (Protocol 4.2). |
| Activated Partial Thromboplastin Time (aPTT) Reagent | Phospholipid and activator mixture to measure intrinsic and common coagulation pathway function. | Assessing plasma coagulation time post-material contact (Protocol 4.2). |
| Glutaraldehyde (2.5% Solution) | Crosslinking fixative that preserves protein structure and cellular morphology. | Fixing blood-contacted materials for SEM imaging (Protocol 4.2). |
| Fluorescent Viability Dye (e.g., Propidium Iodide) | Membrane-impermeant dye that stains nucleic acids of dead cells. | Assessing cell viability in bioreactor samples via flow cytometry. |
| Recombinant Human Growth Factors (e.g., VEGF, EGF) | Defined, pure proteins to stimulate specific signaling pathways in cell culture. | Positive control for RTK pathway activation studies. |
| Phospho-Specific Antibodies (e.g., anti-pERK) | Antibodies that detect only the phosphorylated (active) form of a signaling protein. | Western blot analysis of MAPK pathway activation in drug response assays. |
Within the academic discourse distinguishing Bioengineering (BioE) from Biomedical Engineering (BME), the industry career paths provide the most concrete delineation. This whitepaper, framed within a broader thesis on definition and scope, posits that Bioengineering, rooted in chemical and molecular engineering principles, primarily fuels the Biotech/Pharma industry focused on therapeutic discovery and production. Conversely, Biomedical Engineering, applying electrical, mechanical, and materials science principles to medical problems, is the core discipline driving the MedTech industry, which creates diagnostic and therapeutic devices. This guide provides a technical comparison of core roles, experimental paradigms, and toolkits in these sectors.
Core Industry Functions & Quantitative Comparison
Table 1: Core Industry Focus & Output
| Aspect | Biotech/Pharma (Bioengineering) | MedTech (Biomedical Engineering) |
|---|---|---|
| Primary Objective | Develop molecular/biological entities (drugs, therapies) | Develop physical devices and integrated systems |
| Key Outputs | Small molecule drugs, biologics (mAbs, vaccines), gene/cell therapies | Implants (stents, joints), imaging systems (MRI, ultrasound), surgical robots, point-of-care diagnostics |
| Regulatory Pathway | FDA: Biologics License Application (BLA) / New Drug Application (NDA) | FDA: 510(k), Pre-Market Approval (PMA), De Novo |
| Development Timeline | 10-15 years (preclinical to approval) | 3-7 years (concept to market) |
| Mean R&D Cost per Product | ~$2.6 billion (incl. failures) | ~$100-500 million (varies by device class) |
| Key Success Metrics | Efficacy (Overall Response Rate, Survival), Safety (Adverse Events), Pharmacokinetics | Safety, Reliability, Performance (Sensitivity/Specificity), Clinical Utility, Usability |
Table 2: Typical Role & Skillset Comparison
| Role Type | Biotech/Pharma (BioE) | MedTech (BME) |
|---|---|---|
| Core R&D Role | Process Development Scientist, Upstream/Downstream Engineer | R&D Engineer, Systems Engineer, Design Engineer |
| Key Technical Skills | Cell culture, bioreactor operation, chromatography, assay development, CRISPR, qPCR | CAD (SolidWorks), Finite Element Analysis, Signal Processing, Circuit Design, Biomaterials testing |
| Primary Work Environment | Laboratory (BL-2, Pilot Plant), Cleanroom (for production) | Engineering Lab, Machine Shop, Clinical Setting (for testing) |
| Model System Focus | Cell lines (CHO, HEK293), animal disease models, 3D organoids | Bench-top prototypes, anatomical phantoms, animal models (for biocompatibility) |
Experimental Protocols: Representative Case Studies
Biotech/Pharma: Monoclonal Antibody (mAb) Production and Characterization
Objective: Produce and purify a candidate therapeutic mAb from a recombinant CHO cell line and characterize its binding affinity. Protocol:
- Upstream Process:
- Seed CHO-S cells expressing the mAb gene in a chemically defined medium in a shake flask.
- Scale-up to a 5L bioreactor. Control parameters: pH 7.0±0.1, DO 30%, 36.5°C.
- Operate in fed-batch mode for 12-14 days, monitoring viable cell density (VCD) and viability via trypan blue exclusion.
- Harvest culture broth by centrifugation (4000 x g, 20 min) and 0.22 µm filtration.
- Downstream Purification:
- Load clarified harvest onto a Protein A affinity chromatography column equilibrated with PBS.
- Wash with PBS, then elute mAb with 0.1M glycine buffer (pH 3.0). Immediately neutralize eluate with 1M Tris (pH 8.0).
- Perform buffer exchange into formulation buffer via tangential flow filtration.
- Determine final concentration by UV absorbance at 280 nm.
- Binding Affinity Assay (Bio-Layer Interferometry - BLI):
- Hydrate Anti-Human Fc (AHQ) biosensors.
- Load purified mAb (10 µg/mL) for 300 sec.
- Dip into baseline buffer for 60 sec to establish baseline.
- Associate biosensor with serial dilutions of target antigen (e.g., 100 nM to 0.78 nM) for 300 sec.
- Dissociate in buffer for 300 sec.
- Analyze data using a 1:1 binding model to calculate association (kon) and dissociation (koff) rate constants and the equilibrium dissociation constant (KD = koff/kon).
MedTech: Development of a Polymeric Coronary Stent
Objective: Fabricate and perform in vitro fatigue testing of a bioresorbable polymeric coronary stent. Protocol:
- Stent Fabrication (Laser Ablation):
- Secure a tube of Poly(L-lactide) (PLLA) (Ø 1.6 mm, wall thickness 150 µm) onto a mandrel.
- Program a femtosecond laser system with the stent pattern (strut width ~150 µm).
- Ablate the polymer under an inert gas shield (argon) to prevent thermal degradation. Optimize laser power (e.g., 5 W), pulse frequency (100 kHz), and scan speed.
- Remove the stent, clean ultrasonically in isopropanol, and inspect under a scanning electron microscope (SEM) for edge quality and debris.
- Radial Strength Testing:
- Mount the stent on a balloon catheter and inflate to nominal pressure (e.g., 8 atm) in a 37°C water bath to simulate deployment.
- Use a radial force tester (e.g., flat-plate compression) to measure the force required to compress the deployed stent by 10% of its diameter.
- Record load (N) vs. displacement (mm).
- Accelerated Fatigue Testing (ASTM F2477):
- Deploy stent in a silicone mock artery with compliance matching human coronary arteries.
- Submerge the system in a 37°C phosphate-buffered saline (PBS) bath.
- Connect the mock artery to a pulsatile pump simulating physiological coronary pressure (e.g., 80-120 mmHg at 1 Hz, ~72 bpm).
- Run the test for 400 million cycles (equivalent to 10 years in vivo).
- Post-test, inspect stent for fractures via micro-CT imaging and SEM.
Visualizations of Core Concepts & Workflows
Bioengineering Therapeutic Development Workflow
Biomedical Engineering Device Development Pathway
Example Oncogenic Signaling Pathway Targeted in Biotech
The Scientist's Toolkit: Key Research Reagent Solutions
Table 3: Biotech/Pharma Toolkit (mAb Development Example)
| Item | Function & Explanation |
|---|---|
| CHO (Chinese Hamster Ovary) Cell Line | Industry-standard mammalian host for recombinant protein production due to its ability to perform proper protein folding and human-like post-translational modifications. |
| Protein A Resin | Affinity chromatography medium that specifically binds the Fc region of antibodies, enabling high-purity capture from complex cell culture harvest. |
| Bio-Layer Interferometry (BLI) Biosensors | Label-free optical sensors used for real-time analysis of biomolecular interactions (e.g., antigen-antibody binding kinetics). |
| Growth Media (Chemically Defined) | Serum-free, animal-component-free media with precisely known composition for robust, consistent cell culture and regulatory compliance. |
| Critical Quality Attribute (CQA) Assays | Suite of analytical methods (e.g., SEC-HPLC for aggregates, CE-SDS for purity, ELISA for host cell protein) to ensure product safety and efficacy. |
Table 4: MedTech Toolkit (Stent Development Example)
| Item | Function & Explanation |
|---|---|
| Poly(L-lactide) (PLLA) Tubing | Bioresorbable polymer providing temporary mechanical support; hydrolyzes into lactic acid, metabolized by the body over 12-24 months. |
| Femtosecond Laser | Enables precise, cold ablation machining of polymer stents with minimal thermal damage to the material, preserving its mechanical properties. |
| Silicone Mock Artery | In vitro vessel model with tunable compliance for simulating physiological pressure-strain dynamics during device fatigue testing. |
| Finite Element Analysis (FEA) Software | Computational tool for simulating mechanical stresses (e.g., von Mises stress) on stent designs under load, optimizing geometry prior to prototyping. |
| Micro-CT Scanner | Non-destructive imaging system for high-resolution 3D visualization of device microstructure and detection of fractures post-fatigue testing. |
This technical guide elucidates the distinct industrial embodiments of Bioengineering and Biomedical Engineering. While there is interdisciplinary overlap, the core technical workflows, regulatory landscapes, and material toolkits diverge significantly. Bioengineering in Biotech/Pharma is fundamentally a molecular-scale process science, whereas Biomedical Engineering in MedTech is a systems-scale design and materials science. This functional distinction provides a critical framework for the ongoing academic thesis on defining these closely related yet fundamentally different fields.
This analysis is situated within the broader thesis delineating bioengineering and biomedical engineering. Bioengineering applies engineering principles broadly to biological systems for purposes that may include agriculture, environmental science, and biotechnology. Biomedical engineering is a subset focused explicitly on human health and medicine, developing diagnostic tools, medical devices, and therapeutic strategies. This distinction is critical when evaluating funding agencies: the National Science Foundation (NSF) often funds fundamental, cross-cutting bioengineering research, while the National Institutes of Health (NIH) prioritizes disease-oriented, translational biomedical engineering projects.
NSF Mission: To promote the progress of science; to advance the national health, prosperity, and welfare; to secure the national defense. Its support for engineering is rooted in fundamental discovery and convergence research that transforms knowledge frontiers.
NIH Mission: To seek fundamental knowledge about the nature and behavior of living systems and to apply that knowledge to enhance health, lengthen life, and reduce illness and disability. Its support is fundamentally health- and disease-focused.
Quantitative Comparison of Funding Structures & Priorities
Data sourced from FY 2025 President's Budget Requests and recent agency reports.
| Metric | National Science Foundation (NSF) | National Institutes of Health (NIH) |
|---|---|---|
| FY 2025 Budget Request (Total) | $10.2 billion | $48.2 billion |
| Approx. Budget for Bio/BME-Relevant Research | ~$1.5 billion (ENG, BIO, CISE Dir.) | ~$7.5 billion (NIBIB, NHLBI, NCI, etc.) |
| Primary Legislative Authority | NSF Act of 1950 (as amended) | Public Health Service Act |
| Typical Project Duration | 3-5 years | 4-5 years |
| Success Rate (Avg.) | ~20-25% (varies by directorate) | ~15-20% (varies by institute) |
| Overhead (Indirect Cost) Rate | Negotiated with institution; often lower | Federally negotiated; can be higher |
Table 2: Grant Mechanism Comparison
| Grant Type | NSF Equivalent | NIH Equivalent | Key Characteristics |
|---|---|---|---|
| Early Career | CAREER | DP2, K99/R00 | NSF: Strong integration of education. NIH: Explicitly for health research. |
| Standard Project | Standard Grant | R01 | NSF: Focus on intellectual merit & broader impacts. NIH: Significance, innovation, approach, investigator, environment. |
| High-Risk / Exploratory | EAGER, RAISE | R21 | NSF: <$300k, 2 years. NIH: $275k direct, 2 years. |
| Multidisciplinary | Convergence Accelerator, ERC | U01, P01, TR01 | NSF: Large-scale, societal challenges. NIH: Collaborative, disease-focused programs. |
| Equipment/Technology | MRI, EFRI | S10, R03 | NSF: Shared instrumentation, novel tech. NIH: Specific shared instruments for health research. |
| Training | NRT, GRFP | T32 | NSF: Broad interdisciplinary training. NIH: Predoctoral/postdoctoral training in defined health areas. |
Table 3: Priority Areas & Review Criteria
| Aspect | NSF | NIH |
|---|---|---|
| Core Review Criteria | 1. Intellectual Merit.2. Broader Impacts. | 1. Significance.2. Investigator(s).3. Innovation.4. Approach.5. Environment. |
| Typical Panel Composition | Academics from engineering, physical, life sciences. | Academics & clinicians; specific disease/ organ experts. |
| "Impact" Definition | Advances knowledge; benefits society broadly (education, outreach, diversity). | Improves public health; contributes to scientific knowledge. |
| Emphasis on Preliminary Data | Varies; less critical for exploratory grants. | Often critical, especially for R01s. |
| Translational Path | Pathway to commercialization or societal benefit is valued. | Clear path to understanding disease mechanism, therapy, or diagnostic is required. |
Experimental Methodologies in Funded Research
To illustrate the practical output of funded projects, here are representative protocols from bioengineering (NSF-style) and biomedical engineering (NIH-style) research.
Protocol 1: NSF-Style – Development of a Novel Biomaterial for 3D Bioprinting (Fundamental Bioengineering)
- Aim: To synthesize and characterize a new light-activated, cell-laden hydrogel bioink.
- Materials: Methacrylated hyaluronic acid (Me-HA), lithium phenyl-2,4,6-trimethylbenzoylphosphinate (LAP) photoinitiator, human mesenchymal stem cells (hMSCs), DMEM culture medium, 405nm LED crosslinking system.
- Method:
- Synthesize Me-HA via reaction of HA with methacrylic anhydride under basic conditions (pH 8-9, 4°C, 24h). Purify via dialysis and lyophilize.
- Prepare bioink: Dissolve Me-HA at 3% (w/v) and LAP at 0.1% (w/v) in sterile PBS. Mix with hMSCs at a density of 5x10^6 cells/mL.
- Printability Assessment: Use a pneumatic extrusion bioprinter. Measure filament fusion, shape fidelity, and resolution using time-lapse imaging. Quantify using established metrics (e.g., Filament Fusion Score).
- Rheological Characterization: Perform oscillatory shear measurements (0.1-100 Hz) pre- and post-405nm exposure (10 mW/cm^2, 60 sec) to determine storage (G') and loss (G'') moduli.
- Cell Viability Assay: Assess printed constructs at days 1, 3, and 7 using Live/Dead staining (Calcein-AM/EthD-1) and confocal microscopy. Quantify viability via image analysis (e.g., Fiji/ImageJ).
Protocol 2: NIH-Style – Evaluating a Targeted Nanoparticle for Ovarian Cancer Therapy (Translational Biomedical Engineering)
- Aim: To test the efficacy of a folate receptor-targeted PLGA nanoparticle loaded with paclitaxel in a murine xenograft model of ovarian cancer.
- Materials: PLGA-PEG-Folate copolymer, paclitaxel, fluorescent dye (DiR), OVCAR-3 cells, female nude mice, IVIS imaging system, tissue homogenizer.
- Method:
- Nanoparticle Fabrication & Characterization: Synthesize nanoparticles via nano-precipitation. Characterize size (DLS), zeta potential (ELS), drug loading (HPLC), and folate receptor binding (competitive assay with free folate).
- In Vivo Tumor Model: Subcutaneously inject OVCAR-3 cells (5x10^6) into the flank of nude mice. Allow tumors to reach ~100 mm^3.
- Treatment Regimen: Randomize mice (n=10/group) into: (A) Saline control, (B) Free paclitaxel, (C) Non-targeted NP, (D) Folate-targeted NP. Administer via tail vein injection at 5 mg paclitaxel/kg, twice weekly for 3 weeks.
- Pharmacokinetics/ Biodistribution: In a parallel cohort, inject DiR-labeled nanoparticles. Image at 2, 6, 24, and 48h post-injection using IVIS. Euthanize mice, harvest organs, and quantify fluorescence ex vivo.
- Efficacy & Histology: Measure tumor dimensions 3x/week. Calculate tumor volume. At endpoint, harvest tumors, weigh, and process for H&E and TUNEL staining to assess necrosis and apoptosis.
Visualizing Key Concepts
Title: Decision Flow for NSF vs NIH Funding Applications
Title: Representative NSF vs NIH Experimental Workflows
The Scientist's Toolkit: Essential Research Reagent Solutions
Table 4: Key Reagents & Materials for Featured Experiments
| Reagent/Material | Function | Example Application (from Protocols) |
|---|---|---|
| Methacrylated Hyaluronic Acid (Me-HA) | Photocrosslinkable polymer backbone for hydrogel formation. Provides biocompatibility and tunable mechanical properties. | NSF Protocol: Base material for novel bioink. |
| Lithium Phenyl-2,4,6-Trimethylbenzoylphosphinate (LAP) | Water-soluble, cytocompatible photoinitiator. Generates radicals under 405nm light to initiate crosslinking. | NSF Protocol: Crosslinking the Me-HA bioink. |
| PLGA-PEG-Folate Copolymer | Amphiphilic block copolymer. PLGA: biodegradable core for drug payload. PEG: enhances circulation. Folate: targeting ligand. | NIH Protocol: Constituent material of targeted therapeutic nanoparticle. |
| Calcein-AM / Ethidium Homodimer-1 (EthD-1) | Live/Dead viability assay kit. Calcein-AM (green) labels live cells. EthD-1 (red) labels dead cells with compromised membranes. | NSF Protocol: Assessing cell viability post-3D bioprinting. |
| DiR Near-Infrared Dye | Lipophilic, fluorescent carbocyanine dye for in vivo imaging. Excites/emits in NIR range for deep tissue penetration. | NIH Protocol: Labeling nanoparticles for biodistribution tracking via IVIS. |
| OVCAR-3 Cell Line | Human epithelial ovarian adenocarcinoma cell line. Expresses folate receptor alpha. | NIH Protocol: Establishing xenograft tumor model for targeted therapy testing. |
The debate surrounding the definition and scope of Bioengineering versus Biomedical Engineering is central to modern life sciences research. For the purpose of this whitepaper, we adopt the emerging consensus: Biomedical Engineering is primarily application-focused, emphasizing the design and development of devices, implants, and diagnostic tools for direct human healthcare. Bioengineering is broader, applying engineering principles to any biological system, including plants, microorganisms, and ecosystems, with applications in pharmaceuticals, agriculture, and biomaterials. This distinction is critical when quantifying impact, as the pathways from research to commercialization—through publications, patents, and clinical adoption—diverge significantly between the two fields.
Publication Metrics: Measuring Academic Influence
Academic publications remain the primary currency of research validation. Impact is quantified through a multi-faceted suite of metrics.
Table 1: Core Publication Metrics & Typical Benchmarks (2023-2024 Data)
| Metric | Definition | Typical Bioengineering Range | Typical Biomedical Engineering Range | Primary Data Source |
|---|---|---|---|---|
| Journal Impact Factor (JIF) | Average citations per article in preceding 2 years. | 8 - 15 (Top Tier) | 10 - 25 (Top Tier) | Journal Citation Reports |
| CiteScore | Citations received in a year to documents published in prior 3 years, divided by documents. | 9 - 18 | 12 - 30 | Scopus |
| Article Influence Score | Average influence of a journal's articles over first 5 years post-publication. | 1.5 - 3.0 | 2.0 - 4.5 | Eigenfactor |
| h-index (Author) | Number of papers (h) cited at least h times. | 40-60 (Senior PI) | 45-70 (Senior PI) | Google Scholar, Scopus |
| Field-Weighted Citation Impact (FWCI) | Ratio of citations received vs. expected for the field. >1.0 = above average. | 1.2 - 2.5 | 1.3 - 3.0 | Scopus |
Experimental Protocol: Calculating Field-Weighted Citation Impact (FWCI)
- Data Collection: Using the Scopus API, retrieve all citations for a target article set (e.g., an author's portfolio, a lab's output).
- Normalization Baseline: Scopus establishes an expected citation rate based on publication year, document type (article, review), and subject area (e.g., "Biomaterials" vs. "Radiology").
- Calculation: For each document:
FWCI_d = Actual Citations / Expected Citations. The aggregate FWCI is the total citations divided by the sum of expected citations for all documents. - Statistical Validation: Apply a bootstrap resampling method (1,000 iterations) to calculate a 95% confidence interval for the aggregate FWCI, ensuring robustness against outlier papers.
Patent Landscapes: Tracking Commercial Potential
Patent analysis reveals the translation of research into protected, commercializable inventions. The landscape differs between bioengineering (often focused on processes, molecules, and platform technologies) and biomedical engineering (focused on devices, systems, and direct therapeutic methods).
Table 2: Key Patent Indicators & Comparative Analysis
| Indicator | Definition | Bioengineering Emphasis | Biomedical Engineering Emphasis |
|---|---|---|---|
| Patent Family Size | Number of related patent filings across global jurisdictions. Indicates investment breadth. | Moderate to Large (broad platform protection) | Large (critical for device iterations & global markets) |
| Forward Citations | Number of later patents citing the target patent. A proxy for technological influence. | High for foundational platform tech (e.g., CRISPR, lipid nanoparticles). | High for pioneering device architectures or measurement principles. |
| International Patent Classification (IPC) Codes | Standardized codes for technology areas. | C12N (Microbiology, Enzymology), A61K (Preparations for medical purposes) | A61B (Diagnostics; Surgery), A61F (Filters, Implants) |
| Grant Lag (Filing to Grant) | Time from first filing to issuance. | 3.5 - 5 years | 2.5 - 4 years (often expedited for devices) |
| Claim Breadth | Scope of the legal protection, often indicated by independent claim word count. | Broader claims for novel compositions/methods. | More specific claims targeting clinical application parameters. |
Experimental Protocol: Conducting a Patent Landscape Analysis
- Database Query: Use Lens.org or PatSnap with a structured query:
((bioengineering OR "tissue engineering") AND (stem cell)) OR ((biomedical engineering) AND (neural implant)). Filter by priority date (e.g., 2018-2023). - Data Extraction: Download metadata for resulting patents: assignee(s), IPC codes, citation network, family members, and legal status.
- Network Analysis: Use Gephi or VOSviewer to create co-citation networks or assignee collaboration maps. Calculate network centrality metrics to identify key "hub" patents or dominant institutions.
- Thematic Mapping: Perform text mining on titles/abstracts using TF-IDF (Term Frequency-Inverse Document Frequency) to identify emerging technical concepts. Cluster patents based on semantic similarity.
Diagram Title: Patent Landscape Analysis Workflow
Clinical Adoption: The Ultimate Translational Metric
Clinical adoption measures real-world healthcare integration. For Biomedical Engineering, this follows regulatory (FDA/CE) pathways for devices. For Bioengineering, it often involves the drug/biological approval pipeline or industrial bioprocess implementation.
Table 3: Pathways and Metrics for Clinical Adoption
| Pathway Stage | Key Metric | Biomedical Engineering (Device Example) | Bioengineering (Therapeutic Example) |
|---|---|---|---|
| Pre-Clinical | Animal Model Efficacy | Functional restoration >70% (e.g., limb mobility) | Tumor burden reduction >50% in xenograft model |
| Regulatory | IDE/PMA Approval (FDA) or IND Approval | Time from Pre-Submission to IDE Grant: ~90 days | Phase I trial initiation rate post-IND: ~65% |
| Clinical Trials | Trial Volume & Phase Transition | N = 50-300 (Pivotal Trial) | N = 20-100 (Phase I), 100-500 (Phase II) |
| Market Integration | Hospital Adoption Rate | % of Top 100 US Hospitals adopting technology (Year 1-3) | Prescription volume post-launch, Market Share % |
| Health Outcomes | Real-World Evidence (RWE) | 30-day readmission rate reduction | Overall Survival (OS) improvement vs. standard of care |
Experimental Protocol: Tracking Hospital Adoption of a New Medical Device
- Data Source Identification: Utilize Centers for Medicare & Medicaid Services (CMS) Hospital Compare datasets, proprietary hospital purchasing databases (e.g., Definitive Healthcare), and physician society surveys.
- Code Mapping: Map the target device to relevant Healthcare Common Procedure Coding System (HCPCS) codes or ICD-10-PCS procedure codes.
- Adoption Calculation: For a target hospital cohort (e.g., academic medical centers), calculate quarterly adoption rate:
(Number of hospitals performing procedure with device) / (Total hospitals in cohort). - Correlation Analysis: Perform a multivariate regression analysis to identify adoption drivers: hospital bed size, specialist count, previous technology generation adoption rate, and regional reimbursement policies.
Diagram Title: Clinical Adoption Pathways: Bioengineering vs Biomedical Engineering
The Scientist's Toolkit: Research Reagent Solutions
Table 4: Essential Toolkit for a Featured Experiment: CRISPR-Cas9 Mediated Gene Editing in a Bioengineering Context
| Research Reagent / Material | Function | Example Vendor(s) |
|---|---|---|
| SpCas9 Nuclease (Alt-R S.p. HiFi) | High-fidelity version of the CRISPR-associated protein 9, engineered for reduced off-target editing. | Integrated DNA Technologies (IDT) |
| chemically modified sgRNA (Alt-R crRNA & tracrRNA) | Synthetic single-guide RNA components with chemical modifications to enhance stability and reduce immune response in cells. | IDT, Synthego |
| HDR Donor Template (ssODN) | Single-stranded oligodeoxynucleotide template for precise homology-directed repair (HDR) to insert a specific sequence. | IDT, Genewiz |
| Electroporation Enhancer (Alt-R Cas9 Electroporation Enhancer) | A small molecule added to electroporation reactions to improve delivery efficiency of RNP complexes. | IDT |
| Flow Cytometry Antibody Panel | Antibodies for detecting cell surface markers (e.g., CD34, CD45) to isolate and characterize edited cell populations. | BioLegend, BD Biosciences |
| Next-Generation Sequencing (NGS) Library Prep Kit | For preparing amplicon libraries from the target genomic locus to analyze editing efficiency and specificity via deep sequencing. | Illumina, Twist Bioscience |
| Cell Culture Media (StemSpan) | Serum-free medium optimized for the expansion and maintenance of primary stem cells during and after editing. | STEMCELL Technologies |
| Genomic DNA Extraction Kit (QuickExtract) | Rapid solution for lysing cells and extracting PCR-ready genomic DNA for initial screening of edits. | Lucigen |
Within the broader discourse defining bioengineering versus biomedical engineering, this paper positions AI-driven personalized medicine as a convergent discipline. Traditional biomedical engineering often focuses on applied device and diagnostic development, while bioengineering incorporates fundamental principles from molecular to systems levels. The integration of AI across the drug discovery and development pipeline represents a synthesis of both: applying computational tools (biomedical) to modulate biological systems (bioengineering) for patient-specific outcomes.
Current Landscape: Data and Quantitative Benchmarks
Recent advancements demonstrate the accelerating impact of AI. The following table summarizes key performance metrics from published studies and industry benchmarks (2023-2024).
Table 1: Performance Benchmarks of AI in Drug Discovery & Personalized Medicine
| Metric Area | Traditional Approach Benchmark (Avg.) | AI-Driven Approach Benchmark (Avg.) | Data Source / Key Study |
|---|---|---|---|
| Target Identification Timeline | 24-36 months | 6-12 months | Nature Reviews Drug Discovery, 2024 Analysis |
| Preclinical Compound Screening | 10,000-100,000 compounds screened | Virtual screening of >10^8 molecules | Insilico Medicine (Phase I trial for INS018_055) |
| Clinical Trial Success Rate | ~10% from Phase I to approval | AI-guided trials show ~15-20% (early data) | Biopharma Dive & McKinsey, 2023 Report |
| Personalized Therapy Matching Accuracy (Oncology) | 60-70% (biomarker-based) | 85-92% (Multi-omics + AI integration) | Cell (2023): "The Cancer Imaging Archive (TCIA) analysis" |
| Cost Reduction in Discovery Phase | $400M - $600M (preclinical) | Potential 30-40% reduction estimated | BCG & Wellcome Trust, 2024 Industry Survey |
Core Methodologies and Experimental Protocols
Protocol: Multi-Omic Data Integration for Target Discovery
This protocol details the generation of training data for AI models predicting novel therapeutic targets.
Objective: Identify novel, druggable targets for a complex disease (e.g., Alzheimer's) by integrating heterogeneous patient data. Materials: Patient-derived iPSCs, RNA-seq kits, mass spectrometry systems, ATAC-seq kits, SNV/CNV arrays, high-performance computing cluster. Procedure:
- Cohort Stratification: Recruit patient cohort (n>500) with deep phenotyping. Isolate primary cells and reprogram to induced pluripotent stem cells (iPSCs).
- Multi-Omic Data Generation:
- Genomics: Perform whole-genome sequencing on germline DNA. Call single nucleotide variants (SNVs) and copy number variations (CNVs).
- Transcriptomics: Differentiate iPSCs to disease-relevant cell types (e.g., neurons). Perform bulk and single-cell RNA-seq.
- Proteomics & Metabolomics: Analyze cell lysates and supernatants using LC-MS/MS for protein and metabolite abundance.
- Epigenomics: Perform ATAC-seq on nuclei to assess chromatin accessibility.
- Data Curation & Labeling: Annotate all data with clinical outcomes. Use known disease-associated genes (from public databases like DisGeNET) as positive-control labels for model training.
- AI Model Training & Validation:
- Implement a multimodal deep learning architecture (e.g., transformer-based) with separate encoders for each omic data type.
- Train the model to classify genes as "potential target" or "non-target" using the curated labels.
- Validate predictions using in vitro CRISPR knockout screens in the iPSC-derived models, measuring phenotype rescue.
Protocol: AI-Driven Design of Patient-Specific Combination Therapies
Objective: Design an optimal drug combination for an individual cancer patient using ex vivo testing and AI simulation. Materials: Patient tumor biopsy, murine PDX models or organoid culture systems, high-throughput drug library, automated imaging system, Bayesian optimization software. Procedure:
- Ex Vivo System Establishment: Implant tumor fragments into immunodeficient mice (PDX model) and/or establish 3D organoid cultures.
- High-Throughput Phenotypic Screening: Treat organoids with a library of ~120 clinically approved oncology drugs, singly and in pre-defined pairs. Measure cell viability and apoptosis via high-content imaging at 72h.
- Initial Data for AI Training: Use screening results to train a graph neural network that models drug-drug and drug-genomic interaction networks.
- AI-Guided Optimization Loop:
- The AI model proposes 5-10 novel drug combinations and doses based on the patient's genomic profile and initial screen.
- These proposed combinations are tested ex vivo on the patient's organoids.
- Results are fed back to the AI model for Bayesian optimization.
- Loop continues for 3-4 iterations until an optimal combination is identified (maximal efficacy, minimal toxicity predicted).
- Validation: The top AI-proposed combination is administered to the PDX mouse model harboring the patient's tumor for in vivo validation of efficacy and toxicity.
Visualization: Key Pathways and Workflows
Title: AI-Personalized Medicine Pipeline
Title: AI-Targeted Signaling Intervention
The Scientist's Toolkit: Research Reagent Solutions
Table 2: Essential Research Reagents for AI-Driven Discovery Experiments
| Reagent / Material Category | Specific Example(s) | Function in AI-Driven Workflow |
|---|---|---|
| Patient-Derived Model Systems | iPSC Reprogramming Kits; Organoid Culture Matrices | Provide biologically relevant, patient-specific in vitro systems for generating training data and validating AI predictions. |
| Multi-Omic Assay Kits | scRNA-seq Library Prep; Phospho-Proteomic Kits | Generate high-dimensional, quantitative data layers (transcriptome, proteome) essential for training multimodal AI models. |
| High-Content Screening Reagents | Live-Cell Fluorescent Dyes (Apoptosis, Cytotoxicity) | Enable automated, phenotypic readouts from drug screens on patient models, creating labeled datasets for AI. |
| Gene Editing Tools | CRISPR-Cas9 Ribonucleoprotein (RNP) Complexes | Functionally validate AI-predicted targets via knockout/activation in model systems (ground truth experiments). |
| Bioinformatics & AI Software | Cloud-Based ML Platforms (e.g., TensorFlow, PyTorch); Pharmacovigilance Databases | Provide the computational environment for building, training, and deploying models; and access to historical data for training. |
Conclusion
Bioengineering and biomedical engineering, while rooted in a shared foundation of applying engineering principles to biological systems, diverge significantly in scope, methodology, and end goals. Bioengineering operates with a broader, more fundamental lens, often focused on manipulating biological systems for diverse applications. Biomedical engineering maintains a tighter, clinically-oriented focus on diagnosing, monitoring, and treating human disease. For researchers and drug development professionals, understanding this distinction is crucial for strategic project design, effective collaboration, and navigating the correct regulatory and commercialization pathways. The future lies in their intentional convergence, leveraging bioengineering's power to create novel therapies and biomedical engineering's expertise in translation to accelerate the delivery of precision medicine and advanced clinical solutions.