Propidium Iodide Staining Protocol: A Complete Guide to Assessing Cell Viability via Fluorescence Microscopy
This comprehensive guide details the FDA Propidium Iodide (PI) staining protocol for fluorescence microscopy-based cell viability assessment.
Propidium Iodide Staining Protocol: A Complete Guide to Assessing Cell Viability via Fluorescence Microscopy
Abstract
This comprehensive guide details the FDA Propidium Iodide (PI) staining protocol for fluorescence microscopy-based cell viability assessment. We cover the foundational principles of PI as a membrane-impermeant nucleic acid stain, providing a step-by-step methodological workflow for adherent and suspension cells. The article addresses common troubleshooting scenarios and optimization strategies for accurate quantification, and compares PI staining with alternative viability assays like Annexin V, trypan blue, and MTT. Tailored for researchers and drug development professionals, this resource aims to ensure reliable, reproducible results in cytotoxicity screening, apoptosis studies, and basic cell biology research.
Understanding Propidium Iodide Staining: The Science Behind Cell Viability Detection
What is Propidium Iodide? Chemical Properties and Mechanism of Action.
Thesis Context: This document provides detailed application notes and protocols for Propidium Iodide (PI) use, framed within a broader thesis on standardized FDA-relevant fluorescence microscopy protocols for cell viability research in drug development.
Chemical Properties
Propidium Iodide (PI) is a phenanthridinium dye with the chemical formula C₂₇H₃₄I₂N₄. It is a fluorescent, membrane-impermeant molecule that binds to nucleic acids by intercalating between base pairs. Its key chemical properties are summarized below.
| Property | Value / Description |
|---|---|
| Chemical Formula | C₂₇H₃₄I₂N₄ |
| Molecular Weight | 668.39 g/mol |
| Excitation Maximum | 493 nm (blue-green) |
| Emission Maximum | 636 nm (red) |
| Solubility | Soluble in aqueous buffers (commonly used at 1 mg/mL in PBS or water) |
| Binding Specificity | Double-stranded DNA and RNA (intercalation) |
| Membrane Permeability | Impermeant to intact plasma membranes |
| Stability | Light-sensitive; requires storage in dark at 2-8°C. |
Mechanism of Action
PI is excluded from viable cells with intact plasma membranes. Upon loss of membrane integrity, which occurs in late-stage apoptosis or necrosis, PI rapidly enters the cell, intercalates into nucleic acids, and exhibits a 20- to 30-fold enhancement of fluorescence. Its fluorescence is detectable in the red spectrum, allowing easy multiplexing with other fluorophores like fluorescein (FITC) or GFP.
Diagram Title: PI Mechanism: Entry and Fluorescence in Dead Cells
Application Notes & Protocols
Protocol 1: Basic PI Staining for Cell Viability (Microscopy)
This protocol is optimized for rapid assessment of viability in adherent or suspension cultures, compatible with initial steps in FDA-relevant cytotoxicity screening.
Research Reagent Solutions Toolkit:
| Reagent/Material | Function in Protocol |
|---|---|
| Propidium Iodide Stock (1 mg/mL) | Fluorescent nucleic acid stain for dead cells. |
| Phosphate-Buffered Saline (PBS) | Isotonic washing and dilution buffer. |
| Fluorescence Microscope | Equipped with TRITC/Red Cy filter set (Ex/Em ~535/617 nm). |
| Cell Culture Vessels | Chamber slides, plates, or dishes for adherent cells. |
| Centrifuge | For pelleting suspension cells. |
| Fixative (e.g., 4% PFA) | Optional; for fixed endpoint assays. |
| Counterstain (e.g., Hoechst 33342) | Optional; for labeling all nuclei. |
Methodology:
- Prepare Staining Solution: Dilute PI stock in PBS to a final working concentration of 1-5 µg/mL. Protect from light.
- Harvest & Wash Cells: For suspension cells, pellet (300 x g, 5 min) and resuspend in PBS. For adherent cells, gently rinse with warm PBS.
- Stain: Incubate cells in PI working solution for 5-15 minutes at 4°C or RT in the dark. For live-cell imaging, maintain cells at 37°C and image quickly.
- Wash (Optional): Gently rinse cells with PBS to reduce background fluorescence (critical for fixed cells).
- Image: Visualize using a fluorescence microscope with red filter set. Viable cells show no nuclear PI signal; dead cells show bright red nuclei.
Diagram Title: PI Staining Workflow for Microscopy
Protocol 2: PI Staining for Flow Cytometry Viability Gating
PI is a standard viability probe in flow cytometry, allowing exclusion of dead cells from analysis. This is a critical pre-FDA submission assay for characterizing cell populations in drug studies.
Methodology:
- Sample Preparation: Harvest cells (adherent or suspension) and wash once in cold Flow Cytometry Staining Buffer (PBS + 1-2% FBS).
- Stain: Resuspend cell pellet (~1x10⁶ cells) in 500 µL of buffer containing PI at 1-2 µg/mL. Vortex gently.
- Incubate: Incubate for 5-10 minutes on ice or at RT in the dark. Do not wash.
- Acquire Data: Analyze by flow cytometry within 1 hour. Use a 488 nm laser for excitation and collect fluorescence with a 585/40 nm or 610/20 nm filter (e.g., PE-Texas Red channel).
- Gating: Plot FSC-A vs. SSC-A to gate on cells, then plot PI-A vs. a live-cell marker (e.g., Annexin V-FITC) or use PI-A histogram. Gate PI-negative population as viable.
Typical results from a drug dose-response viability assay using PI staining.
| Drug Treatment Concentration (µM) | % PI-Positive (Dead) Cells (Mean ± SD) | IC₅₀ Estimate (µM) | Assay Format |
|---|---|---|---|
| 0 (Vehicle Control) | 5.2 ± 1.8 | - | Flow Cytometry |
| 1 | 12.5 ± 3.1 | - | Flow Cytometry |
| 10 | 45.7 ± 5.6 | 12.1 | Flow Cytometry |
| 100 | 92.3 ± 2.4 | - | Flow Cytometry |
| 0 (Control) | 3.1 ± 0.9 | - | Fluorescence Microscopy |
| 10 | 38.4 ± 8.2 | 11.8 | Fluorescence Microscopy |
Notes: SD = Standard Deviation (n=3). IC₅₀ calculated from dose-response curve. PI staining provides a robust, quantifiable dead-cell readout for IC₅₀ determination in pre-clinical studies.
Within the framework of FDA-endorsed cell viability and cytotoxicity research, the propidium iodide (PI) staining protocol is a cornerstone technique. Its fundamental principle relies on the differential integrity of the plasma membrane in live versus dead cells. PI is a membrane-impermeant, fluorescent nuclear dye. In viable cells with intact membranes, PI is excluded. In dead or membrane-compromised cells, PI crosses the membrane, intercalates into DNA/RNA, and exhibits a ~20-30 fold enhancement in red fluorescence. This application note details the protocols, quantitative data, and essential tools for implementing PI staining in fluorescence microscopy-based viability assays, a critical component in drug development safety and efficacy profiling.
Table 1: Key Spectral and Binding Properties of Propidium Iodide
| Property | Specification / Value |
|---|---|
| Excitation Maximum | 535 nm (488-535 nm range) |
| Emission Maximum | 617 nm |
| Binding Mode | Intercalates between base pairs of dsDNA and dsRNA |
| Fluorescence Enhancement | 20- to 30-fold upon nucleic acid binding |
| Typical Working Concentration | 1 - 5 µg/mL |
| Common Microscope Filter Set | TRITC/Rhodamine (Ex: 540/25, Em: 605/55) |
Table 2: Typical Viability Assay Outcomes Using PI Staining
| Cell Status | Membrane Integrity | PI Uptake | Fluorescence (Microscopy) | Interpretation |
|---|---|---|---|---|
| Viable / Live | Intact | Excluded | None (Dark) | FDA-Compliant: Healthy Cell |
| Late Apoptotic / Necrotic | Compromised / Permeabilized | Free influx | Bright Red Nucleus | Non-Viable Cell |
| Early Apoptotic | Intact but altered (phosphatidylserine exposure) | Excluded | None (Dark) * | Viable by PI criteria; requires Annexin V for detection |
| Fixed Cells | Fully Permeabilized | Free influx | Bright Red Nucleus | Positive Control |
Note: Early apoptotic cells are PI-negative until reaching secondary necrosis.
Detailed Experimental Protocols
Protocol 1: Basic PI Staining for Fluorescence Microscopy (Endpoint Assay)
This protocol is for determining the percentage of dead cells in a population at a single time point.
Materials:
- Adherent or suspension cells
- Growth medium
- Propidium iodide stock solution (1 mg/mL in PBS or dH₂O)
- Phosphate-Buffered Saline (PBS), sterile
- Fluorescence microscope with appropriate filter set
- Cell culture plates (e.g., 24-well plate with or without coverslips)
Procedure:
- Culture & Treat Cells: Seed cells in an appropriate multi-well plate and apply the experimental treatment (e.g., drug candidate).
- Prepare PI Working Solution: Dilute PI stock in complete growth medium or PBS to a final concentration of 1-2 µg/mL. Protect from light.
- Stain Cells:
- For adherent cells: Remove culture medium, gently rinse with PBS. Add PI working solution to cover cells (e.g., 300 µL/well for a 24-well plate).
- For suspension cells: Pellet cells (300 x g, 5 min), resuspend in PI working solution.
- Incubate: Incubate at room temperature for 5-15 minutes, protected from light. Do not wash. Washing can remove the dye from lightly stained, dying cells.
- Image Acquisition: Immediately visualize using a fluorescence microscope with green excitation/red emission filters. Use phase-contrast or a nuclear counterstain (like Hoechst 33342, if not used for live/dead) to identify all cells.
- Analysis: Count PI-positive (bright red nuclei) and total cells from multiple fields. Calculate % Viability = [1 - (PI-positive cells / Total cells)] x 100.
Protocol 2: Dual Staining with Hoechst 33342 for Total Cell Count (FDA Research Context)
For robust quantification, co-staining with a cell-permeant nuclear dye is recommended to identify all nuclei.
Modified Procedure:
- Prepare a dual-stain solution containing Hoechst 33342 (1-2 µg/mL) and PI (1-2 µg/mL) in culture medium or PBS.
- Apply the stain to cells as in Protocol 1, step 3.
- Incubate 15-20 min at 37°C, protected from light.
- Image using DAPI (for Hoechst) and TRITC (for PI) filter sets.
- Analysis: Total cells = Hoechst-positive nuclei (blue). Dead cells = PI-positive nuclei (red). Overlap (pink) indicates dead cells.
Visualizations: Pathways & Workflows
Title: PI Exclusion vs. Uptake Based on Membrane Integrity
Title: Endpoint PI Viability Assay Workflow
The Scientist's Toolkit: Research Reagent Solutions
Table 3: Essential Materials for PI-Based Viability Assays
| Item / Reagent | Function & Role in Assay | Key Consideration |
|---|---|---|
| Propidium Iodide (PI) | Membrane-impermeant fluorescent nucleic acid dye; primary viability indicator. | Light-sensitive; aliquot and store at -20°C. Prepare fresh working solution. |
| Hoechst 33342 | Cell-permeant blue-fluorescent DNA dye. Labels all nuclei for total cell count. | Can be toxic with prolonged incubation; titrate concentration and time. |
| Annexin V-FITC | Binds phosphatidylserine (PS) exposed on outer leaflet of early apoptotic cells. | Used in combination with PI for apoptotic staging (Annexin V+/PI-). |
| Cell Culture Medium (Phenol Red-free) | Medium for preparing staining solutions. Phenol Red-free reduces background fluorescence. | |
| Dulbecco's PBS (DPBS) | For rinsing cells and diluting dyes. Calcium/Magnesium-free is standard. | |
| Multi-well Cell Culture Plate (e.g., 96-well black/clear bottom) | Platform for cell culture, treatment, and staining. Black walls reduce cross-talk. | Ideal for high-throughput microscopy or plate reader assays. |
| Automated Cell Counter or Hemocytometer | For determining initial cell seeding density. | Critical for assay reproducibility. |
| Fluorescence Microscope | Equipped with TRITC (for PI) and DAPI (for Hoechst) filter sets. | Camera sensitivity is crucial for detecting low signals. |
Application Notes
The transition from cytotoxicity screening to specific apoptosis detection represents a critical pathway in modern cell biology and drug development research. Fluorescence microscopy coupled with Propidium Iodide (PI) staining serves as a cornerstone technique within the broader thesis investigating FDA/PI co-staining protocols for multiplexed cell viability and death analysis. PI, a membrane-impermeant DNA intercalating agent, is a standard for identifying dead cells with compromised plasma membranes. However, its application extends beyond simple live/dead assays. Early cytotoxicity screenings often utilize PI uptake in high-throughput formats (e.g., microplate readers) to gauge compound toxicity. This initial data then informs more sophisticated endpoint analyses, where researchers employ time-lapse fluorescence microscopy to distinguish apoptotic from necrotic death. Apoptotic cells, in their early stages, exclude PI; but upon secondary necrosis or in late apoptosis, they become PI-positive. Therefore, within the defined thesis context, the temporal and morphological context provided by microscopy is paramount. By quantifying the kinetics of PI uptake in conjunction with morphological markers (cell shrinkage, nuclear condensation), researchers can derive not just viability percentages, but also mechanistic insights into the mode of cell death—a crucial differentiator for evaluating therapeutic agents' mechanisms of action.
Quantitative data from recent studies highlight the utility of this progression:
Table 1: Comparative Output of Cytotoxicity vs. Apoptosis Assays
| Assay Type | Primary Readout | Typical Output Metrics | Key Differentiating Insight |
|---|---|---|---|
| Cytotoxicity Screening (PI-based) | Membrane Integrity | % PI-positive cells, IC50 values | Gross toxicity profile; identifies lethal concentrations. |
| Apoptosis Detection (Microscopy) | Nuclear Morphology & Membrane Integrity | % Apoptotic (PI-negative, condensed nuclei) vs. Necrotic (PI-positive, diffuse nuclei) | Distinguishes mode of cell death; provides kinetic data. |
Table 2: Representative Data from a Drug Treatment Study Using FDA/PI Microscopy
| Drug Treatment | Total Viable Cells (FDA+, PI-) | Early Apoptotic (FDA weak, PI-, condensed) | Late Apoptotic/Necrotic (PI+) | Conclusion |
|---|---|---|---|---|
| Vehicle Control | 95 ± 3% | 2 ± 1% | 3 ± 2% | Normal culture. |
| Staurosporine (1µM, 4h) | 15 ± 5% | 70 ± 8% | 15 ± 4% | Induces predominant apoptosis. |
| Hydrogen Peroxide (1mM, 1h) | 10 ± 4% | 5 ± 2% | 85 ± 6% | Induces predominant necrosis. |
Detailed Protocols
Protocol 1: High-Throughput Cytotoxicity Screening Using PI in a Microplate Format
Objective: To rapidly screen compound libraries for gross cytotoxicity by measuring loss of membrane integrity. Materials: Cell suspension, 96-well clear-bottom black microplates, test compounds, Propidium Iodide stock solution (1 mg/mL in PBS), phosphate-buffered saline (PBS), microplate fluorometer. Methodology:
- Seed cells at an optimal density (e.g., 10,000 cells/well) in 100 µL growth medium. Incubate (37°C, 5% CO2) for 24h.
- Add test compounds in triplicate, using serial dilutions. Include vehicle and positive control (e.g., 1% Triton X-100). Incubate for desired treatment period (e.g., 24-48h).
- At endpoint, add PI directly to each well for a final concentration of 1 µg/mL. Incubate at 37°C for 15-30 minutes protected from light.
- Using a fluorometer, measure fluorescence (Ex/Em ~535/617 nm). Do not wash cells.
- Data Analysis: Normalize fluorescence: % Cytotoxicity = [(Fsample - Fvehicle)/(FTriton - Fvehicle)] * 100. Generate dose-response curves to calculate IC50 values.
Protocol 2: Multiplex Apoptosis Detection via FDA/PI Co-staining for Fluorescence Microscopy
Objective: To qualitatively and quantitatively assess cell viability and discriminate apoptosis from necrosis. Materials: Chambered cell culture slides, Fluorescein Diacetate (FDA) stock solution (5 mg/mL in acetone), PI stock solution (1 mg/mL in PBS), fluorescence microscope with FITC and TRITC/ Texas Red filter sets, PBS. Methodology:
- Culture or seed cells directly in chamber slides. Treat as required.
- Staining Solution Preparation: Prepare a working solution in pre-warmed PBS containing 5 µg/mL FDA and 1 µg/mL PI. Protect from light.
- Aspirate culture medium from chambers. Gently rinse cells once with PBS.
- Add sufficient staining solution to cover the cells. Incubate at 37°C for 15-20 minutes.
- Aspirate stain and replace with fresh PBS for imaging. Image immediately.
- Microscopy & Analysis: Capture images using:
- FITC channel: Viable cells (FDA+, green cytoplasm).
- TRITC/Texas Red channel: Dead cells (PI+, red nuclei). Use software to count cells and classify:
- Viable: FDA bright, PI-negative.
- Early Apoptotic: FDA dim (lower esterase activity), PI-negative, condensed nuclei (morphology).
- Late Apoptotic/Necrotic: PI-positive nuclei, may show condensation or fragmentation.
Diagrams
Title: Workflow from Cytotoxicity Screening to Apoptosis Detection
Title: Cell Death Pathways Differentiated by PI Staining
The Scientist's Toolkit: Research Reagent Solutions
Table 3: Essential Materials for FDA/PI Cell Viability and Apoptosis Assays
| Item | Function / Role in Experiment |
|---|---|
| Propidium Iodide (PI) | Vital DNA stain; impermeant to live cells. Fluoresces red upon binding DNA in membrane-compromised cells. |
| Fluorescein Diacetate (FDA) | Cell-permeant substrate hydrolyzed by intracellular esterases in viable cells to green fluorescent fluorescein. |
| Dulbecco's Phosphate Buffered Saline (PBS) | Isotonic buffer for washing cells and preparing staining solutions without inducing osmotic stress. |
| Dimethyl Sulfoxide (DMSO) | Common solvent for preparing stock solutions of experimental compounds and some dyes. |
| Triton X-100 or Saponin | Detergent used as a positive control to permeabilize all cells (100% PI-positive control). |
| Chambered Cell Culture Slides | Provides a growth surface compatible with high-resolution microscopy, eliminating transfer steps. |
| Fluorescence Microscope | Equipped with appropriate filter sets (FITC for FDA, TRITC for PI) for visualization and quantification. |
| Microplate Fluorometer | Enables high-throughput, quantitative reading of fluorescence in cytotoxicity screening assays. |
| Annexin V Binding Buffer | Required if performing Annexin V/PI co-staining for earlier apoptosis detection. Provides optimal Ca2+ conditions. |
Within FDA-recommended protocols for cell viability research using fluorescence microscopy, precise reagent formulation and optical equipment configuration are critical. Propidium Iodide (PI) staining, as a standard for identifying dead/late apoptotic cells with compromised membranes, relies on the synergistic function of high-quality buffer components, accurately prepared PI solution, and correctly specified microscope filter sets. This application note details the protocols and specifications essential for reproducible, quantitative analysis in drug development contexts.
Research Reagent Solutions & Essential Materials
The following table catalogues the core reagents and materials required for executing the FDA-aligned PI staining protocol for cell viability assessment.
Table 1: Essential Research Reagent Solutions and Materials
| Item | Function & Specification |
|---|---|
| Propidium Iodide (PI) Stock Solution (1.0 mg/mL in aqueous buffer) | DNA-binding fluorescent dye; impermeant to live cells. Binds to nucleic acids upon loss of plasma membrane integrity. |
| Phosphate-Buffered Saline (PBS), 1X, pH 7.4 | Isotonic washing and dilution buffer. Maintains pH and osmotic balance to prevent artificial cell damage. |
| Fluoroshield or Similar Mounting Medium | Aqueous, anti-fade mounting medium. Preserves fluorescence and allows for direct observation. |
| Cell Culture Medium (e.g., DMEM) | For maintaining cells during treatment phases prior to staining. |
| 70% Ethanol (in DNase-free water) | For decontamination and cleaning of surfaces. |
| Trypan Blue Solution (0.4%) | Optional counterstain or for independent viability assessment via brightfield. |
| DNase/RNase-free Microcentrifuge Tubes | For preparing and storing staining solutions to prevent nucleic acid degradation. |
| Glass Coverslips (No. 1.5 thickness) | Optimal for high-resolution oil immersion microscopy. |
| 35 mm or 96-well Imaging Dishes | Tissue culture-treated vessels suitable for live-cell imaging protocols. |
Microscope Filter Set Specifications
Accurate detection of PI emission requires a filter set optimized for its spectral profile. The following table summarizes the quantitative specifications for a standard PI filter cube.
Table 2: Microscope Filter Set Specifications for Propidium Iodide
| Parameter | Specification | Rationale |
|---|---|---|
| Excitation (Ex) Filter | 530-550 nm bandpass (Center ~535/540 nm) | Targets PI's peak excitation wavelength (~535 nm). |
| Dichroic (Beamsplitter) Mirror | 560 nm longpass | Reflects light below ~560 nm to sample, transmits emitted light above 560 nm to detector. |
| Emission (Em) Filter | 590-650 nm bandpass (Center ~615 nm) | Isolates PI's peak emission (~617 nm), blocks autofluorescence and excitation bleed-through. |
| Recommended Light Source | Mercury arc, LED (530-550 nm) | Provides intense, stable illumination in the required excitation range. |
| Critical Note | Must exclude FITC/GFP filter sets | Standard FITC sets (Ex~480/Em~525) are unsuitable for PI and will yield weak/no signal. |
Detailed Protocol: PI Staining for Cell Viability Assay
Application Note: Adherent Cells in a 35 mm Imaging Dish
A. Reagent Preparation
- PI Working Solution (1 µg/mL): Dilute PI stock solution (1 mg/mL) 1:1000 in 1X PBS. Example: Add 5 µL of stock to 5 mL PBS. Protect from light. Stable at 4°C for 2 weeks.
- Fixative Solution (4% Paraformaldehyde in PBS): Prepare fresh or use aliquots. Caution: Use in fume hood.
B. Staining Protocol
- Cell Preparation: Seed cells in an imaging dish and apply experimental treatments (e.g., drug candidate).
- Washing: Aspirate culture medium. Gently rinse cells twice with 2 mL of pre-warmed 1X PBS.
- Staining: Add 1 mL of PI working solution (1 µg/mL) directly to the cells in the dish.
- Incubation: Incubate at room temperature, protected from light, for 15-20 minutes.
- Optional Fixation (for later imaging): a. Aspirate PI solution. b. Wash gently with 2 mL PBS. c. Add 1 mL of 4% PFA. Incubate 15 min at RT. d. Aspirate PFA, wash 3x with 2 mL PBS.
- Mounting/Imaging:
- Live Imaging: After staining step (4), aspirate PI solution, replace with 1 mL fresh culture medium or PBS. Image immediately.
- Fixed Imaging: After step 5, add a few drops of Fluoroshield mounting medium. If using a coverslip, seal edges. Image.
C. Microscopy & Analysis
- Use the microscope filter set specified in Table 2.
- Capture images using consistent exposure times across all experimental groups.
- Quantify viability: (Total cells - PI-positive nuclei) / Total cells x 100%. Use image analysis software (e.g., ImageJ, CellProfiler).
Data Presentation: Typical Results from PI Viability Assay
The table below presents example quantitative data from a hypothetical drug toxicity study using the above protocol.
Table 3: Example PI Staining Viability Data in Drug-Treated Cells
| Drug Treatment Condition | Concentration (µM) | Mean % Viable Cells (PI-negative) ± SD | Mean % Non-Viable Cells (PI-positive) ± SD | n (fields analyzed) |
|---|---|---|---|---|
| Control (Vehicle) | 0 | 98.2 ± 1.1 | 1.8 ± 1.1 | 10 |
| Candidate Drug A | 1 | 95.5 ± 2.3 | 4.5 ± 2.3 | 10 |
| Candidate Drug A | 10 | 65.4 ± 5.6 | 34.6 ± 5.6 | 10 |
| Candidate Drug A | 100 | 22.1 ± 4.8 | 77.9 ± 4.8 | 10 |
| Positive Control (70% EtOH) | - | 5.3 ± 2.1 | 94.7 ± 2.1 | 5 |
Visualized Workflows and Pathways
Diagram 1: PI Staining Experimental Workflow
Diagram 2: PI Signal Generation Pathway
Diagram 3: Microscope Filter Configuration for PI
Disclaimer: Propidium Iodide (PI) is a potential mutagen and should be handled as a hazardous chemical. This document provides guidelines based on current best practices and safety data sheets (SDS). Always consult and adhere to your institution's Environmental Health and Safety (EHS) protocols and the most current SDS for the specific product in use.
Hazard Identification
Propidium Iodide (CAS 25535-16-4) is a fluorescent nucleic acid stain commonly used in fluorescence microscopy and flow cytometry for assessing cell viability (as it is excluded by intact plasma membranes) and in DNA content analysis.
Primary Hazards:
- Mutagenicity: May cause genetic defects (H340).
- Acute Toxicity: Harmful if swallowed, in contact with skin, or if inhaled (H302, H312, H332).
- Environmental Hazard: Toxic to aquatic life (H400).
Personal Protective Equipment (PPE)
Mandatory PPE for handling PI solutions, powders, or contaminated materials must include:
- Lab coat (disposable recommended)
- Appropriate nitrile gloves (double-gloving for high-concentration work)
- Safety goggles or face shield
- Closed-toe shoes
Handling Procedures
General Handling
- Location: Handle PI only in a designated area, preferably a certified chemical fume hood (CFH), especially when weighing powder or preparing stock solutions.
- Containment: Use secondary containment (e.g., tray) for all vials and containers.
- Prevention: Minimize generation of aerosols and dust. Never mouth-pipette. Use proper engineering controls.
- Decontamination: Clean work surfaces with an appropriate decontaminant (e.g., 10% bleach, followed by ethanol) immediately after procedures.
Specific Protocols for FDA/PI Viability Staining in Microscopy
In the context of FDA (Fluorescein Diacetate)/PI dual staining for cell viability research, PI is used as a counterstain to identify dead cells. The following protocol incorporates safety measures.
Detailed Experimental Protocol:
- Preparation in CFH: Prepare a 1 mg/mL stock solution of PI in water or buffer inside a fume hood. Aliquot and store at -20°C protected from light.
- Working Solution: Dilute PI stock in buffer (e.g., PBS) to a final concentration of 1-5 µg/mL for microscopy. This dilution must be performed in the hood.
- Staining Procedure:
- Following incubation of cells with FDA (which is converted to fluorescein in live cells), add the PI working solution directly to the culture medium.
- Final concentration in the well/dish should be 0.5-2 µg/mL.
- Incubate for 5-10 minutes at room temperature, protected from light.
- Microscopy: Visualize using a fluorescence microscope with standard TRITC/FITC filter sets. Live cells show green fluorescence (FDA), dead cells show red nuclear fluorescence (PI).
- Post-Experiment Handling: All contaminated tips, tubes, and media are considered hazardous waste. Place them immediately into a sealed, labeled container for mutagenic waste within the hood.
Spill and Exposure Procedures
Minor Spill (Small Volume, Concentrated Solution)
- Alert others. Restrict access.
- Don full PPE (add disposable apron if available).
- Contain spill with absorbent pads or vermiculite.
- Decontaminate area with 10% bleach solution, then clean with water or ethanol.
- Place all cleanup materials into hazardous waste container.
Skin or Eye Contact
- Eyes: Immediately flush with copious amounts of water for at least 15 minutes using an eyewash station. Seek medical attention.
- Skin: Remove contaminated clothing. Wash affected area thoroughly with soap and water.
Waste Disposal and Decontamination
PI waste must NEVER be disposed of via sink drain or regular trash.
- Liquid Waste: Collect all PI-containing solutions (working solutions, stained cell media, wash buffers) in a clearly labeled, leak-proof container dedicated to mutagenic/toxin waste.
- Solid Waste: All contaminated tips, tubes, gloves, absorbent pads, and wipes must be placed into a separate, labeled solid mutagenic waste container (autoclave bag inside a rigid container).
- Sharps: Contaminated sharps (e.g., broken slides) must be placed in a dedicated sharps container for hazardous sharps.
- Decontamination of Reusable Equipment: Pipettes, microscope stages, or other equipment that may have been contaminated must be cleaned with 10% bleach followed by 70% ethanol.
Table 1: Propidium Iodide Waste Disposal Summary
| Waste Type | Container | Disposal Method | Key Precautions |
|---|---|---|---|
| Liquid Solutions | Leak-proof, labeled bottle ("Mutagenic Liquid Waste") | Incineration via institutional hazardous waste | Never mix with waste containing heavy metals (e.g., azide). |
| Solid Contaminated Items | Rigid container with autoclave bag ("Solid Mutagenic Waste") | Autoclaving (121°C, 30 min) followed by incineration | Bag must be sealed before removal from hood. |
| Contaminated Sharps | Puncture-proof sharps container | Incineration via hazardous waste | Label container clearly with "Mutagenic Sharps". |
First Aid and Medical Attention
- Inhalation: Move to fresh air. Seek medical attention if respiratory discomfort occurs.
- Ingestion: Rinse mouth. Do NOT induce vomiting. Seek immediate medical attention. Provide SDS to physician.
- General: Always inform medical personnel of the specific chemical involved (Propidium Iodide) and its mutagenic hazards.
The Scientist's Toolkit: Research Reagent Solutions
Table 2: Essential Materials for FDA/PI Cell Viability Assay
| Item | Function/Description | Safety & Handling Notes |
|---|---|---|
| Propidium Iodide (Powder) | Nucleic acid intercalator; stains cells with compromised membranes. | Primary hazard. Handle powder in CFH only. Treat as mutagen. |
| Fluorescein Diacetate (FDA) Stock | Cell-permeant esterase substrate; converted to fluorescent fluorescein in live cells. | Prepare in DMSO. Handle DMSO with appropriate gloves (it penetrates many). |
| Dimethyl Sulfoxide (DMSO) | Solvent for preparing FDA stock solution. | Can facilitate skin absorption of other chemicals. Use chemical-resistant gloves. |
| Phosphate-Buffered Saline (PBS) | Diluent and washing buffer for cells. | Generally low hazard. Standard lab handling. |
| Cell Culture Media | Supports cells during staining procedure. | May become biohazardous after contact with cells. Disinfect per institutional protocol. |
| 10% Sodium Hypochlorite (Bleach) | Primary decontaminant for PI spills and surface cleaning. | Corrosive. Use in well-ventilated area. Do not mix with acids. |
| Hazardous Waste Containers | Dedicated, labeled containers for mutagenic liquid and solid waste. | Must be compatible and sealed. Located in the work area (e.g., inside hood). |
| Nitrile Gloves | Primary barrier against skin contact. | Change immediately if contaminated. Double-glove for high-risk steps. |
Visualizing the Workflow and Mechanism
Diagram Title: FDA/PI Viability Assay Workflow and Staining Mechanism
Diagram Title: PI Waste Management Pathway
Step-by-Step PI Staining Protocol for Fluorescence Microscopy
This protocol details the preparation of cells for subsequent Propidium Iodide (PI) staining and fluorescence microscopy analysis of cell viability, a critical component of cytotoxicity screening in drug development. Standardized seeding, treatment, and control setup are essential for generating reproducible, high-quality data suitable for regulatory submission frameworks like the FDA's.
Research Reagent Solutions & Essential Materials
| Item | Function |
|---|---|
| Cell Line (e.g., HepG2) | Model system for toxicity studies; relevant metabolic function. |
| Complete Growth Medium | Supports cell proliferation and maintains viability during experiment. |
| Phosphate-Buffered Saline (PBS) | Used for washing cells to remove serum and dead cells. |
| 0.25% Trypsin-EDTA | Detaches adherent cells for counting and seeding. |
| Trypan Blue Solution (0.4%) | Distinguishes viable from non-viable cells for accurate counting. |
| Test Compound(s) | Drug candidates or chemicals under investigation for cytotoxic effects. |
| Staurosporine (1 mM Stock) | Induces apoptosis; used as a chemical positive control for cell death. |
| Dimethyl Sulfoxide (DMSO) | Common solvent for water-insoluble compounds; vehicle control. |
| Propidium Iodide (PI) Stock (1 mg/mL) | Fluorescent DNA intercalator; excluded by live cells. |
| 96-well Black/Clear Bottom Plates | Optimal for fluorescence microscopy and high-throughput assays. |
Detailed Protocol
Part 1: Cell Seeding for Uniform Monolayer
Objective: To seed cells at an optimal density for treatment and analysis.
- Cell Harvesting: Culture your chosen cell line (e.g., HepG2) to ~80% confluence. Aspirate medium, wash with 5 mL PBS, and add 2 mL of 0.25% Trypsin-EDTA. Incubate at 37°C for 3-5 minutes.
- Neutralization & Counting: Neutralize trypsin with 8 mL of complete growth medium. Centrifuge cell suspension at 300 x g for 5 minutes. Resuspend pellet in 5 mL fresh medium. Mix 10 µL of cell suspension with 10 µL of 0.4% Trypan Blue. Count viable (unstained) cells using a hemocytometer or automated counter.
- Seeding Calculation & Execution: Calculate volume needed for a seeding density of 1.0 x 10⁴ cells per well in a 96-well plate (100 µL final volume/well). Prepare a diluted cell suspension accordingly. Seed 100 µL per well into the inner 60 wells of the plate (to avoid edge effects). Gently shake the plate in a cross-pattern to ensure even distribution.
- Incubation: Place the seeded plate in a humidified 37°C, 5% CO₂ incubator for 24 hours to allow cell attachment and entry into log-phase growth.
Part 2: Compound Treatment & Positive Control Setup
Objective: To apply test compounds and establish reliable control conditions.
- Compound Preparation: Dilute test compounds to a 2X final concentration in complete growth medium from DMSO stocks. Ensure final DMSO concentration does not exceed 0.5% (v/v) in any well.
- Plate Layout & Treatment: Design a plate map. Typically, include: Column 1-2: Vehicle Control (0.5% DMSO in medium). Column 11-12: Positive Control (Staurosporine, 2 µM final). Intermediate Columns: Test compounds at various concentrations (e.g., 1, 10, 100 µM). After 24h incubation, gently add 100 µL of the 2X solutions to the existing 100 µL of medium in each well (1:1 dilution to achieve 1X final concentration). Perform treatments in triplicate.
- Incubation: Return the plate to the incubator for the desired treatment period (e.g., 24, 48 hours).
Part 3: Preparation for PI Staining & Viability Assessment
Objective: To prepare cells for the downstream PI staining protocol.
- Pre-Staining Wash: Following treatment, carefully aspirate 150 µL of medium from each well using a multichannel pipette, taking care not to disturb the cell monolayer.
- PI Solution Application: Add 100 µL of pre-warmed PBS containing a 1 µg/mL final concentration of Propidium Iodide directly to each well. Incubate the plate at 37°C for 15-20 minutes protected from light.
- Immediate Analysis: Proceed directly to fluorescence microscopy imaging. Do not wash after PI addition, as this will reduce signal from late apoptotic/necrotic cells.
Data Presentation: Expected Outcomes & Controls
Table 1: Representative Plate Layout and Expected PI Fluorescence Results
| Well Group | Treatment | Purpose | Expected PI Signal (24h Tx) | Interpretation |
|---|---|---|---|---|
| A1-H3 | Vehicle (0.5% DMSO) | Negative Control | Low (<5% cells) | Baseline viability. |
| A4-H6 | Test Compound - Low Conc. | Efficacy Screening | Low to Moderate | Potential sub-toxic effect. |
| A7-H9 | Test Compound - High Conc. | Efficacy Screening | High | Cytotoxic effect. |
| A10-H12 | Staurosporine (2 µM) | Positive Control | Very High (>70% cells) | Assay validity control. |
Table 2: Critical Parameters for Protocol Success
| Parameter | Optimal Value/Range | Rationale |
|---|---|---|
| Seeding Density | 0.8 - 1.2 x 10⁴ cells/well (96-well) | Prevents over-confluence, ensures log-phase growth. |
| Cell Health at Seeding | >95% viability (Trypan Blue) | Reduces background death. |
| Treatment Duration | 24-48 hours | Allows for compound action & apoptotic progression. |
| Final DMSO Concentration | ≤0.5% (v/v) | Prevents vehicle-induced toxicity. |
| PI Incubation Time | 15-20 min at 37°C | Optimal for dye penetration without excessive background. |
Diagram: Experimental Workflow for Cell Preparation
Workflow for PI Assay Cell Preparation
Diagram: Cell Death Pathway for Positive Control
Staurosporine-Induced Apoptosis Leading to PI Uptake
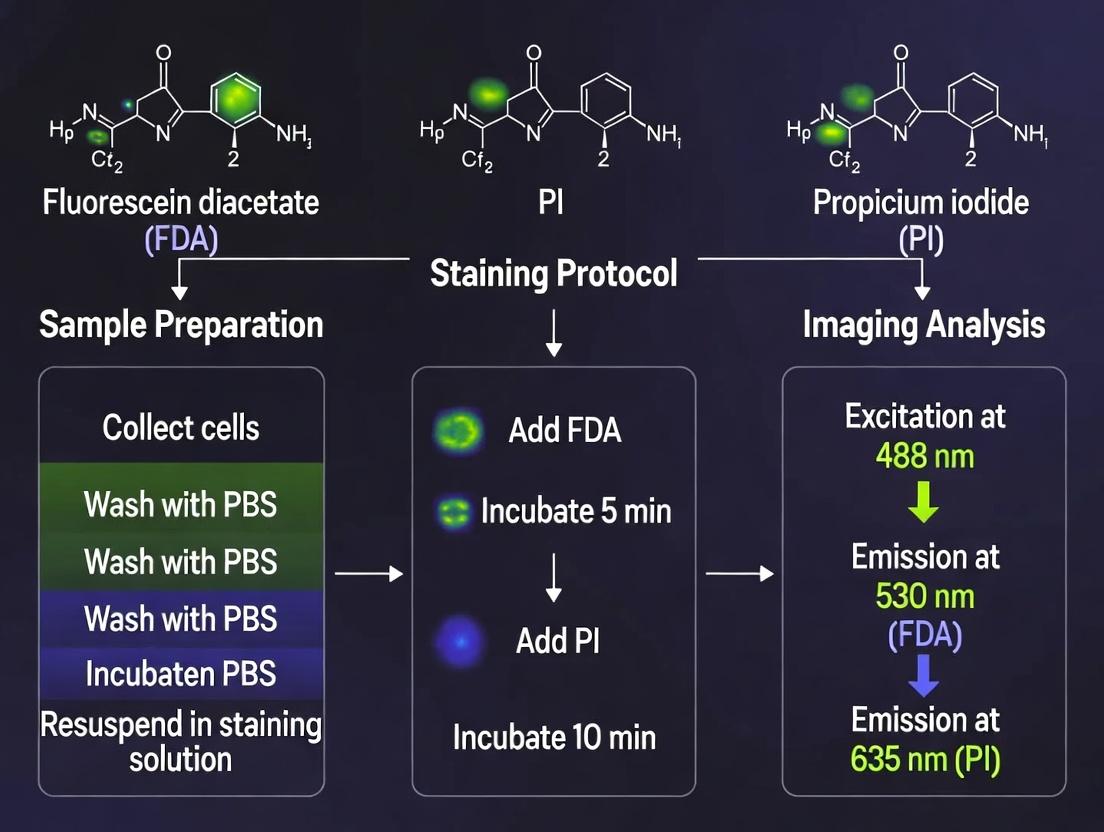
This application note details specific protocols for harvesting, staining with FDA (Fluorescein Diacetate) and PI (Propidium Iodide), and preparing adherent and suspension cell cultures for fluorescence microscopy analysis of cell viability. These standardized procedures are critical for generating reproducible, high-quality data in drug development research, particularly for pre-clinical cytotoxicity assays that may fall under FDA guidance.
Key Research Reagent Solutions
| Reagent/Material | Function in FDA/PI Viability Assay |
|---|---|
| Fluorescein Diacetate (FDA) | Cell-permeant esterase substrate. Viable cells cleave FDA to fluorescent fluorescein, marking live cells with green fluorescence. |
| Propidium Iodide (PI) | Cell-impermeant DNA intercalator. Only enters cells with compromised membranes (dead/apoptotic), producing red nuclear fluorescence. |
| Phosphate-Buffered Saline (PBS), 1X, without Ca2+/Mg2+ | Used for washing cells to remove serum esterases and for reagent dilution to maintain physiological pH and osmolarity. |
| Trypsin-EDTA Solution (0.05%-0.25%) | Proteolytic enzyme blend used to detach adherent cells from culture vessel surface for harvesting. |
| Serum-containing Culture Medium | Used to neutralize trypsin activity post-detachment of adherent cells. |
| Dimethyl Sulfoxide (DMSO), anhydrous | Solvent for preparing concentrated stock solutions of FDA. |
| Flow Cytometry Staining Buffer (PBS + 1% BSA) | Optional suspension cell wash buffer to reduce cell clumping and non-specific binding. |
Table 1: Recommended Staining Concentrations and Incubation Parameters
| Parameter | Adherent Cells | Suspension Cells | Notes |
|---|---|---|---|
| FDA Working Concentration | 5-10 µg/mL | 5-10 µg/mL | Prepare from 5 mg/mL DMSO stock. Final DMSO <0.5%. |
| PI Working Concentration | 1-5 µg/mL | 1-5 µg/mL | Prepare from 1 mg/mL aqueous stock. |
| Staining Incubation Time | 5-15 minutes | 5-15 minutes | Protect from light. |
| Optimal Temperature | 37°C | 37°C or Room Temp | 37°C recommended for enzymatic activity. |
| Recommended Cell Density for Microscopy | 1-5 x 10^4 cells/cm² | 1-5 x 10^5 cells/mL | Pre-seeded for adherent; in suspension for non-adherent. |
| Assay Linear Range (Viability) | 50-100% | 50-100% | Below 50%, fluorescence signal may be non-linear. |
Table 2: Fluorescence Microscopy Filter Set Requirements
| Fluorophore | Excitation Max (nm) | Emission Max (nm) | Recommended Filter Set |
|---|---|---|---|
| Fluorescein (from FDA) | ~490 nm | ~525 nm | FITC/GFP filter set |
| Propidium Iodide (PI) | ~535 nm | ~617 nm | TRITC/Red filter set |
Detailed Experimental Protocols
Protocol 4.1: Harvesting and Staining of Adherent Cells
Objective: To detach, collect, and stain adherent cells for viability analysis via fluorescence microscopy.
Materials:
- Confluent monolayer of adherent cells (e.g., HEK293, HeLa)
- Pre-warmed Trypsin-EDTA solution
- Complete growth medium (with serum)
- Pre-warmed PBS (without Ca2+/Mg2+)
- FDA stock solution (5 mg/mL in DMSO)
- PI stock solution (1 mg/mL in dH2O)
- Microcentrifuge tubes
- Hemocytometer or automated cell counter
- Microscope slides, coverslips, and mounting medium
Methodology:
- Remove Medium: Aspirate and discard the culture medium from the adherent cell monolayer.
- Wash: Gently rinse the monolayer with 2-3 mL of pre-warmed PBS to remove residual serum and dead cells. Aspirate PBS.
- Trypsinization: Add enough pre-warmed Trypsin-EDTA solution to cover the monolayer (e.g., 1 mL for a T25 flask). Incubate at 37°C for 2-5 minutes.
- Neutralization: Observe cells under a microscope for detachment. Once detached, add 2 volumes of complete growth medium to neutralize the trypsin.
- Pellet Cells: Transfer the cell suspension to a centrifuge tube. Pellet cells at 300 x g for 5 minutes.
- Wash Pellet: Aspirate supernatant. Resuspend the cell pellet in 1 mL of PBS and centrifuge again at 300 x g for 5 minutes.
- Count & Adjust Density: Aspirate supernatant. Resuspend cells in 1 mL of PBS. Count cells and adjust density to ~1x10^6 cells/mL.
- Staining: In a fresh tube, mix 100 µL of cell suspension with 1 µL of FDA stock and 0.5 µL of PI stock. Mix gently.
- Incubate: Incubate the staining mixture at 37°C in the dark for 10 minutes.
- Mount: Place 20 µL of stained suspension on a microscope slide, add a coverslip. Seal edges with clear nail polish if required for prolonged viewing.
- Image: Analyze immediately using a fluorescence microscope with FITC and TRITC filter sets.
Protocol 4.2: Harvesting and Staining of Suspension Cells
Objective: To directly stain suspension cells (e.g., Jurkat, THP-1) for viability analysis.
Materials:
- Culture of suspension cells in log-phase growth
- PBS (without Ca2+/Mg2+)
- Flow cytometry staining buffer (PBS + 1% BSA) optional
- FDA and PI stock solutions (as above)
- Microcentrifuge tubes
Methodology:
- Collect Cells: Gently mix the culture flask and transfer an aliquot of cell suspension (containing ~5x10^5 cells) to a centrifuge tube.
- Pellet Cells: Pellet cells at 300 x g for 5 minutes at room temperature.
- Wash: Aspirate the supernatant carefully. Resuspend the cell pellet in 1 mL of PBS or staining buffer. Centrifuge again at 300 x g for 5 minutes.
- Resuspend & Count: Aspirate supernatant. Resuspend cells in PBS to a density of ~1x10^6 cells/mL. Perform a cell count if necessary.
- Staining: In a fresh tube, combine 100 µL of cell suspension with 1 µL of FDA stock and 0.5 µL of PI stock. Mix gently but thoroughly.
- Incubate: Incubate at 37°C or room temperature in the dark for 10-15 minutes.
- Proceed to Analysis: No further washing is required. Gently mix the tube and apply 20 µL directly to a microscope slide for imaging under FITC and TRITC filters.
Visualizations
Adherent Cell Harvest & Stain Workflow
Suspension Cell Harvest & Stain Workflow
FDA/PI Mechanism for Viability Determination
1. Introduction This application note details a systematic, data-driven protocol for determining optimal Propidium Iodide (PI) staining conditions for cell viability assessment via fluorescence microscopy. Within the context of FDA PI staining protocol fluorescence microscopy cell viability research, the accurate quantification of live/dead cell ratios is a critical endpoint in drug cytotoxicity screening. This document provides validated experimental parameters and reproducible methodologies for researchers and drug development professionals.
2. Optimized Staining Parameters: Data Summary The following tables summarize key quantitative findings from recent literature and internal validation studies for adherent mammalian cell lines (e.g., HeLa, HEK293). Parameters may require titration for specific cell types or experimental conditions.
Table 1: Optimal PI Staining Concentrations for Fluorescence Microscopy
| Cell Type / Condition | Recommended PI Concentration (µg/mL) | Viability Assay Context | Key Rationale / Effect |
|---|---|---|---|
| Standard Adherent Lines (Healthy) | 1.0 – 2.5 | Baseline viability | Minimizes background, detects late apoptotic/necrotic cells. |
| Drug-Treated / Stressed Cells | 0.5 – 1.0 | Cytotoxicity screening | Lower concentration increases sensitivity to early membrane compromise. |
| Suspension Cells (e.g., Jurkat) | 0.5 – 1.5 | Flow cytometry correlate | Prevents aggregation and non-specific binding in suspension. |
| Co-staining with Hoechst 33342 | 1.0 – 2.0 | Multiplexed nuclear staining | Prevents fluorescence bleed-through; PI at higher wavelength. |
Table 2: Optimized Incubation Times and Imaging Windows
| Incubation Condition | Time Range (Minutes) | Temperature | Recommended Imaging Window Post-Staining |
|---|---|---|---|
| PI alone (in PBS or media) | 10 – 20 | 4°C (on ice) | Immediate to 30 minutes. Prolonged incubation increases background. |
| PI alone (in PBS or media) | 5 – 15 | 20-25°C (RT) | Immediate to 20 minutes. Faster kinetics but potential for artefact. |
| PI with FDA (Sequential) | 2 – 5 (after FDA) | 20-25°C (RT) | Immediate. Short incubation prevents viable cell esterase activity loss. |
| PI with Hoechst (Simultaneous) | 15 – 20 | 37°C | Within 60 minutes. Stable signal but fade Hoechst over time. |
3. Detailed Experimental Protocols
Protocol 1: Sequential FDA & PI Staining for Live/Dead Quantification Application: Standard endpoint viability assay for drug screening. Materials: Phosphate-Buffered Saline (PBS), Fluorescein Diacetate (FDA) stock (5 mg/mL in acetone), Propidium Iodide stock (1 mg/mL in water), fluorescence microscope with FITC and TRITC/Texas Red filters. Procedure:
- Cell Preparation: Seed cells in a multi-well plate or on chambered coverslips. Apply treatments (e.g., drug candidates).
- FDA Solution Prep: Dilute FDA stock in pre-warmed PBS or serum-free media to a final working concentration of 5-10 µg/mL. Protect from light.
- FDA Incubation: Aspirate culture medium. Add FDA working solution. Incubate at 37°C for 15-20 minutes.
- PI Solution Prep: Dilute PI stock in PBS to the optimal concentration (e.g., 1.5 µg/mL).
- PI Staining: Do not wash off FDA. Add PI working solution directly to the wells. Incubate at room temperature, protected from light, for 5 minutes.
- Imaging: Image immediately without washing. Use FITC filter for live cells (green FDA fluorescence) and TRITC filter for dead cells (red PI fluorescence). Capture multiple fields per condition.
Protocol 2: Co-staining PI with Hoechst 33342 for Nuclear Morphology Application: Concurrent viability assessment and nuclear morphology analysis. Materials: Hoechst 33342 stock (10 mg/mL in water), PI stock, PBS. Procedure:
- Staining Solution: Prepare a master mix in PBS containing both Hoechst 33342 (final conc. 2-5 µg/mL) and PI (final conc. 1-2 µg/mL).
- Staining: Aspirate culture medium. Add the co-staining solution to cover cells. Incubate at 37°C for 15-20 minutes, protected from light.
- Washing: Optional: Aspirate staining solution and rinse gently with warm PBS to reduce background.
- Imaging: Image using DAPI, FITC (for PI, if no FDA), and TRITC filter sets. Hoechst stains all nuclei (blue), PI stains dead cell nuclei (red).
4. Signaling Pathways and Experimental Workflows
Title: Mechanism of FDA and PI Staining for Cell Viability
Title: Sequential FDA/PI Staining & Optimization Workflow
5. The Scientist's Toolkit: Essential Research Reagent Solutions
| Item | Function / Rationale |
|---|---|
| Propidium Iodide (PI) | Vital DNA intercalating dye; cell-impermeant, stains nuclei of dead/dying cells with compromised membranes. Excitation/emission ~535/617 nm. |
| Fluorescein Diacetate (FDA) | Cell-permeant substrate for intracellular esterases in viable cells; hydrolysis yields green fluorescent fluorescein. Excitation/emission ~494/521 nm. |
| Hoechst 33342 | Cell-permeant minor groove-binding DNA stain; labels all nuclei, used for normalization and morphology. Excitation/emission ~350/461 nm. |
| Dimethyl Sulfoxide (DMSO) | Universal solvent for preparing stock solutions of many drug candidates and some fluorescent dyes; use at low final concentration (<0.5% v/v) to avoid cytotoxicity. |
| Phosphate-Buffered Saline (PBS), pH 7.4 | Isotonic buffer for washing cells, diluting dyes, and maintaining physiological pH during staining steps outside a CO₂ incubator. |
| Serum-Free Imaging Medium | Buffer or medium without serum or phenol red to reduce background fluorescence and autofluorescence during microscopy. |
| Trypan Blue Solution (0.4%) | A traditional viability stain for manual hemocytometer counts; provides a rapid, microscopy-based counterpoint to fluorescence methods. |
This application note is developed within the context of a broader thesis investigating cell viability via FDA (Fluorescein Diacetate) and PI (Propidium Iodide) staining in fluorescence microscopy for drug development research. Achieving precise, reproducible imaging is critical for quantifying live/dead cell ratios and assessing compound cytotoxicity. This document details optimized optical configurations, camera settings, and practical workflows to ensure data fidelity.
Recommended Filter Sets for FDA/PI Dual Staining
Fluorescein Diacetate (FDA) is hydrolyzed by esterases in viable cells to fluorescein (green). Propidium Iodide (PI) stains nuclei of dead cells with compromised membranes (red). Their emission spectra require specific filter sets to minimize bleed-through.
Table 1: Recommended Filter Specifications for FDA and PI Imaging
| Fluorophore | Ex Max (nm) | Em Max (nm) | Recommended Filter Set | Dichroic/Beamsplitter | Key Consideration |
|---|---|---|---|---|---|
| Fluorescein (FDA) | ~490 nm | ~514 nm | FITC/GFP Bandpass | Semrock #FF509-Di01 | Standard FITC set. |
| Propidium Iodide (PI) | ~535 nm | ~617 nm | TRITC/Cy3 Bandpass | Semrock #FF562-Di03 | Avoids green bleed-through. |
| Dual-View Set | 490 nm & 535 nm | 514 nm & 617 nm | Multiband (e.g., Semrock #LF488/561-A) | Multiband | Enables simultaneous or sequential capture with minimal channel crosstalk. |
Note: For sequential imaging on a system without a multiband set, the FITC set is used first for FDA, followed by the TRITC set for PI. Confirm minimal PI signal in the FITC channel.
Exposure Settings & Quantitative Imaging Protocol
Optimal exposure balances signal-to-noise ratio (SNR) with preventing photobleaching and saturation.
Table 2: Baseline Exposure & Camera Settings
| Parameter | FDA (Viable Cells) | PI (Dead Cells) | General Rule |
|---|---|---|---|
| Exposure Time | 100-500 ms | 50-200 ms | Start low, increase until SNR > 10. |
| Camera Gain | 1-2x (Unity) | 1-2x (Unity) | Increase gain only if necessary; adds noise. |
| Digital Offset | 0.5-1% | 0.5-1% | Prevents clipping of low-intensity signals. |
| LED/Lamp Power | 10-30% | 10-30% | Use lowest power giving good SNR to reduce phototoxicity. |
| Z-stack Step Size | 0.5 - 1.0 µm | 0.5 - 1.0 µm | Match to optical slice thickness (~0.7µm for 40x/1.3 NA). |
Protocol 3.1: Optimizing Exposure for Quantification
- Prepare Control Slides: Use a sample with known high viability (FDA+ only) and a sample fixed/permeabilized for PI+ only.
- Set Initial Conditions: Use settings from Table 2 as a starting point.
- Adjust for FDA:
- Focus on a viable cell cluster.
- Increase exposure time until the brightest intracellular signal is just below saturation (check histogram).
- Record the time (e.g., 300ms).
- Adjust for PI:
- Switch to the PI-positive control sample.
- Adjust exposure time for PI channel so that no signal is detectable in the FDA channel (check for bleed-through).
- Record the time (e.g., 150ms).
- Validate on Test Sample: Image a dual-stained test sample. Use software-based spectral unmixing if bleed-through is observed.
Critical Capture Tips for Viability Assays
- Sequential Capture Order: Always capture the FDA (green) channel before the PI (red) channel. PI can be phototoxic with excessive exposure, artificially increasing PI signal.
- Environmental Control: Maintain 37°C and 5% CO₂ during live imaging using a stage-top incubator. Viability is time-sensitive.
- Focus Stability: Use hardware autofocus systems (e.g., laser-based) for time-lapse studies to maintain focus over hours.
- Field Selection: Capture ≥5 random fields per well/sample to ensure statistical robustness. Avoid edges.
- Calibration: Perform flat-field correction using a uniform fluorophore slide to correct for illumination inhomogeneity, essential for intensity-based quantification.
Experimental Workflow for FDA/PI Viability Assay
Protocol 5.1: Cell Viability Assessment via Fluorescence Microscopy Materials: Cultured cells, FDA stock solution (5 mg/mL in acetone), PI stock solution (1 mg/mL in water), PBS, drug compounds, fluorescence microscope with live-cell capabilities. Procedure:
- Cell Preparation: Seed cells in a µ-Slide or multi-well plate 24-48 hours prior. Treat with test compounds for desired duration.
- Staining Solution: Prepare fresh working solution in PBS: 5 µg/mL FDA and 1-2 µg/mL PI. Note: Acetone from FDA stock must be <0.5% final concentration.
- Staining: Remove culture medium, gently rinse with PBS. Add staining solution to cover cells. Incubate for 5 minutes at 37°C.
- Imaging: Replace stain with fresh pre-warmed medium or PBS. Image immediately using protocols in Sections 2 & 3.
- Analysis: Count FDA+ (viable), PI+ (dead), and double-positive (dying) cells using automated segmentation software (e.g., CellProfiler, ImageJ).
Title: FDA/PI Cell Viability Imaging Workflow
The Scientist's Toolkit: Key Research Reagent Solutions
Table 3: Essential Materials for FDA/PI Viability Assays
| Item | Function & Rationale |
|---|---|
| Fluorescein Diacetate (FDA) | Cell-permeant esterase substrate. Hydrolysis in live cells yields fluorescent fluorescein. |
| Propidium Iodide (PI) | Cell-impermeant DNA intercalator. Only enters cells with compromised plasma membranes. |
| Live-Cell Imaging Medium | Phenol-red free, HEPES-buffered. Maintains pH without CO₂, reduces background fluorescence. |
| Stage-Top Incubator | Maintains physiological temperature and gas during imaging, critical for live-cell kinetics. |
| µ-Slide/Glass-Bottom Plates | Provides optimal optical clarity for high-resolution microscopy compared to standard plastic. |
| Automated Cell Counter Software | Enables high-throughput, unbiased quantification of viable/dead cells from multiple images. |
| Immersion Oil (Type F) | Specified for live-cell imaging. Low fluorescence and toxicity, stable at 37°C. |
Within FDA PI (Propidium Iodide) staining protocol fluorescence microscopy research for cell viability, quantitative analysis is critical for determining the percentage of non-viable cells in a sample. The choice between manual counting and automated image analysis software directly impacts data objectivity, throughput, reproducibility, and statistical robustness. This application note details protocols and comparative analysis for both methods, supporting a broader thesis on standardizing and validating quantitative approaches in regulatory-focused cell health assessment.
Experimental Protocols
Protocol A: Manual Counting via Hemocytometer & Fluorescence Microscopy
Objective: To quantify PI-positive (dead) and total cell counts from a stained sample. Materials: Cell suspension, PI stain (1 µg/mL final concentration), PBS, hemocytometer, fluorescent microscope with TRITC/Rhodamine filter, cover slips, timer. Procedure:
- Stain: Incubate cell suspension with PI working solution (1:1 v/v) for 5 minutes at room temperature, protected from light.
- Load: Pipette 10 µL of stained suspension onto a hemocytometer, ensuring no overflow.
- Image: Using a 20x objective, switch to fluorescence illumination. Capture multiple non-overlapping images from the grid's four corner and central squares.
- Count: Visually identify and count PI-positive cells (red fluorescent nuclei) and total cells (using phase-contrast or a nuclear counterstain like Hoechst from a separate channel/image). Count cells touching the top and left borders, exclude those touching bottom and right.
- Calculate: Viability (%) = [(Total cells - PI-positive cells) / Total cells] * 100. Average counts from all squares.
Protocol B: Automated Analysis via Image Analysis Software (e.g., ImageJ/Fiji, CellProfiler)
Objective: To automatically segment and classify cells from multi-channel fluorescence images to calculate viability. Materials: PI-stained sample, fluorescent microscope with appropriate filters, computer with analysis software (e.g., ImageJ). Procedure:
- Image Acquisition: Acquire dual-channel images: Channel 1 (e.g., DAPI/Hoechst for all nuclei), Channel 2 (TRITC for PI signal). Use consistent exposure times across samples.
- Software Workflow (Generic):
- Preprocessing: Apply background subtraction (rolling ball radius ~50 pixels) to each channel.
- Nuclei Segmentation: Use the primary stain channel (DAPI). Apply a Gaussian blur (sigma=2), then auto-threshold (e.g., Otsu, Triangle) to create a binary mask. Run "Analyze Particles" to define all nuclei (objects). Exclude objects below 10-pixel area.
- PI Signal Quantification: For each detected nucleus (Region of Interest, ROI), measure the mean intensity in the PI channel.
- Classification: Set a threshold for PI positivity. Nuclei with mean PI intensity above a defined cutoff (e.g., 2 standard deviations above the negative control mean) are classified as dead.
- Calculate: Software generates counts for total nuclei and PI-positive nuclei, automatically calculating viability percentage.
Table 1: Comparison of Manual vs. Automated Quantitative Analysis
| Parameter | Manual Counting | Automated Image Analysis |
|---|---|---|
| Throughput | Low (~5-10 samples/hour) | High (~20-50 samples/hour, post-setup) |
| Objectivity | Subjective; prone to researcher bias and fatigue. | High; based on defined algorithms and thresholds. |
| Reproducibility | Moderate to Low (inter-operator variability). | High (algorithm consistency). |
| Data Richness | Basic counts only. | Multiparametric (counts, intensity, morphology, spatial data). |
| Initial Time Investment | Low (minimal setup). | High (protocol development & validation). |
| Optimal Use Case | Low sample number, pilot studies, or sparse cells. | High-content screening, large n-numbers, complex assays. |
| Statistical Power | Limited by low n (number of fields counted). | Enhanced by analyzing 1000s of cells per condition. |
Table 2: Representative Data from a Pilot Viability Assay (Hypothetical Data)
| Condition | Manual Count (Viability % ± SD) | Automated Analysis (Viability % ± SD) | Cells Analyzed (Manual) | Cells Analyzed (Auto) |
|---|---|---|---|---|
| Control | 95.2 ± 3.1 | 96.5 ± 1.2 | ~300 | 12,540 |
| Treatment A | 67.8 ± 5.5 | 65.3 ± 2.8 | ~250 | 10,987 |
| Treatment B | 45.6 ± 7.2 | 42.1 ± 3.5 | ~200 | 9,876 |
Visualization of Workflows & Logical Framework
The Scientist's Toolkit: Essential Research Reagent Solutions
Table 3: Key Materials for PI Staining Cell Viability Assay
| Item | Function/Description | Example/Catalog Consideration |
|---|---|---|
| Propidium Iodide (PI) | Vital DNA dye excluded by live cells; stains nuclei of dead/damaged cells. | Aqueous solution, 1.0 mg/mL. Often used at 1 µg/mL final concentration. |
| Hoechst 33342 or DAPI | Cell-permeant nuclear counterstain to label all nuclei, enabling total cell count in automated analysis. | Essential for automated segmentation. Hoechst is often preferred for live-cell imaging. |
| Fluorescence Microscope | Equipped with appropriate filter sets for DAPI/Hoechst (Ex/Em ~350/460 nm) and PI/TRITC (Ex/Em ~535/617 nm). | Epifluorescence or confocal systems with camera. |
| Hemocytometer | Gridded slide for manual cell counting under a microscope. | e.g., Improved Neubauer chamber. |
| Image Analysis Software | For automated quantification. Open-source (ImageJ/Fiji, CellProfiler) or commercial (MetaMorph, HCS Studio). | ImageJ is widely used; requires plugin (e.g., Cell Counter) for manual or macro for auto-analysis. |
| Cell Culture Plates | For seeding cells, preferably with optical bottoms for high-quality imaging. | Black-walled, clear-bottom 96-well plates reduce cross-talk. |
| Positive Control | To validate PI staining. Typically, a sample with a known high proportion of dead cells. | Cells treated with 70% ethanol for 5 minutes. |
Troubleshooting PI Staining: Solving Common Problems for Accurate Results
In the context of FDA PI (fluorescein diacetate/propidium iodide) staining for cell viability assays, high background fluorescence is a critical impediment to accurate quantification in fluorescence microscopy. This issue directly impacts the reliability of data for drug development and regulatory submissions, such as those required by the FDA. Excessive background can obscure the differential signal between viable (green fluorescein) and non-viable (red PI) cells, leading to false viability assessments. This application note details the primary causes of high background specific to wash steps and reagent concentrations, and provides optimized, actionable protocols to mitigate these issues.
Causes of High Background Fluorescence
High background in FDA/PI assays typically originates from incomplete removal of unhydrolyzed FDA or unbound PI, nonspecific binding of dyes, and suboptimal concentration ratios.
| Cause Category | Specific Issue | Impact on Background |
|---|---|---|
| Inadequate Washes | Insufficient volume or number of PBS washes. | High extracellular fluorescein and PI signal. |
| Inadequate Washes | Improper aspiration leaving residual liquid. | Concentrated dye residues in the field. |
| Inadequate Washes | Aggressive washing that detaches cells. | Creates debris that binds dye nonspecifically. |
| Dye Concentration | FDA concentration too high. | Overwhelms esterase capacity, leading to excess extracellular substrate. |
| Dye Concentration | PI concentration too high. | Excessive nuclear and nonspecific cytoplasmic binding. |
| Incubation Conditions | Incubation time too long. | Increased dye penetration into compromised viable cells. |
| Sample Factors | High apoptotic/necrotic debris. | Debris binds both dyes, increasing diffuse signal. |
| Sample Factors | Media components (e.g., phenol red, serum). | Autofluorescence or serum esterase activity. |
Optimized Protocols for Washes and Concentrations
Protocol 3.1: Standardized Wash Procedure for Adherent Cells (FDA/PI)
Objective: To effectively remove unbound dyes while preserving cell monolayer integrity. Materials:
- Phosphate-Buffered Saline (PBS), without Ca2+/Mg2+
- Aspiration system (vacuum or pipette)
- Microplate centrifuge (for suspension cells) Method:
- After FDA incubation, gently aspirate 80% of the supernatant using a fine-tip aspirator.
- Gently add pre-warmed PBS (37°C) to the wells. Volume should be 2-3x the original culture medium volume.
- Rock the plate gently on a horizontal shaker for 3 minutes at low speed.
- Aspirate as in step 1, ensuring the tip does not contact the cell monolayer.
- Repeat steps 2-4 for a total of three washes.
- For the final wash, after aspiration, briefly invert the plate on clean lint-free tissue to remove residual droplets from well edges.
- Proceed immediately to microscopy or add PI-containing solution for the next step.
Protocol 3.2: Titration of FDA and PI Concentrations
Objective: To determine the optimal dye concentration that maximizes signal-to-noise ratio for a specific cell line. Materials:
- FDA stock solution (5 mg/mL in acetone)
- PI stock solution (1 mg/mL in PBS)
- Cell suspension (adherent cells trypsinized)
- Black-walled, clear-bottom 96-well plates
- Fluorescence microplate reader or microscope Method:
- Seed cells at a standard density (e.g., 10^4 cells/well) and culture for 24 hours.
- FDA Titration: Prepare a dilution series of FDA in culture medium (e.g., 1, 2.5, 5, 10, 15 µg/mL final concentration). Test each concentration in triplicate on viable cells. Incubate 15 min at 37°C, wash 3x per Protocol 3.1, and measure fluorescence (Ex/Em ~492/517 nm). The optimal concentration is the lowest that yields a strong, stable signal with minimal increase in background in blank (cell-free) wells.
- PI Titration: Induce cell death in some wells (e.g., 70% ethanol, 30 min). Prepare a PI dilution series (e.g., 0.5, 1, 2, 4, 8 µg/mL final). Add PI to both viable and non-viable cell samples. Incubate 5-10 min at 4°C (protected from light), do not wash, and measure fluorescence (Ex/Em ~535/617 nm). The optimal concentration maximizes the difference between dead and live cell signals.
| Typical Optimal Concentration Ranges for Common Cell Lines | |||
|---|---|---|---|
| Cell Type | FDA (Final Conc.) | PI (Final Conc.) | Notes |
| HeLa | 2-5 µg/mL | 1-2 µg/mL | Robust esterase activity. |
| HEK293 | 5-10 µg/mL | 1-2 µg/mL | Moderate esterase activity. |
| Primary Hepatocytes | 1-3 µg/mL | 0.5-1 µg/mL | Sensitive to overstaining. |
| Jurkat (Suspension) | 5-10 µg/mL | 2-4 µg/mL | Requires centrifugation for washes. |
Visualization of Workflow and Decision Path
Decision Workflow for Troubleshooting High Background
The Scientist's Toolkit: Key Reagent Solutions
| Item | Function & Rationale | Optimal Specification/Note |
|---|---|---|
| PBS (Ca2+/Mg2+-Free) | Washing buffer. Removes unbound dye. Lack of divalent cations prevents cell clumping. | Sterile, pH 7.4. Pre-warm to 37°C for adherent cells to prevent detachment. |
| Fluorescein Diacetate (FDA) | Cell-permeant viability probe. Converted to green-fluorescent fluorescein by intracellular esterases. | High purity (>98%). Store stock in anhydrous acetone at -20°C in the dark. |
| Propidium Iodide (PI) | Cell-impermeant dead cell stain. Binds DNA of membrane-compromised cells. | High purity (>94%). Store aqueous stock at 4°C in the dark. |
| Dimethyl Sulfoxide (DMSO) | Alternative solvent for FDA stock. Less volatile than acetone, may reduce precipitation. | Sterile, cell culture grade. Use if acetone affects specific cell types. |
| Black-Walled Microplates | For quantitative reading. Minimizes well-to-well crosstalk and background scatter. | Clear bottom for microscopy. Use for titration experiments. |
| Gentle Aspiration Tips | For supernatant removal. Fine tips with filters prevent disturbance of adherent monolayers. | Angled, low-retention tips are ideal for consistent washing. |
| Serum-Free Medium | Dye dilution medium. Serum contains esterases that can hydrolyze FDA extracellularly. | Use for diluting FDA and during wash steps if background persists. |
Propidium Iodide (PI) staining is a cornerstone assay for determining cell viability in fluorescence microscopy, widely referenced in FDA-related guidance for cytotoxicity and drug safety evaluation. A weak or absent PI fluorescence signal compromises data integrity, leading to false viability assessments. This application note systematically addresses the primary failure points: PI potency and handling, inadequate or excessive cell permeabilization, and incorrect microscope configuration, framed within a rigorous research context.
Table 1: Critical Parameters for Optimal PI Staining and Detection
| Parameter | Optimal Range / Value | Effect if Sub-Optimal | Supporting Evidence (Typical) |
|---|---|---|---|
| PI Stock Concentration | 1.0 - 1.5 mg/mL in aqueous buffer | Precipitation; unreliable staining | Standard protocol (FDA ICH S2) |
| Final Working Concentration | 1 - 5 µg/mL | Weak signal (too low); high background (too high) | Flow cytometry consensus |
| Cell Fixation (if used) | 2-4% PFA, ≤15 min @ 4°C | Over-fixation quenches fluorescence | Cytometry A, 2023 |
| Permeabilization Agent | 0.1-0.5% Triton X-100, 5-15 min | Weak signal (insufficient); loss of morphology (excessive) | Nature Protocols |
| Incubation Time (Post-Stain) | 15-30 min, 4°C (live) | Incomplete DNA intercalation | Manufacturer datasheets |
| Excitation Max | 535 nm (range 490-570 nm) | Signal loss if laser/line is mismatched | PI spectral data |
| Emission Max | 617 nm (collect >600 nm LP) | Signal loss if filter bandwidth is wrong | PI spectral data |
| Laser Power / Lamp Hours | Lamp: <300 hrs; Laser: appropriate % | Photobleaching; insufficient excitation | Microscope manuals |
Table 2: Troubleshooting Guide: Symptom vs. Likely Cause & Solution
| Symptom | Likely Cause | Recommended Action |
|---|---|---|
| No signal in dead cells | 1. PI degraded/old 2. No permeabilization of dead cells 3. Microscope filter set mismatch | 1. Prepare fresh stock, test on known dead cells. 2. Include positive control (fixed/permeabilized cells). 3. Verify filter set is for Texas Red/Cy3, not FITC. |
| Signal in "live" cells | 1. Excessive permeabilization 2. PI concentration too high 3. Cells undergoing apoptosis (membrane leaky) | 1. Optimize permeabilization agent concentration/time. 2. Titrate PI to 1-2 µg/mL. 3. Use Annexin V/PI dual staining. |
| Weak, uneven signal | 1. Inadequate incubation time 2. Evaporation during imaging 3. Incorrect focus or pinhole (confocal) | 1. Incubate 30 min, include gentle agitation. 2. Use sealed, hydrated chambers. 3. Adjust focus and pinhole to 1 Airy unit. |
| High background, blurred | 1. PI precipitate 2. Cell debris 3. Coverslip/thickness mismatch | 1. Filter PI solution before use (0.2 µm). 2. Wash cells post-staining. 3. Use correct #1.5 (0.17mm) coverslips. |
Detailed Experimental Protocols
Protocol 1: Validating PI Potency & Staining (Positive Control)
Purpose: To confirm reagent functionality and establish a baseline signal. Materials: Cultured cells (e.g., HeLa), PI stock (1 mg/mL), 70% ethanol, PBS, fluorescence microscope. Procedure:
- Generate Dead Cell Control: Harvest ~1x10^6 cells. Pellet and resuspend in 1 mL PBS. Add 3 mL of ice-cold 70% ethanol dropwise while vortexing gently. Fix at -20°C for 1 hour.
- Wash: Pellet cells (300 x g, 5 min), carefully decant ethanol. Wash twice with 2 mL PBS.
- Stain: Resuspend cell pellet in 1 mL PBS containing PI at 2 µg/mL. Incubate for 30 minutes at 4°C in the dark.
- Image: Pellet, resuspend in fresh PBS, mount on slide, and image immediately.
- Expected Outcome: >95% of cells should show bright nuclear fluorescence. If not, PI stock or microscope settings are faulty.
Protocol 2: Optimizing Permeabilization for Live-Cell PI Assays
Purpose: To selectively permeabilize dead/damaged cells without affecting live cell membranes. Materials: Live cell culture, PI, Triton X-100, HBSS buffer. Procedure:
- Prepare Permeabilization Series: Create Triton X-100 solutions in HBSS at 0%, 0.05%, 0.1%, 0.3%, and 0.5% (v/v).
- Treat Cells: For each concentration, incubate a well of cells (containing a known mix of live and intentionally heat-killed cells) with the Triton solution for 10 minutes at RT.
- Stain: Replace solution with HBSS containing 2 µg/mL PI. Incubate 20 min, RT, dark.
- Image & Quantify: Acquire images using consistent settings. Calculate the Signal-to-Background Ratio (SBR) for dead vs. live cells.
- Analysis: The optimal concentration maximizes signal in dead cells while minimizing signal in live cells (highest SBR).
Protocol 3: Microscope Setup & Validation for PI
Purpose: To configure the microscope for maximum PI signal detection. Materials: PI-stained positive control slide (from Protocol 1), calibration slides if available. Procedure:
- Filter Set Selection: Engage a filter set suitable for TRITC/Texas Red (Ex: 540/25 nm, Em: 605/55 nm). For confocal, set excitation laser to 561 nm or 543 nm, and emission detection range to 580-650 nm.
- Initial Imaging: Locate cells using brightfield. Switch to fluorescence using low-intensity light (to avoid bleaching).
- Exposure/Gain Optimization: Increase gain/detector voltage until the brightest cells are just below saturation. Note this setting for future experiments.
- Background Check: Move to an area without cells. The background should be near black. High background indicates light leaks, autofluorescence, or PI precipitate.
- Documentation: Record all critical settings: objective NA, zoom, laser power/%, detector gain, offset, pinhole size, and exposure time.
Visualization: Pathways and Workflows
Diagram Title: PI Staining Experimental Decision Workflow
Diagram Title: PI Signal Failure Root Cause Analysis
The Scientist's Toolkit: Research Reagent Solutions
Table 3: Essential Materials for Robust PI Viability Assays
| Item | Function & Rationale | Recommended Product/Specification |
|---|---|---|
| Propidium Iodide (PI) | DNA intercalating dye; excluded by intact plasma membranes. The core viability indicator. | High purity, >94% (HPLC). Aliquot in dH₂O at 1 mg/mL, store at -20°C in the dark. |
| Triton X-100 or Saponin | Mild detergent for controlled permeabilization of fixed cells or dead cells in some protocols. | Molecular biology grade. Prepare fresh dilutions in buffer. |
| Phosphate-Buffered Saline (PBS) | Isotonic washing and staining buffer to maintain cell integrity. | Calcium- and magnesium-free to prevent cell clumping. |
| Bovine Serum Albumin (BSA) | Used in staining buffers (0.5-1%) to reduce non-specific background binding. | Protease-free, fraction V. |
| RNase A | Often co-incubated with PI to degrade RNA and prevent cytoplasmic staining, ensuring nuclear specificity. | DNase-free, 100 µg/mL final concentration. |
| #1.5 High-Precision Coverslips | Correct thickness (0.17mm) is critical for optimal resolution and spherical aberration correction in high-NA objectives. | Thickness tolerance ± 0.01mm. |
| Antifade Mounting Medium | Preserves fluorescence signal during microscopy, especially for fixed samples. | Contains agents like p-phenylenediamine or commercial formulations. |
| Validated Positive Control Cells | Ethanol or heat-killed cells. Essential for troubleshooting and validating the entire staining/imaging pipeline. | Prepare fresh for each experiment. |
Within the framework of FDA PI staining protocol fluorescence microscopy for cell viability research, critical artifacts can compromise data integrity. This application note details protocols to identify and mitigate false positives/negatives arising from cell density variations, edge effects in multi-well plates, and treatment-related artifacts, ensuring robust adherence to regulatory standards in drug development.
Quantifying Artifact Impact on Viability Assays
The following table summarizes key quantitative findings from recent studies on artifact prevalence and impact in high-throughput screening.
Table 1: Impact of Common Artifacts on FDA/PI Viability Assay Outcomes
| Artifact Type | Typical False Positive/Negative Rate Shift | Primary Contributing Factor | Commonly Affected Well Region |
|---|---|---|---|
| High Cell Density (>50k cells/cm²) | +15-25% False Negatives (reduced FDA uptake/hydrolysis) | Nutrient depletion, altered probe kinetics | Central wells |
| Low Cell Density (<10k cells/cm²) | +5-15% False Positives (overestimation of death) | Background fluorescence dominance, statistical error | All wells |
| Edge Evaporation Effect | +20-40% False Positives (hypertonic stress) | Evaporation-induced medium concentration | Peripheral wells (Rows A, H; Columns 1, 12) |
| Treatment Crystallization | +10-30% Variable (light scattering, punctate fluorescence) | Compound insolubility at high concentration | Well bottom center |
| Meniscus Effect | +10-20% False Negatives (cell focusing issues) | Liquid meniscus alters focal plane | Well periphery |
Experimental Protocols
Protocol 2.1: Mapping Edge Effects in 96-Well Plates
Objective: To systematically quantify the spatial variability in cell viability readings due to evaporation in a standard incubation.
Materials:
- Confluent monolayer of HepG2 cells.
- Standard 96-well tissue culture plate.
- Fluorescein diacetate (FDA) stock solution (5 mg/mL in acetone).
- Propidium iodide (PI) stock solution (1 mg/mL in PBS).
- Automated fluorescence plate reader with appropriate filters (FDA: Ex/Em ~490/520 nm; PI: Ex/Em ~535/617 nm).
Method:
- Seed cells at a uniform density (e.g., 10,000 cells/well) in complete medium. Use a multichannel pipette for consistency.
- Incubate plate for 24 hours at 37°C, 5% CO₂ with the lid on.
- Do not treat cells. This establishes a baseline.
- Prepare working solution: Dilute FDA to 10 µg/mL and PI to 5 µg/mL in pre-warmed, serum-free assay buffer.
- Carefully aspirate medium from all wells and add 100 µL of FDA/PI working solution.
- Incubate plate (lid off) for 20 minutes at 37°C in the dark.
- Read fluorescence immediately on the plate reader.
- Analysis: Group wells by location: Inner (rows B-G, cols 2-11), Edge (rows A & H, cols 2-11), Corner (rows A & H, cols 1 & 12). Normalize all fluorescence values to the median of the Inner wells.
Protocol 2.2: Controlled-Cell Density Titration Experiment
Objective: To determine the optimal seeding density for FDA/PI assays that minimizes density-related artifacts.
Materials: As in Protocol 2.1.
Method:
- Prepare a cell suspension and perform a live cell count.
- Seed a 96-well plate with a serial dilution of cell density across a row. Example range: 2,500, 5,000, 10,000, 20,000, 40,000, 80,000 cells/well. Use 8 replicate wells per density.
- Incubate for 24 hours (lid on) to allow attachment.
- For half the replicates (n=4), induce controlled cell death (e.g., add 70% methanol for 10 minutes, then wash). The other half remains untreated (viable control).
- Perform FDA/PI staining as in Protocol 2.1, steps 4-7.
- Analysis: Calculate the Viability Index for each density: (Mean FDA signal of viable wells) / (Mean PI signal of dead wells). Plot Viability Index vs. Seeding Density. The optimal density is at the plateau before the index declines.
Protocol 2.3: Identifying Treatment-Induced Artifacts (Crystallization)
Objective: To distinguish true cytotoxicity from artifact caused by test compound precipitation.
Materials: As above, plus test compound(s) known to have solubility issues.
Method:
- Seed cells at optimal density determined in Protocol 2.2.
- Treat cells with a dilution series of the test compound for the desired period (e.g., 24h). Include vehicle controls.
- Prior to staining, examine each well using phase-contrast microscopy at 10x-20x magnification. Document any visible precipitate, crystal formation, or abnormal cell morphology not consistent with typical death (rounding, detachment).
- Perform FDA/PI staining and imaging.
- Correlative Analysis: Overlay phase-contrast and fluorescence images. Note if high PI signal co-localizes with crystals (light scattering artifact) or if crystals cause punctate, non-cellular FDA fluorescence.
Signaling Pathways and Workflows
Title: FDA/PI Mechanism & Common Artifact Interference
Title: Integrated Workflow to Minimize Assay Artifacts
The Scientist's Toolkit: Research Reagent Solutions
Table 2: Essential Materials for Robust FDA/PI Viability Assays
| Item | Function / Rationale | Key Consideration |
|---|---|---|
| Fluorescein Diacetate (FDA) | Cell-permeant viability probe. Hydrolyzed by intracellular esterases to fluorescent fluorescein, retained by intact membranes. | Aliquot and store at -20°C in anhydrous DMSO/acetone. Avoid freeze-thaw. Final DMSO <0.5%. |
| Propidium Iodide (PI) | Cell-impermeant dead cell stain. Binds DNA upon loss of membrane integrity. | Light sensitive. Use at low concentration (1-5 µg/mL) to minimize background. |
| Humidified Chamber | Reduces edge-effect evaporation during staining incubation (lid-off). | Critical for consistent peripheral well data. Commercial or DIY (sealed container with wet towels). |
| Plate Sealer or Lid with Gasket | Prevents evaporation during long-term incubations (e.g., 24-72h treatment). | Use breathable seals for CO₂ exchange or sealed lids for short periods. |
| Automated Liquid Handler | Ensures uniform reagent addition across all wells, critical for edge effect protocols. | Reduces manual error. Calibrate regularly. |
| Phase-Contrast Microscope | For pre-read QC to identify cell density issues, crystallization, or contamination. | Essential step before fluorescence reading. |
| Black-Walled, Clear-Bottom Plates | Maximizes fluorescence signal while allowing phase-contrast QC. Reduces cross-talk. | Superior to clear plates for fluorescence sensitivity. |
| Serum-Free Assay Buffer (e.g., HBSS, PBS) | Diluent for FDA/PI working solution. Serum esterases can hydrolyze FDA extracellularly. | Must be pre-warmed to 37°C to avoid thermal shock. |
| Positive Control Agents | To establish assay dynamic range (e.g., 70% Methanol for 100% death, Staurosporine for apoptosis). | Include in every plate. |
Within the context of FDA PI staining protocol fluorescence microscopy for cell viability research, the optimization for specific cell types presents significant challenges. Primary cells and sensitive cell lines (e.g., stem cells, neurons, hepatocytes) demand meticulous protocol adjustments due to inherent properties like metabolic variability, fragility, and rapid phenotypic drift. These challenges directly impact the accuracy of viability assessments, which are critical for drug development, cytotoxicity screening, and preclinical research. This document provides detailed application notes and protocols to address these specific hurdles, ensuring reliable and reproducible data aligned with FDA-relevant research standards.
The primary challenges in applying FDA/PI staining to sensitive cells stem from their physiological and culturing characteristics. Quantitative data from recent studies highlight these disparities.
Table 1: Comparative Sensitivity of Cell Types to Standard FDA/PI Staining Protocol Components
| Parameter | Immortalized Lines (e.g., HeLa) | Primary Fibroblasts | Sensitive Lines (e.g., iPSC-derived Neurons) | Primary Hepatocytes |
|---|---|---|---|---|
| Optimal FDA Concentration (µg/mL) | 5-10 | 2-5 | 0.5-2 | 1-3 |
| Optimal Incubation Time (min) | 5-15 | 10-20 | 15-30 | 10-20 |
| Tolerated PI Concentration (µg/mL) | 1-5 | 0.5-2 | 0.5-1.5 | 1-2 |
| Detachment Sensitivity (Trypsin) | Low | High | Very High | Very High |
| Background Esterase Activity | Moderate | Variable, Often High | Low | High |
| Typical Viability Range (Fresh Isolation) | >95% | 70-90% | 85-95% | 65-85% |
| Recommended Serum in Buffer | 0% | 2-5% | 5-10% | 2-5% |
Table 2: Impact of Protocol Modifications on Viability Assessment Accuracy
| Modification | Target Cell Type | Effect on FDA Signal (vs. Standard) | Effect on PI Signal (vs. Standard) | Reported Improvement in Viability Accuracy |
|---|---|---|---|---|
| Reduced FDA Dose & Time | iPSC-Cardiomyocytes | +25% (reduced saturation) | Unchanged | +18% |
| Pre-staining Serum Wash | Primary T-Cells | +15% (reduced hydrolysis) | -10% (reduced nonspecific binding) | +12% |
| Cold PBS + BSA for PI | Primary Neurons | Unchanged | +30% (reduced permeability shock) | +22% |
| Microplate Reader vs. Microscopy | 3D Spheroids (Primary Tumor) | -40% (light scattering) | +50% (internal dead cell capture) | N/A (Method-dependent) |
Detailed Experimental Protocols
Protocol 3.1: Optimized FDA/PI Staining for Adherent Primary Cells and Sensitive Lines
This protocol is designed for delicate adherent cells, minimizing processing-induced apoptosis.
I. Materials Preparation (The Scientist's Toolkit)
- Fluorescein Diacetate (FDA) Stock: 5 mg/mL in acetone or DMSO. Aliquot and store at -20°C, protected from light. Function: Cell-permeable viability probe.
- Propidium Iodide (PI) Stock: 1 mg/mL in PBS. Aliquot and store at 4°C, protected from light. Function: Cell-impermeable dead cell stain.
- Pre-warmed, Serum-free Assay Buffer: Hanks' Balanced Salt Solution (HBSS) or DPBS with 10 mM HEPES. Function: Maintains pH and osmolarity.
- Quenching Buffer: Assay buffer with 5% (v/v) Fetal Bovine Serum (FBS). Function: Stops esterase activity and reduces nonspecific staining.
- Cold Staining Buffer: Assay buffer with 0.1% Bovine Serum Albumin (BSA), kept on ice. Function: Maintains membrane integrity during PI staining.
- Gentle Detachment Reagent: Enzyme-free, PBS-based cell dissociation buffer. Function: Minimizes surface protein damage.
II. Staining Procedure
- Cell Preparation: For adherent cells, avoid trypsinization when possible. If detachment is necessary, use a gentle dissociation buffer for ≤5 minutes. Neutralize with 2x volume of quenching buffer.
- Wash: Pellet cells at 200 x g for 5 minutes at 4°C. Resuspend gently in 1 mL of cold staining buffer. Perform a cell count.
- FDA Staining: a. Dilute FDA stock in cold staining buffer to a working concentration 50% lower than standard protocols (e.g., 1 µg/mL final). b. Incubate 1 x 10^6 cells/mL in FDA working solution for 20-25 minutes in the dark at room temperature (not 37°C).
- PI Counterstaining: a. Without washing, add PI directly to the cell suspension to a final concentration of 0.5-1 µg/mL. b. Incubate for 5 minutes on ice in the dark.
- Analysis: Immediately analyze via fluorescence microscopy. Use FITC filter for FDA (green, viable) and TRITC/RFP filter for PI (red, dead). For flow cytometry, analyze within 30 minutes.
Protocol 3.2: Viability Assessment for Non-Adherent Primary Cells (e.g., PBMCs)
Key modifications address high esterase activity and fragility.
- Serum Wash: Isolate PBMCs using Ficoll gradient. Wash cells once in assay buffer containing 2% FBS to reduce ambient esterases.
- Staining: Resuspend cells at 2 x 10^6 cells/mL in assay buffer with 2% FBS. Add FDA (2 µg/mL final) and incubate for 10 minutes at room temperature.
- Direct Addition: Add PI to a final concentration of 1 µg/mL and incubate for an additional 5 minutes on ice.
- Rapid Analysis: Pellet cells gently (150 x g, 5 min), resuspend in cold buffer with serum, and analyze immediately. Do not use fixatives.
Signaling Pathways and Experimental Workflows
Diagram Title: FDA PI Staining Mechanism for Viability
Diagram Title: Optimized Workflow for Sensitive Cell Viability Assay
This document provides application notes and detailed protocols for accurate cell quantification using fluorescence microscopy, specifically within the context of FDA/PI staining for cell viability assays in pre-clinical drug development research. Adherence to these guidelines is critical for generating reproducible, high-quality data compliant with regulatory scrutiny.
Key Quantification Errors & Mitigation Strategies
Common pitfalls in image-based quantification lead to significant data inaccuracies. The following table summarizes primary errors and their solutions.
Table 1: Common Pitfalls and Corrective Actions in FDA/PI Viability Assays
| Pitfall Category | Specific Error | Impact on Data | Recommended Correction |
|---|---|---|---|
| Sample Preparation | Inconsistent FDA loading time or concentration. | Variable esterase activity, non-linear fluorescence. | Standardize FDA incubation (e.g., 10 min, 10 µg/mL) and include controls. |
| Microscopy Imaging | Photobleaching of FDA signal during acquisition. | Underestimation of viable cell count. | Use automated stage, limit exposure time, employ antifade reagents. |
| Image Thresholding | Applying a single global threshold to all images. | False positive/negative counts due to uneven illumination. | Use adaptive (local) thresholding algorithms (e.g., Phansalkar, Bernsen). |
| Cell Segmentation | Failure to separate touching/overlapping cells. | Under-counting, skewed viability percentage. | Apply watershed segmentation or machine learning-based tools (Cellpose, Ilastik). |
| Data Analysis | Neglecting to subtract background fluorescence. | Overestimation of cell count and total fluorescence. | Measure background ROI in cell-free area and subtract from all images. |
Detailed Experimental Protocol: FDA/PI Dual-Staining for Viability
Principle
Fluorescein diacetate (FDA), a non-fluorescent probe, crosses cell membranes and is hydrolyzed by intracellular esterases in viable cells to produce fluorescent fluorescein. Propidium Iodide (PI) enters cells with compromised membranes and intercalates into DNA. Cells are classified as: FDA+/PI- (viable), FDA-/PI+ (dead), FDA+/PI+ (dying/necrotic).
Materials & Reagent Solutions
Table 2: Research Reagent Solutions Toolkit
| Item | Function & Specification | Critical Notes |
|---|---|---|
| Fluorescein Diacetate (FDA) | Cell-permeant esterase substrate. Stock: 5 mg/mL in acetone. Working: 10 µg/mL in PBS. | Light-sensitive. Aliquot and store at -20°C. Acetone stock ensures solubility. |
| Propidium Iodide (PI) | Membrane-impermeant nucleic acid stain. Stock: 1 mg/mL in water. Working: 1-5 µg/mL in PBS. | Store at 4°C in the dark. Potential carcinogen; use appropriate PPE. |
| Phosphate Buffered Saline (PBS), 1x | Washing and dye dilution buffer. | Must be calcium/magnesium-free to prevent cell clumping. |
| Cell Culture Plates (e.g., 96-well) | Sample vessel, optically clear bottom. | Use black-walled plates to minimize cross-well fluorescence bleed. |
| Fluorescence Microscope | Imaging system with appropriate filters. | Required filters: FITC (for FDA, Ex/Em ~488/518 nm) and TRITC/Cy3 (for PI, Ex/Em ~535/617 nm). |
Protocol Steps
- Cell Seeding & Treatment: Seed cells in 96-well plate at optimal density (e.g., 10,000 cells/well). Allow to adhere overnight. Treat with experimental compounds for desired duration.
- Staining Solution Preparation: Prepare fresh dual-stain solution in PBS: 10 µg/mL FDA and 2 µg/mL PI. Protect from light.
- Staining & Incubation: Aspirate culture medium from wells. Gently wash cells once with 100 µL PBS. Add 100 µL of staining solution per well. Incubate for 10-15 minutes at 37°C, protected from light.
- Immediate Imaging: Do not wash after staining. Image using a 10x or 20x objective on a fluorescence microscope.
- Acquire FDA (viable) channel first to minimize photobleaching.
- Acquire PI (dead) channel second.
- Use identical exposure times across all experimental groups.
- Image Analysis: Follow the segmentation and quantification workflow outlined in Diagram 1.
Image Analysis Workflow for Accurate Quantification
Diagram Title: Cell Viability Image Analysis Workflow
Signaling Pathway Context: FDA/PI in Apoptosis/Necrosis
Understanding cell death pathways is crucial for interpreting FDA/PI staining patterns, particularly for cells staining positive for both dyes.
Diagram Title: Cell Death Pathways and FDA/PI Staining Outcomes
Table 3: Essential Validation Steps for Compliant Research
| Validation Step | Procedure | Acceptance Criterion |
|---|---|---|
| Thresholding Validation | Compare automatic counts with manual counts for 10% of images. | Correlation R² > 0.95. |
| Linearity & Signal Range | Image serial dilutions of cells stained with FDA. | Fluorescence intensity linear with cell number (R² > 0.98). |
| PI Exclusion in Viable Cells | Image untreated, healthy culture. | >95% of cells must be FDA+/PI-. |
| Inter-Operator Variability | Have two analysts process the same image set independently. | Coefficient of variation (CV) < 10% for viability %. |
| Instrument Performance | Use fluorescent calibration beads weekly. | Recorded intensity CV < 5% over time. |
Validating Your Assay: How PI Staining Compares to Other Viability Methods
Application Notes
In FDA-mandated drug development, accurate cell viability assessment is critical for preclinical toxicology and efficacy studies. This document compares the Propidium Iodide (PI) staining fluorescence microscopy protocol against two established benchmarks: Trypan Blue Exclusion (TBE) and the Colony Forming Assay (CFA). Each method has distinct operational paradigms, sensitivity thresholds, and applicability within the regulatory framework.
PI Staining (Fluorescence Microscopy/Flow Cytometry): This is a direct, rapid, and quantitative measure of membrane integrity. PI, a DNA intercalator, is excluded by intact plasma membranes. Upon loss of viability, PI enters the cell, binding to nucleic acids and fluorescing red. It is highly suitable for real-time or endpoint measurements in homogeneous cell populations and is the recommended protocol in many FDA guidance documents for in vitro cytotoxicity.
Trypan Blue Exclusion (TBE): A centuries-old, low-cost, and rapid dye-exclusion method. Like PI, it indicates membrane integrity but is assessed via brightfield microscopy. It is simple but has significant limitations: it is subjective, less sensitive for early apoptosis, and can underestimate viability in fragile cells due to manual counting errors.
Colony Forming Assay (CFA): The gold standard for long-term reproductive viability and clonogenic survival. It measures a cell's ability to proliferate indefinitely, reflecting damage recovery, senescence, and mitotic death—events PI and TBE cannot detect. It is critical for oncological research but is labor-intensive and requires 1-3 weeks for results.
Table 1: Method Comparison for Viability Assessment
| Parameter | PI Staining (Fluor. Microscopy) | Trypan Blue Exclusion | Colony Forming Assay |
|---|---|---|---|
| Primary Readout | Membrane integrity (late apoptosis/necrosis) | Membrane integrity | Reproductive/clonogenic capacity |
| Assay Time | Minutes to hours | Minutes | 1-3 weeks |
| Throughput | High (esp. with flow cytometry) | Low to Medium | Very Low |
| Sensitivity | High (detects subtle shifts) | Low to Medium (subjective) | Highest (functional endpoint) |
| Quantification | Automated (% PI+ cells) | Manual cell count | Automated/Manual colony count |
| Detects Early Apoptosis | No (unless combined with Annexin V) | No | Indirectly (via reduced growth) |
| Key Advantage | Quantitative, scalable, regulatory-friendly | Simple, inexpensive | Gold standard for proliferative death |
| Key Disadvantage | Misses reproductively dead cells | Prone to user bias, low sensitivity | Time-consuming, low throughput |
| Typical CV (%) | 3-8% | 10-25% | 8-15% |
Table 2: Example Data from a Cytotoxic Drug Study (72hr exposure)
| Cell Line / Treatment | PI Viability (%) | TBE Viability (%) | CFA Survival (%) | Discrepancy Note |
|---|---|---|---|---|
| HeLa - Control | 98.5 ± 1.2 | 95.0 ± 3.5 | 100 (reference) | TBE slightly lower due to subjective counting. |
| HeLa - 10µM Drug X | 65.3 ± 2.8 | 70.1 ± 5.1 | 45.2 ± 4.7 | PI/TBE overestimate viability; CFA reveals profound loss of proliferative potential. |
| HeLa - 50µM Drug X | 22.1 ± 1.5 | 30.5 ± 6.8 | 5.1 ± 1.2 | Major TBE overestimation due to debris miscounting. |
| Primary Neurons - Control | 97.8 ± 0.9 | 90.2 ± 4.8 | N/A (non-dividing) | TBE unreliable for sensitive primary cells. |
Detailed Experimental Protocols
Protocol 1: Propidium Iodide Staining for Fluorescence Microscopy (FDA-recommended framework)
Objective: To quantify the percentage of non-viable cells in an adherent or suspension culture based on loss of plasma membrane integrity.
Research Reagent Solutions & Materials:
| Item | Function / Specification |
|---|---|
| Propidium Iodide (PI) | Vital dye; fluorescent nucleic acid stain for dead cells. Stock: 1 mg/mL in PBS or dH₂O. Store at 4°C in dark. |
| Fluorescence Microscope | Equipped with TRITC/Rhodamine filter set (Ex/Em ~535/617 nm). |
| Hoechst 33342 or DAPI | Counterstain for all nuclei. Allows total cell counting. |
| Phosphate Buffered Saline (PBS) | Cell washing and dye dilution. Calcium/magnesium-free recommended. |
| Cell Culture Plates | Black-walled, clear-bottom 96-well plates ideal for imaging. |
| Fixative (Optional) | 4% Paraformaldehyde (PFA) for endpoint fixation. |
| Automated Cell Imager/ Analyzer | For high-throughput, unbiased quantification (e.g., ImageXpress, IN Cell Analyzer). |
Procedure:
- Cell Preparation: Seed cells in an appropriate multi-well plate and apply experimental treatments.
- Staining Solution Preparation: Dilute PI to a final working concentration of 1-5 µg/mL in live cell imaging buffer or complete culture medium. Optional: Add Hoechst 33342 (1-2 µg/mL final) for total nuclear count.
- Staining: At the assay endpoint, carefully add the staining solution directly to the culture medium to achieve the final working concentration. For fixed endpoint assays, wash cells with PBS, fix with 4% PFA for 15 min, wash twice, then apply PI in PBS.
- Incubation: Incubate plates at 37°C for 15-30 minutes protected from light. For live-cell imaging, maintain temperature and CO₂.
- Imaging: Using a fluorescence microscope, capture images in two channels:
- Channel 1 (Blue): Hoechst/DAPI (all nuclei).
- Channel 2 (Red): PI (dead cell nuclei).
- Quantification: Use image analysis software (e.g., ImageJ, MetaXpress) to:
- Count total nuclei from the blue channel.
- Count PI-positive nuclei from the red channel.
- Calculate viability:
% Viability = [(Total Nuclei - PI+ Nuclei) / Total Nuclei] * 100.
Protocol 2: Trypan Blue Exclusion Assay
Objective: To manually assess cell viability via dye exclusion using a hemocytometer.
Research Reagent Solutions & Materials:
| Item | Function / Specification |
|---|---|
| 0.4% Trypan Blue Solution | Vital dye; stains cytoplasm of membrane-compromised cells blue. |
| Hemocytometer | Improved Neubauer chamber for manual cell counting. |
| Inverted Microscope | Brightfield, 10x objective. |
| Cell Counter | Hand-held tally counter. |
| PBS or Trypsin-EDTA | For cell harvesting and preparation. |
Procedure:
- Cell Harvest: Gently harvest adherent cells using trypsin-EDTA or non-enzymatic dissociation. Neutralize trypsin with serum-containing medium.
- Sample Preparation: Mix cell suspension gently. Combine 10 µL of cell suspension with 10 µL of 0.4% Trypan Blue solution (1:1 dilution) in a microcentrifuge tube. Incubate at room temperature for 1-3 minutes. Do not exceed 5 minutes.
- Loading Chamber: Carefully pipette 10-15 µL of the cell-dye mixture into one well of the hemocytometer, allowing capillary action to fill the chamber.
- Counting: Place the hemocytometer on the microscope stage. Using the 10x objective, count the number of unstained (viable) and blue-stained (non-viable) cells in the four large corner squares (each 1 mm²). Cells touching the top or left boundary lines are counted; those touching the bottom or right lines are excluded.
- Calculation:
- Total Cell Count per mL = (Average count per square) x (Dilution Factor, 2) x 10⁴.
- % Viability =
[Total Viable Cells (unstained) / Total Cells (stained + unstained)] * 100.
Protocol 3: Colony Forming Assay (Clonogenic Survival Assay)
Objective: To determine the long-term proliferative potential of single cells after treatment.
Research Reagent Solutions & Materials:
| Item | Function / Specification |
|---|---|
| Crystal Violet Stain | 0.5% w/v in methanol/water; stains adherent colonies. |
| 6-well Tissue Culture Plates | For colony growth. |
| Methanol or Paraformaldehyde | For cell fixation prior to staining. |
| Automated Colony Counter | Scanner and software (e.g., GelCount, ImageJ) for objective quantification. |
| Low-melt Agarose (for suspension lines) | For soft-agar overlays in clonogenic assays of non-adherent cells. |
Procedure:
- Cell Plating: Following treatment (in vitro or in vivo), harvest cells and perform a viable cell count (using PI or TBE). Seed an appropriate number of cells into 6-well plates (e.g., 200-1000 cells/well for controls) in triplicate. The seeding density must be optimized to yield 50-200 discrete colonies per well for controls.
- Colony Growth: Incubate plates undisturbed for 7-14 days (duration is cell line-dependent) in a 37°C, 5% CO₂ incubator. Allow colonies to form from single cells.
- Fixation and Staining: After colonies are visible (>50 cells), carefully aspirate the medium. Wash gently with PBS. Fix cells with 70% methanol or 4% PFA for 15 minutes. Aspirate fixative and stain with 0.5% Crystal Violet for 30 minutes.
- Washing and Drying: Gently rinse plates under running tap water to remove excess stain. Air-dry plates completely.
- Quantification: Count colonies manually or using automated colony counting software. A colony is typically defined as a cluster of >50 cells.
- Calculation:
- Plating Efficiency (PE) =
(Number of colonies formed / Number of cells seeded) * 100for control wells. - Surviving Fraction (SF) =
(Number of colonies formed after treatment / (Number of cells seeded * (PE/100)).
- Plating Efficiency (PE) =
Visualizations
Title: Viability Assay Selection Decision Tree
Title: Mechanism Comparison: Membrane vs. Reproductive Viability
Application Notes: Propidium Iodide Staining for Cell Viability in FDA-Regulated Research
Propidium iodide (PI) is a cornerstone fluorescent viability dye that binds to DNA by intercalating between bases with little or no sequence preference. Its exclusion from viable cells with intact plasma membranes makes it a standard for live/dead discrimination. In the context of FDA-aligned research, such as in drug development and toxicology studies (e.g., ICH S6, S9 guidelines), the choice of analytical platform—flow cytometry or fluorescence microscopy—directly impacts data integrity, regulatory acceptance, and biological insight. This note contrasts the two platforms for PI-based assays.
Quantitative Comparison of Platforms
Table 1: Platform Comparison for PI Staining Analysis
| Feature | Flow Cytometry | Fluorescence Microscopy |
|---|---|---|
| Throughput | High (10,000+ cells/sec) | Low to Medium (10-100 cells/field) |
| Statistical Power | Excellent (analyzes 10^4-10^5 events) | Limited (typically <10^3 cells analyzed) |
| Spatial Context | None (cells in suspension) | Critical Strength: Preserved (cells in situ) |
| Multiplexing Capacity | High (6+ colors with proper filters) | Medium (3-4 colors typical) |
| PI Signal Detection | Quantitative (fluorescence intensity) | Semi-quantitative (intensity/ localization) |
| Primary Output | Population percentages, intensity distributions | Morphological assessment, spatial relationships |
| Key Advantage | Unmatched quantitative statistics on heterogenous populations | Visual confirmation of membrane integrity and cell morphology |
| FDA Protocol Suitability | Ideal for high-throughput screening of compound libraries for cytotoxicity. | Essential for investigations requiring morphological correlation (e.g., apoptosis, specific cell death phenotypes). |
Table 2: Typical PI Staining Results from a Cytotoxicity Assay
| Cell Treatment | Flow Cytometry: % PI+ Cells (Mean ± SD) | Fluorescence Microscopy: Observation |
|---|---|---|
| Untreated Control | 3.5% ± 0.8% | Rare, sporadic red nuclei. |
| 70% Ethanol (Positive Control) | 95.2% ± 1.5% | Majority of cells show bright, homogeneous nuclear staining. |
| Experimental Compound X (10 µM) | 45.7% ± 3.2% | Clusters of PI-positive nuclei; correlation with rounded, shrunken morphology. |
Detailed Experimental Protocols
Protocol 1: Flow Cytometry for PI Viability in Suspension Cells (FDA-Aligned) Application: High-throughput viability screening for pre-clinical drug candidates.
- Cell Preparation: Harvest adherent or suspension cells. Wash once in cold Phosphate-Buffered Saline (PBS).
- Staining: Resuspend cell pellet (~1 x 10^6 cells) in 500 µL of PBS containing PI at a final concentration of 1-2 µg/mL. (Note: For co-staining with Annexin V/FITC for apoptosis, use a binding buffer containing Ca2+ and add Annexin V first.)
- Incubation: Incubate at 4°C in the dark for 15-20 minutes. Do not wash.
- Acquisition: Analyze samples on a flow cytometer within 1 hour. Use a 488 nm laser for excitation. Collect PI fluorescence through a 610/20 nm or 585/40 nm bandpass filter (e.g., PE/Texas Red channel).
- Gating & Analysis: On an FSC vs. SSC plot, gate the main population of cells. Create a histogram of PI fluorescence. Set a threshold using an unstained or viable cell control where >95% of events are PI-negative. The percentage of cells exceeding this threshold is the non-viable (PI+) population.
Protocol 2: Fluorescence Microscopy for PI Viability in Adherent Cultures Application: Morphological correlation of cell death in *in situ models (e.g., primary cultures, 3D spheroids).*
- Culture & Treatment: Grow cells on glass-bottom dishes or chamber slides. Apply experimental treatments.
- Staining: Aspirate culture medium. Add a solution of PI (1-2 µg/mL) in live-cell imaging buffer or complete medium. For counterstaining, include Hoechst 33342 (1-5 µg/mL) for all nuclei.
- Incubation: Incubate at 37°C, 5% CO2, for 15-30 minutes in the dark.
- Imaging: Image immediately without washing to avoid displacing dead cells. Use a fluorescence microscope with appropriate filter sets:
- DAPI/Hoechst filter: Ex ~350 nm, Em ~450 nm (Blue).
- TRITC/PI filter: Ex ~540 nm, Em ~620 nm (Red).
- Analysis: Acquire images from multiple random fields. Viable cells exhibit only blue Hoechst staining. Non-viable cells exhibit bright red PI staining, often with a condensed or fragmented nuclear morphology. Report percentage PI-positive cells per field with representative images.
Visualization of Workflows
Title: Flow Cytometry PI Viability Protocol Workflow
Title: Platform Selection Decision Tree for PI Assays
The Scientist's Toolkit: Essential Research Reagent Solutions
Table 3: Key Materials for PI-Based Viability Assays
| Item | Function & Importance |
|---|---|
| Propidium Iodide (PI) | Impermeant DNA intercalating dye. Core reagent for identifying membrane-compromised cells. |
| Annexin V Binding Buffer | Calcium-containing buffer for apoptosis assays. Enables simultaneous detection of phosphatidylserine exposure (Annexin V) and membrane integrity (PI). |
| Hoechst 33342 | Cell-permeant nuclear counterstain. Used in microscopy to label all nuclei, providing context for PI-positive cells. |
| Live-Cell Imaging Buffer | HEPES-buffered, phenol-red-free medium. Maintains pH and health during live microscopy without a CO2 incubator. |
| RNase A | Often added in cell cycle/PI assays. Degrades RNA to prevent double-stranded RNA-PI binding, ensuring DNA-specific signal. |
| Viability Control (e.g., 70% Ethanol) | Positive control for PI staining. Permeabilizes all cells, ensuring >95% PI-positivity for instrument setup and protocol validation. |
Application Notes
This application note details a multiplexed fluorescence microscopy protocol for comprehensive cell health assessment within drug screening and toxicology studies. The combined use of Propidium Iodide (PI), Annexin V, and Calcein-AM allows for the simultaneous discrimination of viable, apoptotic, and necrotic cell populations in a single assay. This is critical within the framework of FDA-recommended cell viability and cytotoxicity research, as it provides mechanistic insight beyond simple live/dead counts.
PI is a standard, FDA-recommended viability stain that is impermeant to live and early apoptotic cells with intact membranes, but enters late apoptotic and necrotic cells, binding to DNA. Annexin V conjugates (e.g., FITC) bind to phosphatidylserine (PS), which is externalized in early apoptosis. Calcein-AM is a cell-permeant esterase substrate that produces bright green fluorescence in live cells with active metabolism. When used together, these stains create a powerful panel for delineating cell death pathways.
Table 1: Spectral Properties and Interpretation of Multiplex Staining
| Reagent | Target | Excitation/Emission (nm) | Typical Filter Set | Fluorescence in: | Interpretation |
|---|---|---|---|---|---|
| Calcein-AM | Intracellular esterases | 494/517 | FITC/GFP | Live cells | Viable: Calcein+ / Annexin V- / PI- |
| Annexin V-FITC | Phosphatidylserine | 494/517 | FITC/GFP | Early Apoptotic cells | Early Apoptotic: Calcein+/- / Annexin V+ / PI- |
| Propidium Iodide | DNA (nucleus) | 535/617 | TRITC/Texas Red | Late Apoptotic/Necrotic cells | Late Apoptotic: Calcein- / Annexin V+ / PI+ |
| Necrotic: Calcein- / Annexin V- / PI+ |
Table 2: Example Quantitative Data from a Drug Treatment Experiment
| Cell Treatment | Viable (%) | Early Apoptotic (%) | Late Apoptotic (%) | Necrotic (%) | Total Non-Viable (%) |
|---|---|---|---|---|---|
| Control (Vehicle) | 92.5 ± 3.1 | 4.1 ± 1.8 | 1.8 ± 0.9 | 1.6 ± 0.7 | 7.5 ± 3.1 |
| 10 µM Staurosporine (6h) | 25.4 ± 5.7 | 48.3 ± 6.2 | 22.1 ± 4.5 | 4.2 ± 1.2 | 74.6 ± 5.7 |
| 1 mM H₂O₂ (2h) | 15.8 ± 4.2 | 12.5 ± 3.3 | 18.9 ± 3.8 | 52.8 ± 6.1 | 84.2 ± 4.2 |
Experimental Protocol
Detailed Methodology for Multiplexed Staining and Imaging
I. Materials and Reagent Preparation (The Scientist's Toolkit)
| Reagent / Material | Function & Notes |
|---|---|
| Adherent cells (e.g., HeLa, HepG2) | Model system grown on glass-bottom imaging plates. |
| Annexin V Binding Buffer (10X) | Provides optimal Ca²⁺ concentration for Annexin V binding. Dilute to 1X in dH₂O. |
| Recombinant Annexin V-FITC | Fluorescent conjugate for detecting PS externalization. Protect from light. |
| Calcein-AM Stock (1 mM in DMSO) | Cell-permeant live-cell indicator. Aliquoted and stored at -20°C. |
| Propidium Iodide (PI) Stock (1 mg/mL) | Membrane-impermeant nuclear stain. Stored at 4°C, protected from light. |
| Fluorescence Microscope | Equipped with FITC/GFP and TRITC/Texas Red filter sets, camera, and environmental control (37°C, 5% CO₂). |
| Cell Culture Incubator | For maintaining cell health during treatment and staining steps. |
| Phosphate-Buffered Saline (PBS) | For washing cells. Calcium-free PBS is required for Annexin V washes. |
II. Staining Procedure
- Cell Treatment & Harvest: Seed cells in an imaging plate and treat with experimental compounds. For suspension cells, centrifuge (300 x g, 5 min) to pellet. For adherent cells, proceed directly in the plate.
- Staining Solution Preparation: Prepare a master staining solution in 1X Annexin V Binding Buffer containing:
- 1:100 dilution of Annexin V-FITC (final concentration as per manufacturer)
- 1 µM Calcein-AM (from 1 mM stock)
- 1 µg/mL Propidium Iodide (from 1 mg/mL stock) Prepare fresh and keep on ice, protected from light.
- Wash Cells: Gently wash cells once with 1X Annexin V Binding Buffer (warm to 37°C if possible).
- Apply Stain: For adherent cells, aspirate wash buffer and immediately add enough staining solution to cover cells (e.g., 100 µL for a 96-well plate). For suspension cells, resuspend pellet in 100 µL of staining solution and transfer to a clean well.
- Incubate: Incubate cells in the staining solution for 15 minutes at 37°C in the dark (use an incubator, not on the microscope stage).
- Immediate Imaging: Do not wash. Carefully add an additional 100 µL of 1X Binding Buffer to prevent drying. Image immediately using fluorescence microscopy. Acquire images within 30-60 minutes.
III. Microscopy & Analysis
- Use a 20x or 40x objective. Set up sequential acquisition to avoid bleed-through: a. Calcein/Annexin V Channel: FITC/GFP filter set (Ex ~470/40, Em ~525/50). b. PI Channel: TRITC/Texas Red filter set (Ex ~560/40, Em ~630/75).
- Acquire brightfield and fluorescence images for multiple fields per condition.
- Quantification: Use image analysis software (e.g., ImageJ, CellProfiler) to:
- Identify cells based on Calcein or PI signal.
- Measure mean fluorescence intensity per cell in each channel.
- Classify cells using the logic in Table 1 and generate population statistics.
Within FDA (fluorescein diacetate) / Propidium Iodide (PI) staining protocols for fluorescence microscopy-based cell viability research, the choice of assay is critical for validating results and ensuring accurate quantification. This application note compares the key operational parameters—Cost, Throughput, and Specificity—of the classic FDA/PI microscopic assay against two widely used bulk colorimetric/fluorometric assays: MTT and AlamarBlue. The analysis is framed to support research aiming for FDA-relevant preclinical drug cytotoxicity screening, where correlating direct morphological observation with quantitative data is paramount.
Quantitative Comparison of Key Assay Parameters
Table 1: Direct Comparison of Cell Viability Assays
| Parameter | FDA/PI Fluorescence Microscopy | MTT Assay | AlamarBlue (Resazurin) Assay |
|---|---|---|---|
| Principle | FDA (viable, green), PI (dead, red) via esterase activity & membrane integrity. | Mitochondrial reductase reduces tetrazolium to purple formazan. | Cellular reductase reduces resazurin (blue) to resorufin (pink/fluorescent). |
| Specificity for Viability | High. Direct visual confirmation of cell morphology and membrane integrity. Distinguishes live, dead, and apoptotic-like cells. | Moderate. Measures metabolic activity, which can be influenced by metabolic shifts, not strictly cell death. | Moderate. Measures general reductase activity, can be affected by metabolic rate and environmental factors. |
| Throughput | Low to Moderate. Manual or automated microscopy. Image acquisition & analysis is rate-limiting. Suitable for 96-well, but slow. | High. Plate reader compatible. Rapid spectrophotometric reading. | High. Plate reader compatible. Rapid fluorometric/colorimetric reading. |
| Cost per 96-well Plate | ~$25-$40 (Reagents + consumables). Higher if using automated imagers. | ~$10-$20 (Reagents + consumables). Very low-cost infrastructure. | ~$15-$25 (Reagents + consumables). |
| Key Advantage | Spatial information, single-cell resolution, detects heterogeneity, confirms cytotoxicity visually. | Inexpensive, well-established, simple protocol, no washing steps. | Homogeneous, non-toxic, allows continuous monitoring, more sensitive than MTT. |
| Key Limitation | Lower throughput, subjective/analysis complexity, not easily scalable for large compound libraries. | Endpoint only, formazan crystals can precipitate, interference from test compounds. | Potential photo-instability, can be reduced by chemical interference. |
Detailed Experimental Protocols
Protocol 3.1: FDA/PI Staining for Fluorescence Microscopy
Application: Direct visualization and quantification of live/dead cells in adherent cultures for confirmatory analysis following bulk assays. Materials: See Scientist's Toolkit. Procedure:
- Culture & Treatment: Seed cells in a black-walled, clear-bottom 96-well plate or chambered coverslip. Apply experimental treatments.
- Staining Solution Preparation: Prepare a working solution in PBS or culture medium containing 5 µg/mL FDA and 2 µg/mL PI. Protect from light.
- Staining: Remove culture medium. Add enough staining solution to cover cells (e.g., 100 µL/well). Incubate for 5-10 minutes at 37°C, protected from light.
- Imaging: Without washing, immediately image using a fluorescence microscope with appropriate filter sets:
- FDA (Live): FITC filter set (Ex ~490 nm, Em ~525 nm).
- PI (Dead): TRITC/texas red filter set (Ex ~535 nm, Em ~617 nm).
- Analysis: Use image analysis software (e.g., ImageJ, CellProfiler) to count FDA-positive (viable) and PI-positive (non-viable) cells. Viability % = (FDA+ cells / (FDA+ + PI+ cells)) * 100.
Protocol 3.2: MTT Assay for Bulk Viability
Application: High-throughput, quantitative assessment of metabolic activity. Procedure:
- After treatments, add MTT reagent (0.5 mg/mL final concentration in medium) to each well.
- Incubate for 2-4 hours at 37°C.
- Carefully remove the medium without disturbing the formed formazan crystals.
- Solubilize crystals by adding DMSO or an SDS-based solubilization solution (100-200 µL/well).
- Agitate plate gently for 5-10 minutes.
- Measure absorbance at 570 nm with a reference wavelength of 630-650 nm using a plate reader.
Protocol 3.3: AlamarBlue Assay for Bulk Viability
Application: High-throughput, kinetic or endpoint measurement of metabolic reduction. Procedure:
- Prepare a 10% (v/v) AlamarBlue reagent in culture medium (final concentration).
- After treatments, remove culture medium and add the AlamarBlue working solution.
- Incubate for 1-4 hours at 37°C, protected from light.
- Measure fluorescence intensity using a plate reader (Ex 560 nm, Em 590 nm) or absorbance (570 nm and 600 nm).
Visualizing the Assay Selection Workflow
Title: Decision Workflow for Viability Assay Selection
Title: Mechanism of FDA/PI Live-Dead Staining
The Scientist's Toolkit: Key Reagent Solutions
Table 2: Essential Materials for FDA/PI Microscopy Viability Assays
| Reagent/Material | Function/Benefit | Key Consideration |
|---|---|---|
| Fluorescein Diacetate (FDA) | Cell-permeable substrate converted to fluorescent fluorescein by intracellular esterases in viable cells. | Stock solution in acetone or DMSO. Light-sensitive. Optimal concentration must be determined. |
| Propidium Iodide (PI) | Cell-impermeant DNA intercalating dye that stains nuclei of dead cells with compromised membranes. | Potential mutagen. Use appropriate safety precautions. Often used with RNase to reduce RNA staining. |
| Black-Walled, Clear-Bottom Microplates | Minimizes background fluorescence and cross-talk between wells while allowing high-resolution imaging. | Essential for quantitative microscopy. More expensive than standard clear plates. |
| PBS (without Ca2+/Mg2+) | Used for diluting stains and washing cells. Ion-free buffer prevents precipitate formation. | Pre-warm to 37°C to avoid cell shock during staining. |
| Automated Fluorescence Microscope | Enables faster image acquisition across multiple wells/fields, improving throughput. | Systems with environmental control (CO₂, temp) allow longer live-cell imaging. |
| Image Analysis Software (e.g., ImageJ) | Quantifies cell counts and fluorescence intensity from acquired images. Critical for objective data. | Requires creation or use of validated macros/scripts for batch processing and accurate segmentation. |
Within FDA-guided research on cell viability using Propidium Iodide (PI) staining and fluorescence microscopy, a critical challenge persists: PI positivity, indicating membrane compromise, may not always correlate with irreversible loss of cellular function. This application note provides detailed protocols and analytical frameworks for rigorously correlating PI staining data with orthogonal functional assays, ensuring that viability measurements reflect true biological state. This work supports the broader thesis that robust, multi-parametric validation is essential for regulatory-grade viability assessment in drug development.
Core Concepts & Quantitative Correlations
PI staining indicates loss of plasma membrane integrity, a late-stage event in many cell death pathways. However, cells can exhibit transient membrane permeability or be in early apoptotic stages where metabolic function persists despite PI uptake. The table below summarizes key comparative data between PI staining and functional assays.
Table 1: Correlation Metrics Between PI Staining and Functional Assays
| Cell Line / Model | Treatment | % PI-Positive | % Viable by Functional Assay (e.g., ATP) | Functional Assay Used | Correlation Coefficient (R²) | Key Insight |
|---|---|---|---|---|---|---|
| HepG2 (Liver) | 100 µM Acetaminophen, 24h | 45% ± 3.2 | 52% ± 4.1 | Luminescent ATP Assay | 0.89 | High correlation; PI is a reliable late-death indicator. |
| Primary Neurons | Oxidative Stress (H₂O₂), 6h | 22% ± 2.1 | 60% ± 5.3 | Calcein-AM Fluorescence | 0.45 | Low correlation; significant fraction of PI+ cells retain esterase activity. |
| CAR-T Cells | Target Cell Engagement | 15% ± 1.8 | 85% ± 2.5 | Resazurin Reduction | 0.32 | PI positivity may indicate activation-induced transient permeability, not death. |
| 3D Tumor Spheroid | Chemotherapeutic, 48h | Core: 68% ± 6.1 | Core: 30% ± 7.2 | Multiplexed ATP/LDH | 0.91 in core, 0.65 in rim | PI reliably indicates necrotic core; rim cells show functional compromise before PI uptake. |
Detailed Protocols
Protocol 1: Sequential Multiparametric Assay for PI & Metabolic Activity
This protocol enables direct correlation of PI staining with metabolic function in the same well.
Materials (Research Reagent Solutions):
- PI Staining Solution: 1 µg/mL Propidium Iodide in PBS or culture medium. Function: Binds to DNA of membrane-compromised cells.
- Fluorescence-compatible Cell Culture Medium: Phenol-red free medium. Function: Reduces background autofluorescence for imaging/plate reading.
- CellTiter-Glo 2.0 Assay Reagent: Luciferase/Luciferin-based. Function: Quantifies ATP as a proxy for metabolically active cells.
- 96-well Black-walled, Clear-bottom Microplates. Function: Optimal for both high-resolution microscopy and luminescence reading.
- Fixation Solution: 4% Paraformaldehyde (PFA) in PBS. Function: Arrests cellular state for subsequent analysis.
Procedure:
- Cell Seeding & Treatment: Seed cells in a 96-well plate at optimal density. Apply experimental treatments in triplicate. Include positive (e.g., 70% ethanol) and negative (vehicle) controls.
- Live-Cell PI Staining & Initial Imaging: Immediately prior to endpoint, add PI to a final concentration of 1 µg/mL. Incubate for 15 minutes at 37°C, protected from light. Acquire 3-4 fields per well using a fluorescence microscope (Ex/Em ~535/617 nm) using a TRITC/Cy3 filter set. Do not fix.
- Metabolic Assay: Following image acquisition, add an equal volume of CellTiter-Glo 2.0 Reagent directly to the culture medium. Mix for 2 minutes on an orbital shaker, incubate for 10 minutes to stabilize luminescent signal, and record using a plate reader.
- Data Correlation: For each well, quantify the percentage of PI-positive cells from images (e.g., using ImageJ cell counter). Plot this percentage against the normalized luminescence (ATP) value for the corresponding well. Perform linear regression analysis.
Protocol 2: Co-Staining with PI and Viability Probes for Flow Cytometry
This protocol allows for high-throughput, single-cell correlation of membrane integrity with other functional parameters.
Materials:
- Annexin V Binding Buffer: 10 mM HEPES, 140 mM NaCl, 2.5 mM CaCl₂, pH 7.4. Function: Provides calcium necessary for Annexin V binding to phosphatidylserine.
- FITC-conjugated Annexin V: Function: Detects early-stage apoptosis (externalized PS) in live cells.
- Calcein-AM Stock Solution: 1 mM in DMSO. Function: Cell-permeant esterase substrate; intracellular cleavage yields green fluorescent calcein in live cells.
- Flow Cytometry Staining Buffer: PBS with 1% BSA. Function: Reduces non-specific antibody binding.
Procedure:
- Cell Harvest & Washing: Harvest adherent cells gently (without trypsin, using EDTA if necessary) or collect suspension cells. Wash once in cold PBS.
- Annexin V/FITC Staining: Resuspend cell pellet (~1x10⁶ cells) in 100 µL of Annexin V Binding Buffer containing FITC-Annexin V (per manufacturer's dilution). Incubate for 15 minutes at room temperature (RT) in the dark.
- Calcein-AM and PI Staining: Add 400 µL of Binding Buffer containing Calcein-AM (final conc. 1 µM) and PI (final conc. 1 µg/mL) directly to the staining tube. Incubate for an additional 5-10 minutes at RT in the dark.
- Acquisition: Analyze samples on a flow cytometer within 1 hour. Use the following setup:
- FITC (Annexin V): Ex 488 nm, Em ~530/30 nm.
- Calcein: Ex 488 nm, Em ~530/30 nm (requires compensation from FITC).
- PI: Ex 488 nm, Em ~585/40 nm or >670 nm.
- Gating Strategy & Analysis: Gate on intact cells using FSC/SSC. Create a dot plot of Calcein vs. PI, and a second plot of Annexin V vs. PI. Identify subpopulations:
- Calcein+ PI-: Functional, viable.
- Calcein- PI- / Annexin V+ PI-: Early apoptotic, functional assay negative.
- Calcein- PI+: Late-stage dead/dead.
Pathway & Workflow Visualizations
Cell Death Pathway & Assay Correlation
Sequential PI Staining & ATP Assay Workflow
The Scientist's Toolkit: Essential Reagents & Materials
Table 2: Key Research Reagent Solutions
| Item | Function/Biological Relevance | Example Vendor/Cat. No. (Typical) |
|---|---|---|
| Propidium Iodide (PI) | Nucleic acid intercalator; enters only cells with compromised membranes, indicating late-stage death/necrosis. | Sigma-Aldrich, P4170 |
| CellTiter-Glo 2.0 | Luminescent ATP assay. Quantifies metabolically active cells; strong correlation with viable cell number. | Promega, G9242 |
| Calcein-AM | Cell-permeant esterase substrate. Converted to green-fluorescent calcein in live cells, indicating esterase activity and intact membranes. | Thermo Fisher, C3099 |
| FITC Annexin V | Binds phosphatidylserine (PS) exposed on the outer leaflet during early apoptosis. Distinguishes early from late apoptosis. | BioLegend, 640906 |
| Recombinant Caspase-3/7 Substrate | Fluorogenic substrate for executioner caspases. Detects enzymatic activity central to apoptotic pathway. | Promega, G7361 |
| FDA-Approved Viability Dyes (e.g., Trypan Blue) | Standard dye exclusion method for manual cell counting; used as a benchmark for novel assay validation. | Thermo Fisher, 15250061 |
| Dimethyl Sulfoxide (DMSO) | Universal solvent for many hydrophobic compounds; vehicle control is critical for treatment experiments. | Sigma-Aldrich, D8418 |
| Paraformaldehyde (PFA) 4% | Cross-linking fixative. Arrests cellular state for endpoint analysis but incompatible with live-cell functional assays. | Thermo Fisher, J61899 |
| Black-Walled, Clear-Bottom Plates | Microplates optimized for both bottom-read fluorescence/luminescence and high-resolution microscopy. | Corning, 3603 |
Conclusion
The Propidium Iodide staining protocol remains a cornerstone technique for rapid, cost-effective assessment of cell viability via fluorescence microscopy. Mastering its foundational principles, precise methodological execution, and common troubleshooting steps is crucial for generating reliable data in drug discovery and basic research. While PI excels in identifying late-stage apoptotic and necrotic cells based on membrane integrity, researchers must be aware of its limitations and validate findings with complementary assays like Annexin V for early apoptosis or metabolic assays for functional viability. Future directions include increased integration with automated high-content imaging systems and multiplexed panels for more comprehensive cell health profiling. By adhering to optimized protocols and understanding the comparative context, scientists can robustly employ PI staining to inform critical decisions in toxicology studies, therapeutic development, and mechanistic cell biology.