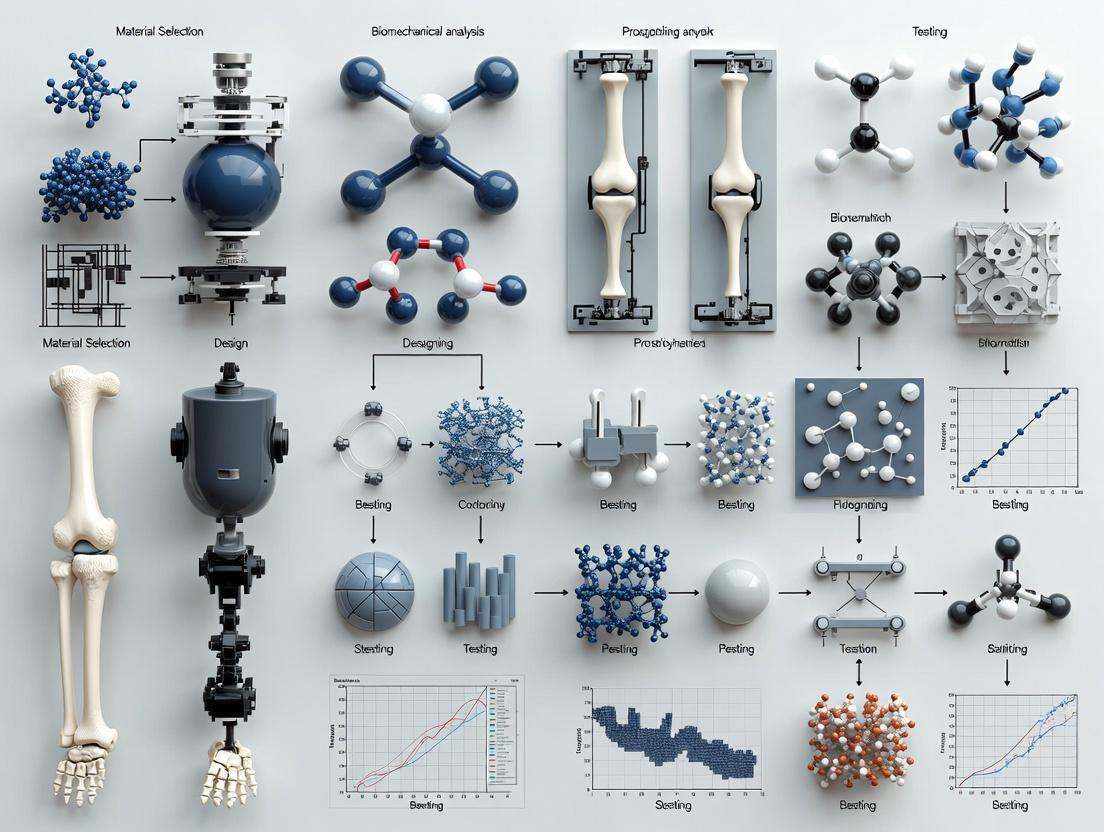
The Next Frontier in Biomedical Engineering: Advanced Prosthetics and Implants Design for Enhanced Function and Integration
This comprehensive review explores the cutting-edge landscape of prosthetic and implant design, tailored for researchers and development professionals.
The Next Frontier in Biomedical Engineering: Advanced Prosthetics and Implants Design for Enhanced Function and Integration
Abstract
This comprehensive review explores the cutting-edge landscape of prosthetic and implant design, tailored for researchers and development professionals. We cover foundational principles of biomechanics and biocompatibility, delve into advanced methodologies like additive manufacturing and smart materials, address critical challenges in device optimization and failure mitigation, and evaluate validation frameworks through comparative analysis. The article provides a holistic view of current capabilities and future trajectories in restoring and augmenting human function.
From Concept to Canvas: Foundational Principles and Emerging Paradigms in Prosthetic-Implant Design
Scope and Clinical Targets
The modern prosthesis or implant is an engineered device designed to replace, support, or augment a missing or dysfunctional biological structure. Its scope extends beyond mechanical substitution to include integration with host physiology, controlled interaction with biological tissues, and, increasingly, the delivery of therapeutic agents. The primary clinical targets are restoration of function, improvement of quality of life, and mitigation of disease progression.
Table 1: Key Clinical Targets and Associated Device Classes
| Clinical Target | Exemplary Conditions | Device Class | Key Performance Metrics |
|---|---|---|---|
| Structural Replacement & Load-Bearing | Osteoarthritis, Traumatic Fracture, Congenital Defects | Orthopedic Implants (Hip/Knee), Craniofacial Plates | Fatigue Life (>10^7 cycles), Elastic Modulus (≈ Bone), Osseointegration Strength (>15 MPa) |
| Cardiovascular Function | Coronary Artery Disease, Arrhythmias, Valvular Disorders | Stents, Pacemakers, Heart Valves | Patency Rate (≥95% at 1 yr), Thrombogenicity, Hemocompatibility, Cycle Durability (>500M cycles) |
| Neural Interfacing & Sensory Restoration | Limb Loss, Spinal Cord Injury, Parkinson's, Hearing Loss | Myoelectric Prostheses, Deep Brain Stimulators, Cochlear Implants | Signal-to-Noise Ratio (>20 dB), Electrode Impedance (<1 kΩ), Spatial Resolution (<100 μm) |
| Soft Tissue Reconstruction & Drug Delivery | Breast Cancer, Diabetes, Chronic Wounds | Tissue Expanders, Drug-Eluting Implants, Biosensors | Biocompatibility (ISO 10993), Drug Release Kinetics (Zero-Order), Glucose Sensitivity (>5 nA/mM) |
| Ophthalmic & Dental Restoration | Cataracts, Periodontitis, Edentulism | Intraocular Lenses, Dental Implants, Bone Graft Substitutes | Visual Acuity (20/20), Implant Survival Rate (>95% at 10 yrs), Push-out Force (>50 N) |
Classification Framework
Modern devices are classified across multiple, often overlapping, axes based on their fundamental characteristics and intended interaction with the host.
Table 2: Multi-Axial Classification of Modern Prostheses & Implants
| Classification Axis | Categories | Key Distinguishing Features |
|---|---|---|
| Biological Interaction | Bioinert, Bioactive, Biodegradable, Biologically Functional | Degree of intended biological response; from passive encapsulation to active remodeling or resorption. |
| Technological Integration | Passive, Electro-Mechanical, Smart/Sensing, Robotic/AI-Enhanced | Level of embedded intelligence, sensing, and actuation capabilities. |
| Material Composition | Metallic (Ti, Co-Cr, Nitinol), Polymeric (PEEK, PLA, PEG), Ceramic (Alumina, Hydroxyapatite), Composite, Biologic | Primary material determines mechanical, degradation, and surface properties. |
| Therapeutic Role | Structural Replacement, Assistive, Diagnostic/Monitoring, Drug Delivery | Primary clinical function, from load-bearing to therapeutic agent release. |
| Duration of Service | Temporary (Degradable Sutures), Permanent (Total Joint Replacement) | Intended indwell time, linked to material degradation profile. |
Application Notes & Experimental Protocols
Protocol:In VitroAssessment of Osseointegration Potential for Orthopedic Implants
Aim: To evaluate the early-stage osteogenic response of osteoblast-like cells to a novel implant surface coating.
Materials & Workflow:
- Surface Preparation: Sterilize test implants (coated vs. uncoated control) via autoclave or UV irradiation.
- Cell Seeding: Seed human osteosarcoma cell line (SaOS-2) or primary human osteoblasts at 10,000 cells/cm² onto implant surfaces in 24-well plates.
- Culture: Maintain in osteogenic medium (α-MEM, 10% FBS, 50 µg/mL ascorbic acid, 10 mM β-glycerophosphate, 10 nM dexamethasone) at 37°C, 5% CO₂ for up to 21 days.
- Endpoint Analysis:
- Day 4: Cell adhesion/proliferation (AlamarBlue assay).
- Day 14: Alkaline Phosphatase (ALP) activity (pNPP assay), normalized to total protein (BCA assay).
- Day 21: Matrix mineralization (Alizarin Red S staining), quantify by acetic acid extraction and spectrophotometry.
- Statistical Analysis: Perform one-way ANOVA with post-hoc Tukey test (n=6, p<0.05).
Diagram Title: In Vitro Osteogenic Bioactivity Assay Workflow
Protocol: Characterization of Drug Release Kinetics from a Polymeric Coating
Aim: To quantify the release profile of a model therapeutic (e.g., Dexamethasone) from a biodegradable polymer (e.g., PLGA) coating on a cardiovascular stent.
Materials & Workflow:
- Sample Preparation: Prepare coated stents (n=5) with known drug loading (e.g., 100 µg ± 5%).
- Release Study: Immerse each stent in 5.0 mL of phosphate-buffered saline (PBS, pH 7.4, 0.1% w/v sodium azide) in a sealed vial. Place in an orbital shaker (37°C, 60 rpm).
- Sampling: At predetermined intervals (1, 3, 6, 24, 48, 72, 168, 336 hours), remove and replace the entire release medium with fresh PBS.
- Quantification: Analyze collected samples via High-Performance Liquid Chromatography (HPLC) with UV detection. Use a C18 column, mobile phase of acetonitrile/water (40:60 v/v), flow rate 1.0 mL/min, detection at 242 nm.
- Modeling: Fit cumulative release data to mathematical models (Zero-order, Higuchi, Korsmeyer-Peppas) to determine release mechanisms.
Diagram Title: Drug Release Kinetics Characterization Protocol
Protocol: Electrochemical Impedance Spectroscopy (EIS) for Neural Electrode Characterization
Aim: To evaluate the stability and interfacial properties of a novel neural microelectrode array in vitro.
Materials & Workflow:
- Setup: Use a 3-electrode electrochemical cell in PBS (pH 7.4, 0.9% NaCl). Test electrode is working electrode (WE), Platinum wire is counter electrode (CE), Ag/AgCl (3M KCl) is reference electrode (RE).
- Instrumentation: Connect to a potentiostat capable of EIS.
- Measurement: Apply a sinusoidal potential perturbation with amplitude of 10 mV rms over a frequency range from 100 kHz to 0.1 Hz, at the open circuit potential.
- Pre-conditioning: Perform 1000 cycles of cyclic voltammetry (CV) from -0.6 V to 0.8 V vs. Ag/AgCl at 100 mV/s to simulate aging. Repeat EIS.
- Analysis: Fit EIS spectra to equivalent circuit models (e.g., Randles circuit) to extract parameters like charge transfer resistance (Rct) and double-layer capacitance (Cdl).
Table 3: Research Reagent Solutions Toolkit for Featured Protocols
| Reagent/Material | Function/Specification | Example Supplier/Cat. No. (for reference) |
|---|---|---|
| SaOS-2 Cell Line | Human osteoblast-like model for bone cell response studies. | ATCC HTB-85 |
| Osteogenic Differentiation Medium Kit | Provides consistent components (Ascorbate, β-Glycerophosphate, Dexamethasone) for inducing osteogenesis. | Merck, STEMPRO Osteogenesis Kit |
| Poly(D,L-lactide-co-glycolide) (PLGA) | Biodegradable polymer for controlled drug release coatings; various LA:GA ratios & molecular weights. | Evonik, RESOMER Series |
| Phosphate Buffered Saline (PBS), pH 7.4 | Isotonic, buffered solution for in vitro release studies and biological rinses. | Gibco, 10010023 |
| Electrochemical Impedance Spectrophotometer | Instrument for characterizing electrode-electrolyte interfaces. | GAMRY Instruments, Reference 600+ |
| Ag/AgCl Reference Electrode | Stable reference electrode for electrochemical measurements in physiological saline. | BASi, MF-2052 |
| AlamarBlue Cell Viability Reagent | Resazurin-based fluorometric/colorimetric indicator of metabolic activity. | Invitrogen, DAL1100 |
| p-Nitrophenyl Phosphate (pNPP) | Substrate for colorimetric assay of Alkaline Phosphatase (ALP) activity. | Sigma-Aldrich, N2770-100TAB |
Diagram Title: EIS Setup & Electrode Interface Equivalent Circuit
Core Biomechanical and Biocompatibility Imperatives for Long-Term Success
Within the broader thesis of biomedical engineering prosthetics and implants design research, achieving long-term clinical success requires a fundamental and synergistic reconciliation of core biomechanical and biocompatibility imperatives. This document presents application notes and protocols for key experimental methodologies to quantify and optimize these parameters for next-generation implant systems. The focus is on mitigating failure modes such as aseptic loosening, stress shielding, implant-associated inflammation, and biofilm formation.
Application Notes: Biomechanical Imperatives
Quantitative Analysis of Bone-Implant Micromotion
Excessive interfacial micromotion (>150 μm) promotes fibrous tissue encapsulation over direct osseointegration. Controlled micromotion (20-40 μm) can stimulate bone formation.
Key Experimental Data Summary: Table 1: Effect of Micromotion on Peri-Implant Tissue Formation
| Micromotion Range (μm) | Observed Tissue Phenotype | Typical Implant Fixation Outcome |
|---|---|---|
| 0 - 20 | Direct bone apposition | Stable osseointegration |
| 20 - 40 | Predominantly bone, some cartilage | Stable fibro-osseous integration |
| 40 - 150 | Fibrous tissue & cartilage | Unstable fibrous encapsulation |
| > 150 | Predominantly fibrous tissue | Failure (aseptic loosening) |
Assessment of Stress Shielding
Mismatch in elastic modulus between implant and bone leads to load transfer bypass, resulting in periprosthetic bone resorption (Wolff's law).
Key Experimental Data Summary: Table 2: Elastic Modulus of Common Biomaterials vs. Bone
| Material | Elastic Modulus (GPa) | Ratio to Cortical Bone Modulus (~18 GPa) |
|---|---|---|
| Cortical Bone | 15 - 20 | 1.0 |
| Titanium (Ti-6Al-4V) | 110 - 125 | ~6.5 |
| Co-Cr Alloy | 200 - 230 | ~12.0 |
| Stainless Steel 316L | 190 - 200 | ~11.0 |
| PEEK | 3 - 4 | ~0.2 |
| Porous Titanium | 2 - 15 | 0.1 - 0.8 |
Application Notes: Biocompatibility Imperatives
In Vitro Immunomodulation Assessment
The foreign body response (FBR) is a critical determinant of long-term integration. Assessing macrophage polarization (M1 pro-inflammatory vs. M2 pro-healing) is essential.
Key Experimental Data Summary: Table 3: Surface Property Impact on Macrophage Polarization
| Surface Characteristic | Typical Macrophage Polarization Trend | Key Cytokine Markers (Relative Expression) |
|---|---|---|
| Smooth, hydrophobic | M1 Dominant | TNF-α ↑, IL-1β ↑, IL-6 ↑ |
| Micro-rough (1-5 μm) | Mixed / M2 Shift | IL-10 ↑, TGF-β ↑ |
| Nano-topographic (<100 nm) | Significant M2 Shift | IL-10 ↑↑, TGF-β ↑↑, ARG1 ↑ |
| With Anti-inflammatory Coatings (e.g., IL-4) | Strong M2 Dominant | CD206 ↑↑, IL-10 ↑↑ |
Quantitative Biofilm Formation Assay
Bacterial adhesion and biofilm formation are leading causes of infectious failure.
Key Experimental Data Summary: Table 4: Efficacy of Surface Modifications Against S. aureus Biofilm
| Surface Modification | Log Reduction in Viable CFU (vs. Polished Ti) at 72h | % Reduction in Biomass (Crystal Violet) |
|---|---|---|
| Polished Ti (Control) | 0.0 | 0% |
| Silver Nanoparticle Coating | 2.5 - 3.5 | 70-85% |
| Quaternary Ammonium Polymer | 3.0 - 4.0 | 80-95% |
| Hydrophilic SLActive-like | 1.0 - 1.5 | 40-60% |
| Antimicrobial Peptide Coating | 3.5 - 4.5 | 90-99% |
Experimental Protocols
Protocol: Quantifying the Bone-Implant Interface via Histomorphometry
Objective: To measure the percentage of direct bone-to-implant contact (%BIC) and the bone area within peri-implant threads/roughness (%BA).
Materials:
- Explanted implant-bone segment (e.g., from sheep tibia or rat femur model).
- Exakt Cutting/Grinding System or equivalent for hard tissue sectioning.
- Methylmethacrylate (MMA) embedding resin.
- Toluidine Blue or Stevensel's Blue/Van Gieson Picrofuchsin stain.
- Light microscope with motorized stage and morphometry software (e.g., OsteoMeasure, ImageJ).
Methodology:
- Fixation & Embedding: Fix samples in 10% neutral buffered formalin for 72h. Dehydrate in graded ethanol series (70%-100%). Infiltrate and embed in MMA resin under vacuum.
- Sectioning: Using a diamond-coated blade, cut ~200 μm thick longitudinal sections along the implant axis. Grind and polish sections to a final thickness of 50-80 μm.
- Staining: Stain with Toluidine Blue for 5 min to distinguish mineralized bone (dark blue) from soft tissue (light blue).
- Image Acquisition & Analysis: Capture images along the entire implant perimeter at 100x magnification. Using morphometry software:
a. Trace the total length of the implant surface (
L_total). b. Trace the length where bone is in direct contact with the implant surface (L_contact). c. Calculate %BIC = (L_contact/L_total) x 100. d. For %BA, measure the total bone area within a defined region of interest (e.g., 500 μm from the implant surface).
Protocol: In Vitro Macrophage Polarization Assay on Biomaterials
Objective: To characterize the immunomodulatory potential of a biomaterial surface by analyzing macrophage phenotype markers.
Materials:
- THP-1 cell line or primary human monocyte-derived macrophages (hMDMs).
- PMA (Phorbol 12-myristate 13-acetate) for THP-1 differentiation.
- Test biomaterial coupons (Ø 12-14 mm) in 24-well plate format.
- LPS (Lipopolysaccharide) & IFN-γ (for M1 polarization), IL-4 & IL-13 (for M2 polarization).
- RNA extraction kit (e.g., RNeasy Mini Kit), cDNA synthesis kit, qPCR reagents.
- Antibodies for flow cytometry: CD86 (M1), CD206 (M2), CD80, CD163.
- ELISA kits for TNF-α, IL-1β, IL-6, IL-10, TGF-β.
Methodology:
- Macrophage Differentiation & Seeding: Differentiate THP-1 cells with 100 nM PMA for 48h on material surfaces. Wash. For hMDMs, isolate CD14+ monocytes and differentiate with 50 ng/mL M-CSF for 7 days.
- Stimulation: Incubate macrophages on materials for 24-72h. Include controls: Tissue Culture Plastic (TCP) M1 (LPS 100 ng/mL + IFN-γ 20 ng/mL) and TCP M2 (IL-4 20 ng/mL + IL-13 20 ng/mL).
- Gene Expression Analysis (qPCR): Lyse cells, extract RNA, synthesize cDNA. Perform qPCR for M1 markers (TNF, IL1B, IL6, CD80) and M2 markers (ARG1, IL10, TGFB, CD206, MRC1). Normalize to housekeeping genes (GAPDH, ACTB). Use the 2^(-ΔΔCt) method.
- Protein Secretion Analysis (ELISA): Collect supernatant. Perform ELISA according to manufacturer protocols.
- Surface Marker Analysis (Flow Cytometry): Detach cells (using gentle enzymatic/non-enzymatic methods), stain with fluorescent antibodies, and analyze on a flow cytometer.
Visualization: Signaling Pathways and Workflows
Diagram Title: Macrophage Polarization Pathways at the Implant Interface
Diagram Title: Workflow for Implant Biofilm Assessment
The Scientist's Toolkit: Research Reagent Solutions
Table 5: Essential Research Reagents for Implant Biocompatibility Studies
| Reagent / Material | Supplier Examples | Primary Function in Research Context |
|---|---|---|
| THP-1 Cell Line | ATCC, Sigma-Aldrich | Human monocyte model for standardized, reproducible macrophage differentiation and polarization studies on biomaterials. |
| Recombinant Human Cytokines (M-CSF, IL-4, IL-13, IFN-γ) | PeproTech, R&D Systems | For precise differentiation and polarization of primary macrophages or cell lines toward desired phenotypes (M1/M2). |
| LIVE/DEAD BacLight Bacterial Viability Kit | Thermo Fisher Scientific | Fluorescent staining to distinguish live (SYTO 9, green) vs. dead (propidium iodide, red) bacteria on implant surfaces via microscopy. |
| AlamarBlue / Cell Counting Kit-8 (CCK-8) | Thermo Fisher, Dojindo | Colorimetric or fluorometric assays for quantifying metabolic activity of cells adherent to material surfaces (cytocompatibility). |
| Osteogenic Differentiation Media BulletKit | Lonza | Standardized media supplement for in vitro differentiation of mesenchymal stem cells into osteoblasts on orthopedic implant materials. |
| MMA Embedding Kit for Hard Tissue | EXAKT Technologies, Sigma-Aldrich | Specialized resins and protocols for undecalcified histology of the metal-bone interface, preserving mineral content. |
| Quanti-iT PicoGreen dsDNA Assay Kit | Thermo Fisher Scientific | Highly sensitive fluorescent assay to quantify cell number/DNA content on porous or rough implant surfaces where direct counting is impossible. |
| Anti-human CD86 & CD206 Antibodies | BioLegend, BD Biosciences | Key surface markers for identifying M1 (CD86) and M2 (CD206) macrophage phenotypes via flow cytometry or immunofluorescence. |
Application Notes: Core Principles & Quantitative Benchmarks
Neural Integration focuses on creating a bidirectional communication link between the nervous system and a prosthetic device. Osseointegration provides the direct structural and functional connection between living bone and the surface of a load-bearing implant. The synergy of these interfaces is critical for next-generation prosthetics.
Table 1: Comparative Metrics for Neural & Osseointegration Interfaces
| Parameter | Neural Integration (Peripheral Nerve) | Osseointegration (Titanium Implant) |
|---|---|---|
| Primary Measurement | Signal-to-Noise Ratio (SNR) & Number of Independent Channels | Bone-Implant Contact (% BIC) & Removal Torque (Ncm) |
| Target Performance | SNR > 10:1; > 10 independently controllable motor/sensory channels | BIC > 70% at 12 weeks; Removal Torque > 60 Ncm |
| Key Material Property | Electrode Charge Injection Limit (μC/cm²) | Implant Surface Roughness (Sa, μm) & Hydrophilicity |
| Typical Time Scale | Chronic stability assessed over 6-36 months | Initial stability (weeks); Maturation (3-6 months) |
| Critical Pathway | Neurite outgrowth via PI3K/Akt & N-Cadherin signaling | Osteogenic differentiation via BMP-2/Smad/Runx2 |
Experimental Protocols
Protocol 2.1: In Vitro Assessment of Neural Interface Electrodes Objective: Quantify biocompatibility and neurite outgrowth on novel electrode coatings.
- Substrate Preparation: Sputter-coat platinum-iridium electrodes with PEDOT:PSS or control.
- Cell Culture: Plate rat PC12 cells or primary dorsal root ganglion (DRG) neurons at 10,000 cells/cm² in neurobasal medium.
- Differentiation: For PC12, add 50 ng/mL NGF. For DRGs, maintain in 2% B27 + 50 ng/mL NGF.
- Staining & Imaging: At Day 7, fix, permeabilize, and immunostain for β-III-Tubulin (neurites) and DAPI (nuclei).
- Quantification: Using ImageJ, analyze ≥5 fields/condition. Measure: (a) Neurite length/neuron, (b) Branching points.
Protocol 2.2: In Vivo Osseointegration Model in Rat Femur Objective: Evaluate the biomechanical and histological strength of novel implant surfaces.
- Implant Fabrication: Manufacture Grade 4 Ti6Al4V rods (1.5mm dia x 4mm length). Apply test surface treatment (e.g., SLA, hydrophilic).
- Surgical Implantation: Anesthetize rat. Create a bicortical defect in the distal femoral condyle. Press-fit the implant.
- Terminal Endpoints: At 4, 8, and 12 weeks post-op (n=6/group/time point):
- Biomechanics: Perform removal torque analysis using a digital torque gauge.
- Histomorphometry: Process bone in undecalcified sections. Stain with Toluidine Blue. Calculate %BIC using light microscopy.
Diagrams & Visualizations
Diagram Title: BMP-Smad Pathway in Osseointegration
Diagram Title: Prosthetic Interface R&D Workflow
The Scientist's Toolkit: Research Reagent Solutions
Table 2: Essential Reagents for Interface Research
| Reagent/Material | Supplier Examples | Function in Research |
|---|---|---|
| Poly(3,4-ethylenedioxythiophene):Poly(styrene sulfonate) (PEDOT:PSS) | Heraeus, Sigma-Aldrich | Conductive polymer coating for neural electrodes; lowers impedance, improves charge injection. |
| Recombinant Human BMP-2 | PeproTech, R&D Systems | Gold-standard growth factor to induce and study osteogenic differentiation in osseointegration models. |
| Anti-β-III-Tubulin Antibody | Abcam, Bio-Techne | Selective marker for neurons and neurites in immunofluorescence assays of neural integration. |
| Toluidine Blue O | Sigma-Aldrich, Electron Microscopy Sciences | Basic thiazine metachromatic dye for staining mineralized bone sections to quantify BIC. |
| Grade 4 or 5 Titanium Alloy (Ti6Al4V) Rods | Zimmer Biomet, ASTM Standard | Standard material for fabricating test implants in osseointegration studies. |
| Nerve Growth Factor (NGF), 7.0s | Alomone Labs, Invitrogen | Critical for the survival, development, and differentiation of sensory and sympathetic neurons in culture. |
Application Notes
Thesis Context: The evolution of biomaterials from passive, bio-inert components to dynamic, bio-interactive systems is central to next-generation prosthetics and implants in biomedical engineering. This progression enables devices that integrate with host biology, promote regeneration, and ultimately resorb, eliminating the need for permanent foreign bodies.
1. Bio-inert Materials: These materials, such as ultra-high-molecular-weight polyethylene (UHMWPE) or medical-grade titanium (Ti-6Al-4V), provide structural support without eliciting significant host response. Their primary application remains in permanent, load-bearing implants (e.g., total hip replacement acetabular cups, bone screws) where long-term mechanical stability is paramount.
2. Bio-active Materials: Designed to elicit a specific biological response, often the formation of a bond with living tissue. Bioactive glasses (e.g., 45S5) and hydroxyapatite (HA) coatings stimulate osteoconduction, critical for cementless orthopedic and dental implants. Surface functionalization of polymers with RGD peptide sequences is a strategy to enhance specific cell adhesion in soft tissue prosthetics.
3. Bio-resorbable Materials: These temporary scaffolds provide initial mechanical support and then gradually degrade, transferring load to regenerating tissue. Applications include poly(lactic-co-glycolic acid) (PLGA) sutures, magnesium (Mg) alloy coronary stents, and beta-tricalcium phosphate (β-TCP) bone void fillers. Degradation kinetics must be meticulously matched to the tissue healing timeline.
Table 1: Key Properties of Representative Biomaterial Classes
| Material Class | Example Material | Key Property 1 | Key Property 2 | Key Degradation/Stability | Primary Application in Prosthetics/Implants |
|---|---|---|---|---|---|
| Bio-inert Polymer | UHMWPE | Wear Rate: < 0.1 mm/year | Elastic Modulus: ~0.8 GPa | Non-degradable, stable | Articulating surfaces in joint replacements |
| Bio-inert Metal | Ti-6Al-4V ELI | Yield Strength: ~795 MPa | Fracture Toughness: ~115 MPa√m | Corrosion-resistant, non-degradable | Load-bearing stems, plates, dental implants |
| Bio-active Ceramic | 45S5 Bioglass | Bioactivity Index (I_B): >8 | Compressive Strength: ~500 MPa | Surface-controlled dissolution | Coatings for metal implants, dental bone grafts |
| Bio-resorbable Polymer | PLGA (50:50) | Degradation Time: ~1-2 months | Tensile Strength: ~40-60 MPa | Bulk hydrolysis | Sutures, drug-eluting scaffolds, membranes |
| Bio-resorbable Metal | Mg alloy (WE43) | Corrosion Rate: ~0.3 mm/year in vivo | Elastic Modulus: ~44 GPa (close to bone) | Aqueous corrosion | Temporary cardiovascular and orthopedic stents |
| Bio-resorbable Ceramic | β-TCP | Porosity: 60-70% | Compressive Strength: ~2-12 MPa | Osteoclast-mediated resorption | Bone graft substitutes, porous scaffolds |
Table 2: In Vitro Bioactivity Assessment of Materials (Simulated Body Fluid Test)
| Material | HA Layer Formation Time (Days) | Ca-P Layer Thickness (µm, Day 14) | Method of Detection | Implication for Osteoconduction |
|---|---|---|---|---|
| Ti-6Al-4V (polished) | >28 | Not detected | SEM-EDS | Bio-inert |
| Ti-6Al-4V with HA coating | 3-7 | 10-15 | SEM, XRD | Highly bioactive |
| 45S5 Bioglass | <1 | 20-30 | FTIR, TEM | Extremely bioactive |
| PLLA Polymer | >28 (or never) | Not detected | SEM-EDS | Bio-inert |
Experimental Protocols
Protocol 1: Assessing In Vitro Bioactivity via Simulated Body Fluid (SBF) Immersion
Objective: To evaluate the apatite-forming ability (bioactivity) of a material surface as per the classical test defined by Kokubo et al.
Materials: See "The Scientist's Toolkit" below.
Procedure:
- Sample Preparation: Cut material into discs (e.g., Ø10mm x 2mm). Polish sequentially to mirror finish. Clean ultrasonically in acetone, ethanol, and deionized water (10 min each). Dry in a 40°C oven.
- SBF Preparation: Prepare 1.0 L of SBF solution by dissolving reagent-grade chemicals into deionized water in the order listed in Table 1 of Kokubo's protocol (1990). Maintain solution at 36.5°C and adjust pH to 7.40 with Tris buffer and 1M HCl.
- Immersion Test: Place each sample in a sterile polystyrene container with 50 mL of pre-warmed SBF per cm² of sample surface area. Incubate at 36.5°C for predetermined periods (e.g., 1, 3, 7, 14 days) without agitation.
- Post-Immersion Analysis: a. Surface Morphology: Remove sample, rinse gently with DI water, dry. Analyze via Scanning Electron Microscopy (SEM). b. Surface Chemistry: Perform Energy-Dispersive X-ray Spectroscopy (EDS) on the same area to detect Ca and P peaks. c. Crystallography: Use Grazing-Incidence X-ray Diffraction (GI-XRD) or Fourier-Transform Infrared Spectroscopy (FTIR) to confirm hydroxyapatite crystallization.
- Quantification: Measure HA layer thickness from SEM cross-sections. Calculate Ca/P ratio from EDS spectra (stoichiometric HA is 1.67).
Protocol 2: Direct Cell Adhesion and Proliferation Assay on Novel Biomaterial Surfaces
Objective: To quantify the cytocompatibility and cell-supporting ability of a material using osteoblast precursor cells (e.g., MC3T3-E1).
Materials: Sterile test material discs, MC3T3-E1 cell line, α-MEM growth medium, fetal bovine serum (FBS), penicillin/streptomycin, phosphate-buffered saline (PBS), calcein AM/ethidium homodimer-1 live/dead stain, CCK-8 assay kit.
Procedure:
- Material Sterilization: Sterilize material discs via autoclave (if stable), UV exposure (30 min per side), or 70% ethanol immersion (20 min) followed by triple rinse in sterile PBS.
- Cell Seeding: Place discs in 24-well plate. Seed MC3T3-E1 cells at a density of 1 x 10⁴ cells/cm² in 500 µL of complete medium (α-MEM + 10% FBS + 1% P/S).
- Incubation: Culture at 37°C in a humidified 5% CO₂ incubator. Refresh medium every 48 hours.
- Assessment: a. Live/Dead Staining (Day 1, 3): Aspirate medium, rinse with PBS. Add calcein AM (2 µM) and ethidium homodimer-1 (4 µM) in PBS. Incubate 30 min in dark. Image using fluorescence microscope (488/515 nm for live, 528/617 nm for dead). b. Proliferation Assay (Day 1, 3, 7): Transfer discs to new well. Add 400 µL fresh medium and 40 µL CCK-8 reagent. Incubate for 2 hours. Transfer 100 µL of supernatant to a 96-well plate. Measure absorbance at 450 nm using a plate reader. Plot absorbance vs. time.
- Analysis: Calculate cell viability from live/dead images. Generate proliferation curves from CCK-8 data; compare slopes between material groups and control (tissue culture plastic).
Visualization
Diagram 1: Bioactive Implant Integration Pathway
Diagram 2: Bio-resorbable Material Design & Evaluation Workflow
The Scientist's Toolkit: Key Research Reagent Solutions
Table 3: Essential Materials for Biomaterial Bioactivity & Degradation Studies
| Item | Function & Application | Example Product/Specification |
|---|---|---|
| Simulated Body Fluid (SBF) Kit | Provides ions at concentrations nearly equal to human blood plasma for in vitro bioactivity and degradation testing. | Kokubo SBF recipe or commercial kits (e.g., Milli-Q prepared). |
| Cell Culture Medium (Osteogenic) | Supports growth and differentiation of bone-forming cells (osteoblasts) for cytocompatibility testing. | α-MEM supplemented with 10% FBS, 50 µg/mL ascorbic acid, 10 mM β-glycerophosphate. |
| Live/Dead Viability/Cytotoxicity Kit | Dual-fluorescence stain for simultaneous determination of live (green) and dead (red) cells on material surfaces. | Thermo Fisher Scientific, Catalog #L3224 (Calcein AM / EthD-1). |
| CCK-8 Assay Kit | Colorimetric assay for convenient and sensitive quantification of cell proliferation and viability. | Dojindo Molecular Technologies, Catalog #CK04. |
| Phosphate Buffered Saline (PBS), pH 7.4 | Isotonic buffer for rinsing cells and materials without causing osmotic shock. | 1x solution, sterile-filtered, without Ca²⁺/Mg²⁺. |
| Poly(lactic-co-glycolic acid) (PLGA) | Benchmark bio-resorbable polymer for control groups; tunable degradation rate by LA:GA ratio. | Lactel Labs, 50:50 molar ratio, inherent viscosity ~0.8 dL/g. |
| Medical Grade Titanium (Ti-6Al-4V) Discs | Bio-inert control material for comparative studies. | ASTM F136 standard, 10mm diameter, polished. |
| Hydroxyapatite (HA) Powder | Positive control for bioactivity studies; used for coating or as a comparative material. | Sigma-Aldrich, >97%, synthetic, particle size <5µm. |
Application Notes
Brain-Computer Interfaces (BCIs) for Motor Restoration
Application: High-density electrocorticography (ECoG) and intracortical microelectrode arrays are primarily used to decode motor intent from the motor cortex (M1) for controlling prosthetic limbs or computer cursors. Recent advancements focus on bidirectional interfaces that provide somatosensory feedback via intracortical microstimulation (ICMS) of the somatosensory cortex (S1).
Key Quantitative Performance Metrics (2023-2024):
Table 1: BCI Performance Metrics for Motor Decoding
| Metric | Invasive (Utah Array) | Semi-Invasive (ECoG) | Non-Invasive (EEG) |
|---|---|---|---|
| Spatial Resolution | 200-400 μm | 1-10 mm | 10-20 mm |
| Typical Channels | 96-128 | 32-256 | 16-128 |
| Information Transfer Rate (bits/min) | 200-350 | 100-200 | 20-100 |
| Decoding Accuracy (Point-and-Click) | 95-99% | 85-95% | 70-85% |
| Long-term Stability (>1 yr) | Moderate-High | High | High |
Powered Exoskeletons for Gait Rehabilitation
Application: These wearable robotic devices provide powered assistance at hip, knee, and ankle joints. Modern systems use a combination of surface electromyography (sEMG), inertial measurement units (IMUs), and mechanical force sensors to detect user intent and provide adaptive, compliant assistance.
Key Quantitative Performance Metrics (2023-2024):
Table 2: Clinical Efficacy of Powered Lower-Limb Exoskeletons
| Outcome Measure | Spinal Cord Injury (SCI) | Post-Stroke Hemiparesis |
|---|---|---|
| 10-Meter Walk Test Speed Increase | 0.15-0.25 m/s | 0.10-0.20 m/s |
| 6-Minute Walk Test Distance Increase | 30-80 m | 25-60 m |
| Metabolic Cost Reduction vs. No Exo | 15-25% | 10-20% |
| Typical Training Duration for Benefit | 12-24 sessions | 8-16 sessions |
| User Satisfaction (SUS Score) | 70-85 / 100 | 68-80 / 100 |
Bio-hybrid Systems and Organ-on-a-Chip
Application: Integration of living neural or muscle tissues with microelectrode arrays (MEAs) or microfluidic systems to create in vitro testbeds for neuroprosthetic interaction studies or drug screening. Neuromuscular junctions (NMJs) on chip are used to test interventions for motor neuron diseases.
Key Quantitative Performance Metrics (2023-2024):
Table 3: Bio-hybrid System Characterization
| System Type | Cell Viability Duration | Functional Readout | Throughput |
|---|---|---|---|
| Cortical Neurons on MEA | 60-180 days | Mean Firing Rate, Burst Detection | Low-Medium |
| NMJ-on-a-Chip | 14-28 days | Contraction Force (μN), MEPP Frequency | Low |
| Neurovascular Unit Chip | 10-30 days | TEER (Ω·cm²), Cytokine Secretion | Medium |
Experimental Protocols
Protocol: Closed-Loop BCI for Reaching & Grasping with Somatosensory Feedback
Aim: To assess the effect of ICMS-delivered tactile feedback on closed-loop BCI control of a robotic arm.
Materials: Non-human primate (NHP) or human participant with implanted Utah arrays in M1 and S1; 64-channel neural signal processor; robotic arm (6+ degrees of freedom); ICMS pulse generator; motion capture system.
Procedure:
- Neural Recording & Decoding Model Training:
- Have subject observe/perform reaching tasks. Record spike rates or local field potentials (LFPs) from M1.
- Use Kalman filter or deep neural network (e.g., CNN-LSTM) to map neural features to intended kinematic parameters (velocity, grip aperture). Train until R² > 0.85.
- Somatosensory Mapping:
- Deliver low-amplitude ICMS (e.g., 10-50 μA, 200 Hz, 100 ms pulse trains) to different S1 electrode pairs.
- Have subject report perceived location and quality (pressure, vibration). Create a map linking S1 electrodes to phantom finger/palm percepts.
- Closed-Loop Task:
- Subject controls robotic arm via BCI to reach and grasp objects of different stiffness (foam, rigid).
- Condition A (Feedback): Upon successful grasp, deliver ICMS to the S1 electrode corresponding to the robotic hand's tactile sensors.
- Condition B (No Feedback): No ICMS delivered.
- Quantification:
- Measure task completion time, success rate, and grip force precision across 100 trials per condition.
- Perform offline analysis of neural adaptation in M1 tuning properties.
Protocol: Evaluation of Adaptive Exoskeleton Control via sEMG & IMU Fusion
Aim: To compare gait symmetry and metabolic cost between fixed-assistance and adaptive, user-in-the-loop exoskeleton control paradigms.
Materials: Powered hip-knee exoskeleton; wireless sEMG system (8+ channels); IMU network; portable metabolic cart (VO2 mask); instrumented treadmill; motion capture (OptiTrack/Vicon).
Procedure:
- Subject Instrumentation & Baseline:
- Fit exoskeleton. Place sEMG electrodes on gluteus maximus, rectus femoris, biceps femoris, tibialis anterior.
- Attach IMUs to thigh, shank, and foot segments.
- Record baseline walking kinematics, muscle activity, and metabolic cost without exoskeleton power.
- Controller Calibration:
- Fixed Controller: Set to provide a torque profile based on average normative gait data.
- Adaptive Controller: Use real-time sEMG (envelope) and IMU (joint angle) data as input to a phase-dependent assistive torque algorithm (e.g., weighted sum, neural network). Calibrate during 5 mins of walking.
- Testing Protocol:
- Randomized block design. Each condition: 10-minute treadmill walking at self-selected speed.
- Continuously record kinematics, sEMG, exoskeleton torque, and metabolic data (VO2).
- Analysis:
- Calculate step length symmetry ratio, double support time symmetry.
- Compute net metabolic power from VO2 and VCO2. Compare across conditions using repeated-measures ANOVA.
Protocol: Functional Assessment of a 3D Neuromuscular Junction (NMJ) Bio-hybrid System
Aim: To characterize the formation and drug-induced dysfunction of NMJs in a 3D microfluidic chip co-culture.
Materials: PDMS microfluidic device with separate muscle and motor neuron chambers; primary human iPSC-derived motor neurons and myoblasts; multi-electrode array (MEA) plate; fluorescent calcium indicators (Fluo-4, R-CaMP); microelectrodes for field stimulation; contractile force sensor.
Procedure:
- Device Preparation & Seeding:
- Treat device with poly-D-lysine/laminin. Seed myoblasts in muscle chamber. Differentiate for 7 days to form aligned myotubes.
- Seed motor neurons in adjacent chamber, allowing axons to extend through microgrooves (3-5 days).
- Functional Validation:
- Neuronal Activity: Record spontaneous and evoked activity from motor neuron soma via MEA.
- Muscle Contraction: Image calcium transients in myotubes using live-cell microscopy upon neuronal stimulation.
- Measure baseline contraction force using embedded micropillars or optical tracking.
- Pharmacological Intervention:
- Perfuse compounds: (1) Agonist (e.g., Carbachol, 10 μM), (2) NMJ blocker (e.g., α-Bungarotoxin, 100 nM), (3) Investigational neuroprotective drug.
- For each, measure: MEA spike rate, latency from neural spike to muscle calcium transient, peak contractile force.
- Endpoint Analysis:
- Fix and immunostain for pre-synaptic (SV2, synaptophysin) and post-synaptic (acetylcholine receptor clusters with α-bungarotoxin-Alexa 555) markers.
- Quantify NMJ density and colocalization.
Diagrams (Graphviz DOT)
Title: BCI Closed-Loop with Sensory Feedback
Title: Adaptive Exoskeleton Control Workflow
Title: NMJ Bio-hybrid Chip Assay Workflow
The Scientist's Toolkit: Research Reagent Solutions
Table 4: Essential Research Reagents & Materials
| Item | Supplier Examples | Function in Research |
|---|---|---|
| Utah Array / Neuropixels Probe | Blackrock Microsystems, IMEC | High-density neural recording from cortex for BCI decoding. |
| Intracortical Microstimulation (ICMS) System | Tucker-Davis Technologies, Blackrock | Delivering precise electrical pulses to neural tissue for sensory feedback. |
| Wireless sEMG System (Delsys Trigno, Biometrics) | Delsys, Biometrics Ltd. | Measuring muscle activation intent for exoskeleton control. |
| iPSC-Derived Motor Neuron Kit | Fujifilm Cellular Dynamics, Axol Bioscience | Source of human neurons for bio-hybrid NMJ models. |
| iPSC-Derived Myoblast Kit | Thermo Fisher, ATCC | Source of human muscle cells for 3D tissue engineering. |
| Microelectrode Array (MEA) / Multiwell-MEA System | Axion Biosystems, Multi Channel Systems | Recording extracellular electrophysiology from neuronal networks. |
| PDMS Microfluidic Chips (for NMJ) | Emulate, AIM Biotech | Providing compartmentalized, perfusable environment for 3D co-culture. |
| Fluorescent Calcium Indicators (Fluo-4, Cal-520) | Thermo Fisher, AAT Bioquest | Visualizing neuronal and muscle cell activation dynamics. |
| α-Bungarotoxin, Alexa Fluor Conjugates | Thermo Fisher | Labeling and blocking post-synaptic acetylcholine receptors at NMJs. |
| Customizable Exoskeleton Actuator (Series Elastic Actuator) | Dephy Inc., Technaid | Providing compliant, powered joint assistance for gait studies. |
Building the Future: Methodological Breakthroughs and Application-Specific Design Strategies
Application Notes
Note 1: Integration of Topology Optimization and 3D Printing for Load-Bearing Implants The design of orthopedic implants (e.g., pelvic, spinal cages) requires a balance between mechanical strength and osseointegration potential. Topology optimization (TO) algorithms, using finite element analysis (FEA) of patient-specific CT data, generate minimal-mass structures that meet stress constraints. These complex, porous geometries are only manufacturable via metal additive manufacturing (AM), specifically Laser Powder Bed Fusion (L-PBF) of Ti-6Al-4V. Recent studies show TO-designed lattices can achieve a stiffness of 2.5-3.5 GPa, matching cortical bone, while porosity exceeding 70% facilitates bone ingrowth. A critical protocol is the post-print thermal stress relief and hot isostatic pressing (HIP) to eliminate internal defects and enhance fatigue life beyond 10⁷ cycles at physiological loads.
Note 2: 4D Printing of Stimuli-Responsive Cardiovascular Stents 4D printing involves fabricating objects with shape-memory or stimuli-responsive materials that transform post-production. For cardiovascular applications, patient-specific stents are printed from shape-memory polymer (SMP) formulations (e.g., poly(ε-caprolactone)-based networks). The 4D behavior is the self-expansion of the crimped stent at body temperature (T~37°C) or via magnetic actuation. Key parameters include the glass transition temperature (Tg) tuned to 32-35°C, recovery stress >0.5 MPa, and radial recovery ratio >95%. In-vitro hemodynamic testing demonstrates reduced deployment shear stress compared to balloon-expandable stents. The transformation is programmed during printing by controlling the crosslinking density via UV dose or thermal curing cycles.
Note 3: Patient-Specific Anatomical Modeling for Pre-Surgical Planning High-fidelity anatomical models derived from DICOM (MRI, CT) data are now standard for complex reconstructive surgery (e.g., mandibular reconstruction, cranioplasty). Segmentation and 3D reconstruction software generate stereolithography (STL) files used to print multi-material models. A 2023 multi-center study found that using patient-specific anatomical models reduced average operative time by 25.4% and intraoperative blood loss by 18.7% in complex orthopedic tumor resection cases. Models printed in transparent resin with embedded tumor analogs in colored resin provide unparalleled surgical roadmap visualization.
Note 4: Bioprinting of Vascularized Bone Grafts Advancing beyond inert implants, bioprinting aims to create living, patient-specific tissues. A protocolled approach involves a multi-material printhead: i) a cell-laden bioink (e.g., gelatin methacryloyl (GelMA) with human mesenchymal stem cells (hMSCs) and endothelial progenitor cells (EPCs)), and ii) a sacrificial bioink (e.g., Pluronic F127) to define perfusable channels. Post-printing, UV crosslinking stabilizes the structure, and the sacrificial ink is flushed, leaving patent channels. Under osteogenic media perfusion in a bioreactor, significant upregulation of Runx2 (>15-fold) and Osteocalcin (>8-fold) is observed at 21 days, with endothelial cells forming lumen-like structures, demonstrating early-stage vascularization.
Table 1: Comparative Mechanical Properties of AM Implant Materials
| Material | AM Process | Yield Strength (MPa) | Elastic Modulus (GPa) | Porosity (%) | Key Application |
|---|---|---|---|---|---|
| Ti-6Al-4V (ELI) | L-PBF | 950-1100 | 110-120 | 50-80 | Acetabular cups, vertebral bodies |
| Co-Cr-Mo Alloy | L-PBF | 900-1050 | 230-250 | 50-70 | Dental implants, knee prostheses |
| PEEK (Carbon-fiber) | FDM | 140-180 | 15-18 | Solid | Cranial implants, trauma fixation |
| β-Ti Alloy (Ti-Nb-Zr) | EBM | 550-700 | 60-65 | 60-75 | Load-sharing long bone implants |
| Shape Memory Polymer | PolyJet | 2-5 (at Tg) | 0.1-0.5 | N/A | Self-tightening suture anchors |
Table 2: Clinical Impact Metrics of Patient-Specific Models & Guides
| Surgical Procedure | Reduction in Operative Time (%) | Reduction in Fluoroscopy Time (s) | Improvement in Implant Fit Accuracy (mm) | Study Year |
|---|---|---|---|---|
| Complex Pelvic Osteotomy | 28.3 | 142 | 2.1 | 2022 |
| Total Shoulder Arthroplasty | 19.7 | 87 | 1.8 | 2023 |
| Maxillofacial Reconstruction | 31.5 | N/A | 1.5 | 2023 |
| Pediatric Spinal Deformity | 22.1 | 165 | 3.2 | 2024 |
Experimental Protocols
Protocol 1: Topology Optimization and L-PBF of a Tibial Knee Implant Objective: To design and manufacture a patient-specific tibial implant with graded porosity for optimized bone ingrowth and weight-bearing. Materials: Patient CT scan (DICOM), FEA software (e.g., ANSYS), TO software (e.g., nTopology), L-PBF system (Ti-6Al-4V powder), SEM, mechanical tester. Procedure:
- Segmentation & Model Preparation: Import DICOM into Mimics. Segment tibial bone, generate 3D model, and identify cortical and cancellous bone regions.
- FEA Loading Simulation: Apply physiological loading conditions (up to 3x body weight during gait) to the bone model. Map von Mises stress distribution.
- Topology Optimization: Define design space (implant volume), constraint (max stress < yield strength of Ti-6Al-4V), and objective (minimize mass). Run algorithm to generate a porous lattice structure.
- Lattice Integration: Apply a triply periodic minimal surface (TPMS) lattice (e.g., Gyroid) to the core region. Gradient porosity: 500µm pore size at bone interface, 300µm at core.
- L-PBF Manufacturing: Set parameters: laser power 250W, scan speed 1000 mm/s, layer thickness 30µm. Conduct build in Argon atmosphere.
- Post-Processing: Stress relieve at 650°C for 3 hours. Perform HIP at 920°C, 100 MPa for 2 hours. Support removal and surface finishing.
- Validation: Perform micro-CT to analyze pore size accuracy and connectivity. Conduct compression testing per ASTM F2996.
Protocol 2: 4D Printing of a Temperature-Responsive SMP Tracheal Stent Objective: To fabricate a patient-specific tracheal stent that expands at body temperature to provide structural support. Materials: SMP resin (poly(oligoethylene glycol) methacrylate-co-poly(ethylene glycol) diacrylate), Digital Light Processing (DLP) 3D printer, UV curing chamber, dynamic mechanical analyzer (DMA). Procedure:
- SMP Tg Tuning: Formulate resin with crosslinker ratio to target a Tg of 34°C, confirmed by Differential Scanning Calorimetry (DSC).
- 4D Model Design: Design a 2D flat, mesh-like pattern in CAD. This is the temporary shape.
- Deformation Programming:
- Print the 2D flat pattern using DLP (405nm light, 15s/layer exposure).
- Post-cure in UV oven for 30 min.
- Heat the printed 2D sheet above Tg (to 60°C) and mechanically deform it into the final 3D tubular stent shape.
- Cool and fix this permanent shape below Tg (0-10°C).
- Stent Deployment Simulation: Crimp the permanent 3D shape into a delivery catheter at 10°C. Immerse in phosphate-buffered saline (PBS) at 37°C. Record shape recovery kinetics (≥95% recovery in <60 sec).
- Characterization: Use DMA to measure recovery stress. Perform cyclical recovery testing (≥50 cycles) to assess durability.
Protocol 3: Bioprinting and Perfusion Culture of an Osteogenic Construct Objective: To bioprint a mesenchymal stem cell (MSC)-laden construct with perfusable channels and culture under osteogenic conditions. Materials: GelMA bioink, hMSCs, sacrificial bioink (Pluronic F127), extrusion bioprinter, perfusion bioreactor, osteogenic media (OM), qPCR system. Procedure:
- Bioink Preparation: Synthesize 10% w/v GelMA with 0.25% photoinitiator. Mix with hMSCs at 5x10⁶ cells/mL. Load into sterile printing cartridge at 20°C. Load sacrificial ink into separate cartridge.
- Printing Process: Using a coaxial printhead, print a grid structure (10x10x2 mm): core is sacrificial ink, shell is cell-laden GelMA. UV crosslink (365nm, 5 mW/cm²) each layer.
- Sacrificial Ink Removal: After printing, incubate construct at 37°C for 15 min, then flush channels with cold cell culture media to liquefy and remove Pluronic F127.
- Perfusion Culture: Connect construct to a peristaltic pump-based bioreactor. Culture in OM (DMEM, 10% FBS, 50 µg/mL ascorbate, 10mM β-glycerophosphate, 100nM dexamethasone) at 0.5 mL/min flow rate for 21 days.
- Analysis:
- Day 7, 14, 21: Extract RNA from constructs for qPCR analysis of Runx2, Osteocalcin, CD31.
- Day 21: Fix for histology (Alizarin Red S for calcium, von Kossa for mineralization).
Diagrams
Title: Workflow for Patient-Specific Optimized Implant
Title: 4D Printing Stimuli-Response Pathway
Title: Bioprinting Vascularized Bone Protocol
The Scientist's Toolkit: Research Reagent & Material Solutions
Table 3: Essential Materials for Advanced Manufacturing in Biomedical Research
| Item | Function & Application | Example Product/Catalog |
|---|---|---|
| Medical-Grade Ti-6Al-4V ELI Powder | Raw material for L-PBF of load-bearing implants. Spherical morphology ensures consistent flow and fusion. | AP&C / Carpenter Additive, 15-45 µm size distribution. |
| Shape Memory Polymer (SMP) Resin | Enables 4D printing of stimuli-responsive devices. Tunable transition temperature (Tg). | 4D Biomaterials 4Degra resin series for DLP printing. |
| Gelatin Methacryloyl (GelMA) | Photocrosslinkable, biocompatible bioink for cell encapsulation and bioprinting. | Advanced BioMatrix GelMA-Shellkit (Low, Med, High %). |
| Pluronic F127 | Thermoreversible sacrificial bioink. Forms solid strands at room temp, liquefies when cooled. | Sigma-Aldrich P2443, used for creating perfusable channels. |
| Osteogenic Differentiation Media Kit | Standardized media supplements to direct hMSCs toward osteogenic lineage in 3D cultures. | ThermoFisher Scientific A1007201 (Ascorbate, β-GP, Dex). |
| Micro-CT Calibration Phantom | For quantitative analysis of porosity, pore size, and strut thickness in AM-fabricated scaffolds. | Scanco Medical HA phantom with density standards. |
| Hot Isostatic Press (HIP) Service | Critical post-processing for metal AM parts to close internal porosity and improve fatigue life. | Bodycote or Quintus Technologies, standard medical implant cycle. |
| Perfusion Bioreactor System | Provides dynamic, convective nutrient supply to thick, cell-dense 3D printed constructs. | SysEng GmbH Perfusion Bioreactor BB1 250 mL chamber. |
Within biomedical engineering research for advanced prosthetics and implants, the restoration of naturalistic motor control and sensory perception remains a paramount challenge. This application note details the integration of electromyography (EMG), inertial measurement units (IMUs), and closed-loop algorithms to create sophisticated sensory feedback and control systems. Such systems are critical for developing the next generation of bidirectional neural interfaces, aiming to provide users with intuitive control and perceptible feedback from their prosthetic or implantable device.
Recent advancements focus on multi-modal sensing and adaptive algorithms. The table below summarizes key performance metrics from recent research (2023-2024).
Table 1: Performance Metrics of Integrated Sensory-Control Systems
| System Component | Key Metric | Reported Performance Range | Study Focus |
|---|---|---|---|
| High-Density EMG | Classification Accuracy | 95-99% | Pattern recognition for gesture control |
| IMU (Wrist/Ankle) | Orientation Error | < 2.0 degrees RMS | Gait phase detection, motion intent |
| Vibrotactile Feedback | Discrimination Accuracy | 85-92% | Feedback modality for grip force |
| Closed-Loop (EMG + Feedback) | Task Completion Time | Reductions of 25-40% vs. open-loop | Box-and-blocks test, grasping |
| Neural Stimulation | Sensory Threshold | 50-150 µA (charge-balanced) | Evoking referred tactile sensations |
Experimental Protocols
Protocol 1: Multi-Modal Intent Recognition for Transradial Prosthesis Control
Objective: To classify user intent using synchronized EMG and IMU data for controlling a multi-degree-of-freedom prosthetic hand. Materials: 8-channel surface EMG system, 9-DoF IMU, data acquisition unit (e.g., Biometrics Ltd., Delsys Trigno), custom prosthetic simulator.
- Sensor Placement: Place EMG electrodes in a bipolar configuration on the forearm flexor/extensor compartments. Securely mount the IMU on the dorsal side of the wrist.
- Calibration: Record 5-second maximal voluntary contractions (MVC) for each target muscle group.
- Task Protocol: Instruct the user to perform a set of 10 distinct hand/wrist movements (e.g., hand open, close, pronation, supination) in a randomized order. Each movement is held for 3 seconds, repeated 5 times, with 5 seconds of rest between repetitions.
- Data Acquisition: Synchronously sample EMG (2000 Hz) and IMU (100 Hz) data. Apply hardware filtering (EMG: 20-450 Hz bandpass).
- Signal Processing: For EMG, extract features (e.g., mean absolute value, wavelength, slope sign changes) from 150ms windows. For IMU, extract quaternion derivatives and linear acceleration norms.
- Classifier Training: Train a Support Vector Machine (SVM) or Linear Discriminant Analysis (LDA) classifier using the fused feature set. Validate using 5-fold cross-validation.
Protocol 2: Closed-Loop Grip Force Control with Vibrotactile Feedback
Objective: To assess the improvement in precision grip force modulation using EMG-controlled force with proportional vibrotactile feedback. Materials: Force-sensitive resistor (FSR), proportional vibrotactile actuator (tactor), EMG system, microcontroller (e.g., Arduino Due), object manipulation test set.
- System Setup: Mount the FSR on a prosthetic hand's fingertip. Place a single tactor on the user's upper arm. Calibrate the FSR output against known weights.
- Mapping: Map processed EMG amplitude (from forearm flexors) to desired grip force (0-20 N). Map the measured force from the FSR to a proportional vibration frequency (50-250 Hz).
- Open-Loop Baseline: Have the user perform a series of force targeting tasks (e.g., maintain 5N, 10N, 15N) without any vibrotactile feedback. Record the root-mean-square (RMS) force error.
- Closed-Loop Testing: Enable the vibrotactile feedback. Repeat the same force targeting tasks. The user modulates their EMG based on the vibrational cue.
- Analysis: Compare the RMS force error, settling time, and overshoot between open-loop and closed-loop trials across multiple subjects.
Visualization: System Architecture and Workflow
Title: Closed-Loop Prosthetic System with Sensory Feedback
Title: Experimental Workflow for System Validation
The Scientist's Toolkit: Research Reagent Solutions
Table 2: Essential Research Materials for Sensory-Control System Development
| Item | Function | Example/Notes |
|---|---|---|
| HD-sEMG Array | High spatial resolution recording of muscle activation patterns. Essential for robust pattern recognition. | 64-128 electrode grids; Delsys Trigno Galileo. |
| 9-DoF IMU | Provides kinematic context (orientation, acceleration) to disambiguate EMG intent and detect gait phases. | MPU-9250/BNO055; integrated into limb socket. |
| Biocompatible Electrodes | For chronic or acute neural stimulation to evoke sensory percepts. Must be charge-balanced. | Pt-Ir cuff electrodes; Utah slanted electrode array (ASEA). |
| Programmable Stimulator | Precisely controls amplitude, frequency, and pulse width of sensory feedback stimuli. | Tucker-Davis Technologies IZ2, custom FPGA boards. |
| Real-Time Processing Unit | Low-latency platform for running classification and closed-loop control algorithms. | Speedgoat baseline real-time target machine. |
| Force/Tactile Sensors | Measures prosthesis interaction with the environment to inform feedback algorithms. | Tekscan FlexiForce A401, BioTac multimodal sensor. |
| Vibrotactile/Tactors | Provides mechanical feedback modality, often used for grip force or mode indication. | Haptuator BM3C, Engineering Acoustics Inc. C-2. |
| Data Glove | Ground truth measurement of intact hand kinematics for training and validation. | CyberGlove Systems III. |
Application Notes for Biomedical Prosthetics and Implants
The integration of smart materials is revolutionizing biomedical engineering by enabling prosthetics and implants that actively respond to physiological cues, enhance integration, and improve long-term outcomes.
Shape Memory Alloys (SMAs): Nitinol in Stents and Orthopedic Devices
SMAs, primarily Nitinol (Ni-Ti), recover a predefined shape upon thermal or stress-induced activation. In biomedical contexts, their superelasticity and shape memory effect are leveraged for minimally invasive deployment and dynamic mechanical support.
Table 1: Key Quantitative Properties of Biomedical-Grade Nitinol
| Property | Typical Value/Range | Relevance to Implants |
|---|---|---|
| Austenite Finish Temp (A_f) | 20°C - 37°C | Set to be at or below body temp for in vivo activation. |
| Transformation Hysteresis | 20°C - 30°C | Dictates sensitivity of thermal response. |
| Superelastic Strain Recovery | Up to 8% | Enables significant deformation without permanent damage (e.g., stent crimping). |
| Cyclic Fatigue Life (in vivo) | > 10^7 cycles (varies with design) | Critical for long-term implants like heart valve frames. |
| Nickel Ion Release Rate | < 0.1 µg/cm²/day (passivated) | Biocompatibility and safety consideration. |
Primary Applications:
- Vascular Stents: Crimped for catheter delivery, they self-expand at body temperature. Superelasticity accommodates vessel pulsation.
- Orthodontic Archwires: Deliver constant, gentle force over a wide range of tooth movement.
- Bone Fixation Clamps: Apply compressive force upon warming, promoting osteointegration.
Self-Healing Polymers: Extending Implant Lifespan
Autonomic or stimulus-triggered self-healing polymers mitigate micro-crack formation, a major failure mode in chronic implants, by restoring mechanical integrity.
Table 2: Self-Healing Mechanisms and Performance
| Mechanism | Healing Agent/Chemistry | Typical Healing Efficiency* | Trigger | Implant Application Example |
|---|---|---|---|---|
| Intrinsic (Thermo-reversible) | Diels-Alder bonds, Hydrogen bonding | 70-95% (Tensile) | Heat, Light | Encapsulating coatings for neural electrodes. |
| Extrinsic (Microcapsule) | DCPD monomer & Grubbs' catalyst | >80% (Fracture Toughness) | Crack rupture | Bone cement (PMMA) composites. |
| Extrinsic (Vascular) | Two-part siloxane resins | >90% (multiple cycles) | Crack influx | Protective layers for biodegradable scaffolds. |
*Healing Efficiency = (Propertyhealed / Propertyoriginal) x 100%.
Primary Applications:
- Encapsulation for Bioelectronics: Heal dielectric barrier cracks to prevent fluid ingress and device failure.
- Load-Bearing Implants: Bone cement and composite joints recover from fatigue damage.
- Sealing Rings for Implantable Pumps: Automatically repair minor seal breaches.
Responsive Hydrogels: Drug Delivery and Tissue Interfaces
These hydrogels swell, shrink, or degrade in response to specific biological stimuli (pH, glucose, enzyme), enabling smart drug release and adaptive tissue interfaces.
Table 3: Stimuli-Responsive Hydrogels for Biomedical Applications
| Stimulus | Hydrogel Matrix Example | Response Time (Approx.) | Drug Release Profile | Application Target |
|---|---|---|---|---|
| pH (Gastric to Intestinal) | Alginate-Polyacrylic Acid | 0.5 - 2 hrs | Burst release at pH > 7 | Oral delivery of protein therapeutics. |
| Glucose | Phenylboronic Acid-based | 10 - 30 mins | Pulsatile, proportional to [Glucose] | Closed-loop insulin delivery. |
| Enzyme (Matrix Metalloproteinases) | PEG-peptide conjugate | 1 - 24 hrs (dose-dependent) | Erosion-controlled release | Site-specific chemo at tumor margins. |
| Temperature (LCST~37°C) | Poly(N-isopropylacrylamide) | <10 mins | Swelling/collapse modulation | Injectable cell carriers for tissue engineering. |
Primary Applications:
- Glucose-Responsive Insulin Delivery: Mimics pancreatic function via competitive binding chemistry.
- Post-Surgical Anti-Adhesion Barriers: Gel adapts to tissue bed and releases antifibrotics.
- 3D Bioprinting Inks: Provide rheological properties for printing and later dissolve for tissue maturation.
Experimental Protocols
Protocol: Cyclic Thermo-Mechanical Testing of Nitinol Stent Subcomponents
Objective: To characterize the fatigue life and stability of the shape memory effect under simulated physiological conditions. Materials: See "The Scientist's Toolkit" (Table 4). Methodology:
- Fixture Preparation: Mount the Nitinol wire or laser-cut stent sample (pre-set to expanded diameter) in a saline bath (0.9% NaCl, pH 7.4) maintained at 37±0.5°C.
- Mechanical Programming: Using the tensile tester, deform the sample to 6% strain (simulating crimping) at a rate of 0.1 mm/s.
- Constrained Recovery: Hold the sample in the deformed state. Lower the bath temperature to 10°C (below M_f) and hold for 120s.
- Activation & Measurement: Release the constraint, allowing free recovery. Heat the bath back to 37°C at 1°C/min. Record the recovery force and final strain.
- Cycling: Repeat steps 2-4 for a minimum of 100 cycles or until failure (crack observation > 100µm).
- Data Analysis: Plot recovery stress vs. cycle number. Calculate the percent loss of recovery strain over cycles.
Protocol: Evaluating Autonomous Self-Healing in Microcapsule-Embedded PMMA
Objective: To quantify fracture toughness recovery in a bone cement composite. Materials: PMMA powder, methyl methacrylate (MMA) monomer, DCPD-filled urea-formaldehyde microcapsules (150-200 µm diameter), Grubbs' catalyst 2nd generation. Methodology:
- Composite Fabrication: Mix PMMA powder with 10 wt% microcapsules and 0.5 wt% catalyst. Add MMA monomer per manufacturer ratio and stir into a paste.
- Specimen Preparation: Cast paste into Teflon molds for Compact Tension (CT) geometry specimens. Cure at 40°C for 24 hrs. Polish notch tip.
- Initial Fracture Test: Perform a Mode I fracture test on a pristine specimen per ASTM D5045. Record critical stress intensity factor (K_IC₁).
- Healing Phase: Align fractured halves in the original mold. Incubate at 37°C for 48 hours.
- Healed Fracture Test: Re-test the healed specimen identically, recording K_IC₂.
- Analysis: Calculate healing efficiency: η = (KIC₂ / KIC₁)² x 100%.
Protocol: Enzymatically Triggered Drug Release from a PEG-Hydrogel
Objective: To characterize release kinetics of a model drug in response to MMP-9, a key enzyme in tumor microenvironments. Materials: MMP-9 cleavable peptide crosslinker (GPLGIAGQ), 4-arm PEG-NHS ester, model drug (e.g., Fluorescein isothiocyanate–Dextran, FITC-Dex), recombinant MMP-9 enzyme. Methodology:
- Hydrogel Synthesis: Dissolve PEG-NHS and peptide crosslinker in HEPES buffer (pH 7.4) at a 1:1 molar ratio (NHS:amine). Add FITC-Dex (1 mg/mL final). Pipette 100 µL into cylindrical molds. Gel for 1 hr at RT.
- Release Study Setup: Place each hydrogel in 1 mL of release buffer (Tris-CaCl₂, pH 7.4) with or without (control) 100 nM MMP-9. Maintain at 37°C with gentle agitation.
- Sampling: At predetermined intervals (0.5, 1, 2, 4, 8, 12, 24h), collect 200 µL of supernatant and replace with fresh pre-warmed buffer (with or without enzyme).
- Quantification: Measure fluorescence of samples (Ex/Em: 492/518 nm). Convert to cumulative drug release using a standard curve.
- Analysis: Plot cumulative release vs. time. Fit data to a first-order or Higuchi model. Compare enzyme vs. control release profiles.
Visualizations
Diagram 1: Nitinol Thermo-Mechanical Fatigue Test Workflow (82 chars)
Diagram 2: Stimulus-Response Logic in Smart Hydrogels (68 chars)
The Scientist's Toolkit: Research Reagent Solutions
Table 4: Essential Materials for Featured Smart Materials Research
| Item | Function / Relevance | Example Supplier / Cat. No. (Illustrative) |
|---|---|---|
| Nitinol Wire (Superelastic, A_f ~30°C) | Core material for testing SMA properties; used in stent prototypes. | Fort Wayne Metals #SME505 |
| Dicyclopentadiene (DCPD) Microcapsules | Healing agent reservoir for extrinsic self-healing composites. | Synthesized in-lab per urea-formaldehyde encapsulation. |
| Grubbs' Catalyst 2nd Generation | Ring-opening metathesis polymerization catalyst for DCPD. | Sigma-Aldrich #569747 |
| 4-arm PEG-NHS Ester (20kDa) | Macromer for forming hydrolytically stable, peptide-crosslinked hydrogels. | JenKem Technology #A4012 |
| MMP-9 Cleavable Peptide (GPLGIAGQ) | Provides enzyme-sensitive crosslink point in hydrogels. | Genscript (Custom synthesis) |
| Recombinant Human MMP-9 | Key enzyme for triggering biomimetic drug release studies. | R&D Systems #911-MP |
| ElectroForce Planar Biaxial Test System | For applying complex cyclical loads to stent and tissue samples. | TA Instruments #3100 |
| Fluorescein Isothiocyanate–Dextran (70 kDa) | High molecular weight model drug for tracking release kinetics. | Sigma-Aldrich #46945 |
Application Notes: Neuromodulation Implants
Neuromodulation implants represent a critical convergence of neural engineering, materials science, and electrochemistry. Recent advances focus on improving chronic stability and spatial resolution while minimizing glial scarring and foreign body response.
Key Quantitative Data Summary:
Table 1: Performance Metrics for Contemporary Neuromodulation Electrodes
| Parameter | Utah Array (Si) | Polymer-Based (PEDOT:PSS) | Carbon Nanotube Fiber | Ideal Target |
|---|---|---|---|---|
| Electrode Site Diameter (µm) | 50 - 400 | 10 - 50 | 5 - 20 | < 20 |
| Impedance at 1 kHz (kΩ) | 100 - 500 | 10 - 50 | 20 - 100 | < 50 |
| Charge Storage Capacity (mC/cm²) | 1 - 5 | 20 - 100 | 40 - 150 | > 50 |
| Chronic Recording Yield (% at 1 yr) | ~40-60% | ~60-80% (preclinical) | ~70-85% (preclinical) | > 80% |
| Flexible Modulus (GPa) | ~150 (Si) | 0.001 - 2 | 10 - 50 | < 5 |
Experimental Protocol 1: In Vivo Electrochemical Impedance Spectroscopy (EIS) for Chronic Stability Assessment
Objective: To longitudinally monitor the interfacial stability and degradation of novel electrode materials in a rodent model.
Materials:
- Implant: Novel polymer-based microelectrode array.
- Animal Model: Adult Sprague-Dawley rat (n=8 per group).
- Surgical suite with stereotaxic frame.
- Potentiostat/Galvanostat with EIS capability.
- Automated behavioral chamber.
Methodology:
- Pre-implantation Baseline: Perform EIS on sterilized electrodes in 1X PBS (pH 7.4) at 37°C. Apply a 10 mV RMS sinusoidal signal from 100 kHz to 0.1 Hz.
- Stereotaxic Implantation: Anesthetize rat. Perform craniotomy over primary motor cortex (M1). Insert electrode array at 1 µm/s using a hydraulic microdrive to a depth of 1.5 mm.
- Chronic Monitoring: At weeks 1, 4, 12, and 24 post-implant: a. Connect headstage under light anesthesia. b. Acquire EIS spectrum in identical configuration to baseline. c. Extract key parameters: low-frequency impedance (Zlf, 0.1 Hz), charge transfer resistance (Rct) from Nyquist plot fitting.
- Terminal Histology: Perfuse-fix brain. Section and immunostain for NeuN (neurons), GFAP (astrocytes), and Iba1 (microglia). Quantify glial scar thickness and neuronal density within 150 µm radius of electrode track.
- Correlative Analysis: Statistically correlate Rct changes over time with histological markers of inflammation and neuronal loss.
Application Notes: Cardiovascular Stents
Modern stent design prioritizes hemodynamic compatibility, controlled drug elution, and engineered biodegradation for temporary scaffold support.
Key Quantitative Data Summary:
Table 2: Comparative Analysis of Stent Platforms
| Stent Type | Material | Strut Thickness (µm) | Radial Strength (N/mm) | Drug/Payload | Endothelialization Time | Degradation Period |
|---|---|---|---|---|---|---|
| 2nd Gen DES | CoCr or PtCr | 81 - 91 | 12 - 15 | Everolimus, Sirolimus | 6-9 months | Non-degradable |
| Bioresorbable Scaffold | PLLA / PDLLA | 150 - 200 | 10 - 13 | Everolimus | 3-6 months | 24-48 months |
| Nanotextured DES | Nitinol / CoCr | 60 - 75 | 14 - 18 | Sirolimus + CD34+ Ab | 1-3 months | Non-degradable |
| Shear-Sensitive DES | Mg alloy WE43 | 120 - 150 | 11 - 14 | Paclitaxel | 3-6 months | 12-18 months |
Experimental Protocol 2: In Vitro Hemodynamic Shear Stress Profiling for Stent Design
Objective: To assess thrombogenicity and drug release kinetics of a novel stent under simulated physiological shear conditions.
Materials:
- Prototype stent (e.g., shear-sensitive Mg alloy).
- Parallel-plate flow chamber system with programmable pump.
- Whole human blood (heparinized) or platelet-rich plasma.
- Phosphate-Buffered Saline (PBS).
- ELISA kit for drug concentration (e.g., Paclitaxel).
Methodology:
- Setup: Mount stent segment in flow chamber channel. Connect to a recirculating flow loop containing 200 mL of PBS at 37°C.
- Shear Stress Application: a. Arterial Phase: Program pump to generate pulsatile flow, producing a shear stress range of 0.5 - 4.0 Pa (simulating coronary conditions) for 60 minutes. b. Stasis Phase: Stop flow for 5 minutes to simulate low-flow states. c. Repeat cycle for 24-72 hours.
- Thrombus Analysis: At endpoint, flush channel gently. Visually score thrombus adhesion (0-5 scale). Fix and stain with CD41 for platelet adhesion, quantify via imaging software.
- Drug Elution Kinetics: In separate runs, use PBS as perfusate. Collect 1 mL samples from reservoir at 15 min, 1h, 4h, 8h, 24h, and 72h. Analyze drug concentration via ELISA. Calculate cumulative release profile.
- Computational Fluid Dynamics (CFD) Validation: Create a 3D model of the stent. Simulate flow velocities and shear stress distributions using ANSYS Fluent, comparing low-shear regions (< 0.5 Pa) with experimental thrombus adhesion maps.
Application Notes: Load-Bearing Orthopedic Devices
Orthopedic implants for large bone defects require a triply optimized design: mechanical load-bearing, osteointegration, and potential for antibiotic or osteogenic factor delivery.
Key Quantitative Data Summary:
Table 3: Properties of Advanced Orthopedic Scaffolds/Implants
| Implant Type & Material | Porosity (%) | Pore Size (µm) | Compressive Strength (MPa) | Elastic Modulus (GPa) | Bioactive Coating | Osteointegration Rate (Bone Ingrowth, % at 12 wks) |
|---|---|---|---|---|---|---|
| Ti-6Al-4V Lattice | 60-80 | 500-800 | 50 - 120 | 2 - 5 (effective) | None or HA | 40-60% |
| Bioactive Glass Scaffold | 70-90 | 300-600 | 5 - 20 | 0.5 - 2 | Intrinsic | 50-70% |
| PEEK-HA Composite | 50-70 | 400-700 | 30 - 90 | 3 - 8 | HA integrated | 30-50% |
| 3D Printed β-TCP | 55-75 | 450-750 | 2 - 15 | 1 - 4 (effective) | Intrinsic | 60-80% |
Experimental Protocol 3: In Vivo Evaluation of a Load-Bearing, Drug-Eluting Femoral Cage in an Ovine Critical-Sized Defect Model
Objective: To assess the biomechanical stability, bone ingrowth, and local antibiotic release of a novel 3D-printed, porous titanium cage with a vancomycin-loaded hydrogel infill.
Materials:
- Implant: 3D-printed Ti-6Al-4V porous cage (20mm segment), infilled with hyaluronic acid-vancomycin hydrogel.
- Animal Model: Mature sheep (n=6). Sheep femur provides appropriate weight-bearing scaling.
- Surgical plating system.
- Micro-CT scanner.
- Mechanical testing system (e.g., Instron).
Methodology:
- Surgical Creation of Defect: Perform lateral approach to mid-diaphysis of sheep femur. Create a 20mm osteoperiosteal segmental defect. Stabilize using a locking compression plate. Implant the test cage into the defect.
- Post-Op & Monitoring: Administer systemic analgesia. Monitor gait weekly. At 4, 12, and 24 weeks post-op, euthanize two animals per time point.
- Ex Vivo Analysis: a. Micro-CT Imaging: Scan explanted femur. Quantify bone volume/total volume (BV/TV) within the cage pores and at the bone-implant interface. b. Histomorphometry: Undecalcified histological sections (Giemsa stain, Stevenel's Blue). Measure bone-implant contact (BIC%) and ingrowth depth. c. Mechanical Testing: Perform torsional testing to failure on the explanted bone-implant construct. Compare failure torque and stiffness to contralateral intact femur. d. Drug Residue Analysis: Dissect hydrogel from cage pores. Use HPLC to measure residual vancomycin, calculating in vivo release kinetics.
Visualization Diagrams
Title: Neural Implant Foreign Body Response Pathway
Title: Stent Hemodynamic and Drug Release Test Workflow
Title: Dual-Function Orthopedic Implant Mechanism
The Scientist's Toolkit: Key Research Reagent Solutions
Table 4: Essential Materials for Featured Biomedical Implant Research
| Research Reagent / Material | Supplier Examples | Function in Protocol |
|---|---|---|
| Poly(3,4-ethylenedioxythiophene):Poly(styrene sulfonate) (PEDOT:PSS) | Heraeus, Sigma-Aldrich | Conductive polymer coating for neural electrodes; lowers impedance, increases charge injection capacity. |
| CD41 (GPIIb/IIIa) Antibody | Bio-Rad, Abcam | Immunostaining of adhered platelets on stent surfaces for thrombogenicity quantification. |
| Bovine Serum Albumin (BSA), Fluorescently Labeled | Thermo Fisher | Model protein for studying adsorption kinetics on implant surfaces prior to in vivo use. |
| Simulated Body Fluid (SBF) | Biorelevant.com, Prep in-house | In vitro assessment of bioactivity and apatite-forming ability of orthopedic implant coatings. |
| Vancomycin Hydrochloride, USP Grade | Pfizer, Sigma-Aldrich | Broad-spectrum glycopeptide antibiotic for loading into hydrogel infill of orthopedic devices to prevent infection. |
| Osteocalcin (OCN) ELISA Kit | R&D Systems, Quidel | Quantification of osteogenic differentiation and bone formation activity around implanted scaffolds. |
| Paclitaxel, Analytical Standard | LC Laboratories, Cayman Chemical | Standard for calibrating HPLC/ELISA assays to measure drug elution from cardiovascular stents. |
| GFAP Antibody (Astrocyte Marker) | Cell Signaling, Millipore | Immunohistochemical marker for reactive astrogliosis around neural implants. |
| Micro-CT Calibration Phantom (Hydroxyapatite) | Scanco Medical, Bruker | For calibrating grayscale values to mineral density in bone ingrowth studies. |
| Potentiostat with EIS Module (e.g., Autolab, Ganny) | Metrohm, Ganny Instruments | Critical for electrochemical characterization of neural electrodes and corrosion studies of metallic implants. |
Application Notes
Integration into Prosthetic & Implant Design Pipeline
The development of next-generation biomedical prosthetics and implants requires a paradigm shift from traditional animal testing to human-relevant, predictive platforms. This integrated approach leverages in-silico computational modeling and in-vitro biomimetic tissue platforms to de-risk design, accelerate iteration, and improve clinical translation within a biomedical engineering thesis framework.
Key Advantages for Implant Research:
- Mechanical Simulation: Finite Element Analysis (FEA) predicts stress-strain distributions at the bone-implant interface, identifying potential failure points (e.g., stress shielding in femoral stems) before prototype fabrication.
- Biocompatibility Screening: Agent-based modeling of immune cell response (e.g., macrophages) to implant surfaces predicts foreign body reaction severity.
- Pharmacokinetics for Drug-Eluting Implants: Computational fluid dynamics (CFD) models drug elution profiles from coated stents or orthopedic implants into surrounding tissue.
- High-Content Biomimetic Testing: 3D bioprinted osteochondral units or vascularized bone-mimetic platforms provide a physiologically relevant microenvironment to assess implant osseointegration and soft tissue sealing.
Table 1: Comparative Outputs of In-Silico and In-Vitro Pre-Clinical Models
| Model Type | Primary Output | Typical Quantitative Metrics | Relevance to Implant Design |
|---|---|---|---|
| Finite Element Analysis (FEA) | Stress/Strain Fields | Von Mises Stress (MPa), Strain Energy Density (J/m³), Displacement (µm) | Fatigue life prediction, optimal geometry and material selection for load-bearing implants. |
| Computational Fluid Dynamics (CFD) | Flow & Concentration Fields | Wall Shear Stress (Pa), Drug Concentration (µg/mL), Pressure Gradients (mmHg/mm) | Design of drug-eluting coatings, prediction of thrombus risk on vascular implants. |
| Agent-Based Model (ABM) | Cell Population Dynamics | Cell Count, Cytokine Concentration (pg/mL), Migration Speed (µm/hr) | Prediction of chronic inflammation or fibrous encapsulation of implant surfaces. |
| 3D Bioprinted Bone Niche | Tissue Remodeling | Alkaline Phosphatase Activity (nmol/min/µg), Calcium Deposition (µg/cm²), Osteogenic Gene Fold-Change | Functional assessment of implant surface treatments (e.g., hydroxyapatite coating) on osteogenesis. |
| Microphysiological System (MPS) | Integrated Tissue Response | Transepithelial/Transendothelial Electrical Resistance (Ω×cm²), Metabolic Rate (µM/hr), Protein Secretion (ng/day) | Evaluation of implant biocompatibility and barrier function restoration (e.g., corneal, vascular implants). |
Detailed Experimental Protocols
Protocol: FEA of a Cementless Femoral Hip Stem
Title: Predicting Peri-Implant Bone Adaptation Using Computational Mechanics.
Objective: To simulate the mechanical environment in peri-implant bone following total hip arthroplasty to assess the risk of stress shielding and aseptic loosening.
Materials (Research Reagent Solutions):
- Software: Abaqus/ANSYS/COMSOL Multiphysics (FEA solver).
- Geometry: 3D CAD model of femoral stem and simplified proximal femur (STL files).
- Material Properties: Isotropic, linear elastic assignments (Ti-6Al-4V: E=110 GPa, ν=0.3; Cortical Bone: E=17 GPa, ν=0.3; Cancellous Bone: E=1 GPa, ν=0.3).
- Mesh Generator: Integrated tetrahedral/hybrid mesher.
- Boundary & Load Conditions: Data for gait cycle loading (~2.5-3x body weight).
Procedure:
- Import & Assembly: Import the femoral stem CAD model and position it within a canonical proximal femur geometry in the FEA pre-processor.
- Material Assignment: Assign the material properties listed above to the respective components (implant, cortical shell, cancellous bone).
- Contact Definition: Define the bone-implant interface as a "frictional contact" with a coefficient of friction of 0.8 to simulate initial press-fit stability.
- Meshing: Generate a fine, conforming mesh with convergence analysis. Ensure at least 3 elements through the thickness of the cortical shell.
- Loading & Constraint: Fix the distal end of the femur. Apply a simplified joint reaction force (e.g., 2000 N) at the head of the stem at an angle of 15° from the vertical axis, simulating single-leg stance.
- Solution: Run a static structural analysis.
- Post-Processing: Quantify and visualize the von Mises stress in the implant and the strain energy density (SED) in the peri-implant bone regions. Compare SED to a physiological remodeling threshold (e.g., 0.05-0.15 J/m³).
Protocol: Fabrication and Implant Testing of a 3D Bioprinted Osteogenic Niche
Title: Assessing Implant Osseointegration in a Biomimetic 3D Bone Model.
Objective: To evaluate the osteoinductive potential of a novel implant surface coating using a human cell-based, 3D bioprinted bone tissue platform.
Materials (Research Reagent Solutions):
- Cells: Human Mesenchymal Stem Cells (hMSCs), donor-derived.
- Bioink: Alginate-gelatin methacryloyl (GelMA) composite hydrogel (e.g., 3% alginate, 5% GelMA).
- Bioprinter: Extrusion-based 3D bioprinter (e.g., BIO X, Allevi).
- Crosslinker: 100 mM Calcium Chloride (CaCl₂) solution.
- Osteogenic Media: DMEM, 10% FBS, 50 µM ascorbic acid, 10 mM β-glycerophosphate, 100 nM dexamethasone.
- Test Article: Titanium alloy disc (Ø 6mm) with experimental surface coating (e.g., plasma-sprayed hydroxyapatite vs. control).
- Assay Kits: AlamarBlue (metabolic activity), Quant-iT PicoGreen (DNA content), SensoLyte pNPP Alkaline Phosphatase Assay.
Procedure:
- Cell Preparation: Culture and expand hMSCs to passage 3-5. Harvest and resuspend in bioink precursor at a density of 5 x 10^6 cells/mL.
- Bioprinting: Load bioink into a sterile cartridge. Print a cylindrical scaffold (e.g., 8mm diameter, 2mm height) with a defined pore architecture (e.g., 0/90° laydown pattern) directly around the placed implant disc in a culture well.
- Crosslinking: Immediately immerse the printed construct in CaCl₂ solution for 5 minutes for ionic crosslinking. Then expose to UV light (365 nm, 5 mW/cm²) for 60 seconds for photocrosslinking of GelMA.
- Culture: Replace crosslinker with osteogenic media. Culture for 21 days, changing media every 2-3 days.
- Analysis:
- Weekly: Perform AlamarBlue assay to track metabolic activity.
- Day 7, 14, 21: Harvest triplicate constructs. Lyse cells for DNA quantification (PicoGreen) and Alkaline Phosphatase (ALP) activity measurement, normalized to DNA content.
- Day 21: Fix samples for histological staining (Alizarin Red S for mineralization) and imaging (confocal microscopy for cell morphology).
Diagrams
Title: Integrated Pre-Clinical Testing Workflow for Implants
Title: Cell-Implant Surface Interaction Signaling Pathway
The Scientist's Toolkit: Key Research Reagent Solutions
Table 2: Essential Materials for Biomimetic Implant Testing Platforms
| Item | Function & Relevance |
|---|---|
| Gelatin Methacryloyl (GelMA) | A photocrosslinkable hydrogel derived from ECM; provides tunable mechanical properties and cell-adhesive motifs (RGD) for 3D bioprinting of tissue niches around implants. |
| Polycaprolactone (PCL) Filament | A biodegradable, thermoplastic polymer for fused deposition modeling (FDM) 3D printing; used to fabricate porous scaffold frameworks that mimic bone trabeculae for implant integration studies. |
| AlamarBlue Cell Viability Reagent | A resazurin-based dye used for non-destructive, longitudinal tracking of metabolic activity in cells cultured on or around implant materials in 3D. |
| Recombinant Human BMP-2 | A potent osteoinductive growth factor; used as a positive control or synergistic agent in osteogenic media to validate the performance of bone-implant platforms. |
| Anti-Human CD44 / Integrin β1 Antibodies | Flow cytometry or immunofluorescence markers to characterize stem cell phenotype and adhesion activation state upon contact with functionalized implant surfaces. |
| μ-Slide Chemotaxis | A microfluidic chamber plate for studying directed migration (haptotaxis) of immune or progenitor cells towards implant material gradients in a controlled environment. |
| Finite Element Analysis Software (e.g., COMSOL) | Enables multiphysics modeling (structural mechanics, fluid flow, mass transport) to simulate the complex physical environment at the implant-tissue interface. |
| Extracellular Matrix (ECM) Coatings (e.g., Collagen I, Laminin) | Used to functionalize implant surfaces in-vitro to study the effects of specific protein coatings on cell adhesion and differentiation prior to in-vivo use. |
Navigating Complexities: Troubleshooting Design Flaws and Optimizing for Performance & Safety
Within biomedical engineering research on prosthetics and implants, long-term functional integration is paramount. This document details application notes and protocols for investigating the four primary failure modes that limit device lifespan: mechanical fatigue, corrosion, biofouling, and immune rejection. Understanding these interconnected phenomena is critical for developing next-generation materials and surface treatments.
Table 1: Prevalence and Impact of Common Failure Modes in Orthopedic Implants
| Failure Mode | Approximate Incidence in Revision Surgeries | Primary Implant Types Affected | Typical Onset Timeframe |
|---|---|---|---|
| Mechanical Fatigue | 25-35% | Hip stems, knee tibial trays, spinal rods | 3-15 years |
| Corrosion | 10-15% (often concomitant) | Modular taper junctions (CoCr/ Ti), fracture fixation plates | 1-10 years |
| Biofouling & Infection | 20-25% | All, especially trauma and joint arthroplasty | <1 year (acute) to years (chronic) |
| Aseptic Loosening (Immune Rejection Response) | ~55-65% | Hip/ knee acetabular cups, cementless stems | 5-20 years |
Table 2: Key Quantitative Metrics for Testing Failure Modes
| Test Parameter | Standard Protocol | Target Value/Endpoint | Relevant Failure Mode |
|---|---|---|---|
| Fatigue Endurance Limit | ISO 7206-4 (Hip stems) | >10⁷ cycles at physiological load (3x BW) | Mechanical Fatigue |
| Potentiodynamic Polarization | ASTM F2129 | Breakdown Potential (Ebd) > 600 mV vs. SCE | Corrosion |
| Bacterial Adhesion Density | ASTM E2647 | CFU/cm² reduction > 2 log vs. control | Biofouling |
| Pro-inflammatory Cytokine Release (IL-1β, TNF-α) | ELISA from cell culture | Concentration (pg/mL) vs. control material | Immune Rejection |
Detailed Experimental Protocols
Protocol: In-Vitro Cyclic Fatigue Testing of a Femoral Stem
Objective: Determine the fatigue life of a metallic femoral stem under simulated gait loading. Materials: Servo-hydraulic test frame, environmental chamber (37°C, PBS), potting material (e.g., PMMA), specimen implant. Procedure:
- Potting: Embed the distal 1/3 of the femoral stem in a rigid potting block aligned to the machine axis.
- Fixturing: Mount the potted specimen in the test frame. Apply a sinusoidal axial load.
- Loading Profile: Set load range from 300 N to 3000 N at 5 Hz frequency (simulating 3x body weight for an 80 kg patient).
- Environment: Submerge the proximal stem in PBS at 37±1°C within the environmental chamber.
- Run Test: Initiate cycling. Monitor continuously for a drop in natural frequency or visible crack (failure criterion). If no failure occurs, terminate at 10⁷ cycles ("run-out").
- Post-Test Analysis: Examine fracture surfaces via Scanning Electron Microscopy (SEM) to identify crack initiation sites and striations.
Protocol: Electrochemical Corrosion Testing of Modular Taper Couplings
Objective: Assess the crevice corrosion susceptibility of a CoCrMo/Ti6Al4V modular junction. Materials: Potentiostat, standard calomel electrode (SCE), platinum counter electrode, electrochemical cell, simulated physiological fluid (e.g., PBS or ASTM F2129 solution). Procedure:
- Assembly: Create the modular taper junction per manufacturer specs at a controlled assembly force (e.g., 4 kN).
- Setup: Immerse the assembled junction in 37°C test solution. Connect the implant as the working electrode.
- Open Circuit Potential (OCP): Measure OCP for 1 hour to allow stabilization.
- Potentiodynamic Scan: Starting from -0.2 V vs. OCP, scan anodically at 1 mV/s until current density exceeds 100 µA/cm².
- Data Analysis: Plot potential vs. log(current density). Identify the breakdown potential (Ebd) and passive current density. A lower Ebd indicates higher susceptibility.
Protocol: Assessment of Antimicrobial Surface Efficacy
Objective: Quantify the reduction in bacterial adhesion on a surface-modified titanium sample. Materials: Staphylococcus aureus (ATCC 25923), Tryptic Soy Broth (TSB), 24-well plate, live/dead BacLight stain, fluorescence plate reader, sonication bath. Procedure:
- Sample Preparation: Sterilize test (coated) and control (uncoated Ti) samples by autoclaving.
- Bacterial Culture: Grow S. aureus to mid-log phase (OD600 ~0.5) in TSB.
- Adhesion Phase: Place samples in wells, inoculate with 2 mL bacterial suspension (10⁵ CFU/mL in fresh TSB). Incubate statically at 37°C for 2 hours.
- Rinsing: Gently rinse samples 3x with PBS to remove non-adherent planktonic cells.
- Detachment & Enumeration: Transfer each sample to a tube with 5 mL PBS. Sonicate for 5 minutes (to detach adherent cells), then vortex for 30 seconds. Serially dilute, plate on TSA, and count CFU after 24h incubation.
- Viability Staining (Parallel Assay): After rinsing, stain adherent bacteria on a separate sample set with SYTO9/PI. Image via fluorescence microscopy; quantify live/dead ratio.
Protocol: In-Vitro Macrophage Polarization Assay
Objective: Evaluate the immuno-modulatory potential of implant wear debris. Materials: THP-1 human monocyte cell line, PMA (phorbol 12-myristate 13-acetate), IL-4 & IL-13 (M2 inducers), LPS & IFN-γ (M1 inducers), wear debris (0.1-10 µm particles, characterized), qPCR reagents. Procedure:
- Macrophage Differentiation: Culture THP-1 monocytes with 100 nM PMA for 48 hours to differentiate into M0 macrophages.
- Particle Challenge: Harvest M0 cells, seed onto test surfaces or co-culture with characterized wear debris (e.g., 10 particles per cell) in 12-well plates for 24-72 hours.
- Control Polarization: In parallel, polarize M0 cells with 20 ng/mL IL-4+IL-13 (M2) or 100 ng/mL LPS+20 ng/mL IFN-γ (M1).
- RNA Extraction & qPCR: Lyse cells, extract RNA, and perform cDNA synthesis. Run qPCR for signature markers: iNOS and TNF-α (M1); ARG1 and CD206 (M2).
- Analysis: Calculate fold-change in gene expression (2-ΔΔCt) relative to M0 control on standard tissue culture plastic.
Visualizations
Diagram 1: Interplay of Implant Failure Modes (100 chars)
Diagram 2: Iterative Implant Material Testing Workflow (98 chars)
Diagram 3: Immune Rejection: Foreign Body Response Cascade (99 chars)
The Scientist's Toolkit: Research Reagent Solutions
Table 3: Essential Reagents for Investigating Implant Failure Modes
| Reagent / Material | Function & Application | Supplier Examples (Non-exhaustive) |
|---|---|---|
| Simulated Body Fluid (SBF) | In-vitro bioactivity and apatite formation testing; corrosion medium. | Sigma-Aldrich, BioreclamationIVT |
| Live/Dead BacLight Bacterial Viability Kit | Fluorescent staining to distinguish live vs. dead adherent bacteria on surfaces. | Thermo Fisher Scientific |
| THP-1 Human Monocyte Cell Line | Model for studying human macrophage differentiation and polarization in response to materials. | ATCC |
| Recombinant Human Cytokines (IL-4, IL-13, IFN-γ, TNF-α) | To polarize macrophages (M1/M2) in cell culture models of immune response. | PeproTech, R&D Systems |
| Micro-sized Wear Debris (PE, CoCr, Ti) | Standardized particles for in-vitro simulation of particle-induced osteolysis and inflammation. | Zimmer Biomet (Research offers), Johnson Matthey |
| Potentiostat/Galvanostat with EIS | For conducting electrochemical corrosion tests (potentiodynamic, EIS). | Gamry Instruments, BioLogic |
| Fatigue Test System with Environmental Chamber | For cyclic loading of implant specimens in a controlled, heated fluid environment. | Instron, MTS Systems |
| OsteoSense (Near-IR fluorescent probe) | In-vivo imaging agent for detecting osteoclastic activity (bone resorption) in animal models. | PerkinElmer |
Application Notes
The long-term success of biomedical implants and prosthetics is critically limited by the foreign body response (FBR). This is a complex, multi-stage immune reaction culminating in fibrous capsule formation, which can lead to device isolation, malfunction, and failure. Modern biomedical engineering research focuses on two primary, often integrated, strategies to mitigate the FBR: 1) Surface Modification to create non-fouling or biomimetic interfaces, and 2) Application of Immunomodulatory Coatings to actively direct the host immune response toward a regenerative, tolerant phenotype.
Key Surface Modification Strategies:
- Hydrophilic Polymer Brushes: Poly(ethylene glycol) (PEG), poly(2-hydroxyethyl methacrylate) (pHEMA), and zwitterionic polymers (e.g., poly(sulfobetaine methacrylate), pSBMA) create a hydration layer that sterically hinders non-specific protein adsorption, the initial trigger for the FBR.
- Extracellular Matrix (ECM)-Mimetic Coatings: Coatings of collagen, fibronectin, laminin, or their bioactive peptides (e.g., RGD) promote specific integrin-mediated cell adhesion, fostering constructive tissue integration rather than inflammatory encapsulation.
- Nanostructured and Microtopographic Surfaces: Engineered surface patterns at the micro- and nanoscale can influence macrophage polarization and fibroblast behavior, reducing capsule thickness.
Key Immunomodulatory Approaches:
- Anti-inflammatory Drug Elution: Localized, controlled release of corticosteroids (e.g., dexamethasone) or NSAIDs from the implant coating suppresses the acute inflammatory phase.
- Cytokine and Signaling Molecule Delivery: Coatings that release anti-inflammatory cytokines (e.g., IL-4, IL-10) or pro-regenerative factors (e.g., VEGF) actively polarize macrophages toward the pro-healing M2 phenotype.
- "Self" Mimicry and CD47 Display: Functionalization with "Don't Eat Me" signals like the CD47 protein inhibits phagocytosis by signaling through macrophage SIRPα receptors.
Quantitative Comparison of Coating Performance:
Table 1: In Vivo Performance Metrics of Representative Coating Strategies in Rodent Models (28-day implant)
| Coating Strategy | Key Material/Agent | Macrophage Response (M1:M2 Ratio at Day 7) | Avg. Fibrous Capsule Thickness (µm) | Key Measurement Method |
|---|---|---|---|---|
| Uncoated Control | Titanium or PDMS | 4.2 : 1 | 120 ± 35 | Histomorphometry |
| Hydrophilic Brush | pSBMA (Zwitterionic) | 2.1 : 1 | 65 ± 18 | Histomorphometry |
| ECM-Mimetic | RGD Peptide Conjugate | 1.8 : 1 | 45 ± 12 | Histomorphometry |
| Drug Eluting | Dexamethasone (0.5 µg/day) | 0.9 : 1 | 30 ± 10 | Histomorphometry, µCT |
| Cytokine Releasing | IL-4 (10 ng/day) | 0.6 : 1 | 25 ± 8 | Histomorphometry, IHC |
Table 2: In Vitro Protein Adsorption and Cell Adhesion Data
| Surface Coating | Serum Protein Adsorption (ng/cm²) | Macrophage Adhesion (cells/mm² at 24h) | Fibroblast Adhesion (cells/mm² at 24h) |
|---|---|---|---|
| Bare Substrate | 450 ± 80 | 310 ± 45 | 280 ± 40 |
| PEG Brush | 95 ± 20 | 85 ± 20 | 40 ± 15 |
| pHEMA Hydrogel | 110 ± 30 | 110 ± 25 | 180 ± 30 |
| RGD Functionalized | 380 ± 60 | 250 ± 35 | 410 ± 50 |
Detailed Protocols
Protocol 1: Dopamine-Assisted Co-deposition of Zwitterionic Polymer and IL-4 (pSBMA-IL-4) on Titanium Implants
Objective: To create a stable, multifunctional coating on metal implants that combines non-fouling properties with active immunomodulation.
Materials (Research Reagent Solutions):
- Titanium alloy (Ti-6Al-4V) discs: (10mm diameter, polished). Primary substrate.
- Dopamine hydrochloride: Initiator for self-polymerization and universal adhesion.
- pSBMA-NHS ester: Zwitterionic polymer with activated carboxyl for amine coupling.
- Recombinant murine IL-4: Immunomodulatory cytokine.
- Tris-HCl buffer (10mM, pH 8.5): Reaction buffer for dopamine polymerization.
- Phosphate Buffered Saline (PBS, pH 7.4): Washing and dilution buffer.
- Bicinchoninic Acid (BCA) Assay Kit: For quantifying surface-bound protein/cytokine.
Procedure:
- Substrate Preparation: Clean Ti discs sequentially in acetone, ethanol, and deionized water via sonication for 15 minutes each. Dry under nitrogen stream.
- Co-deposition Solution Preparation: Dissolve 2 mg/mL dopamine hydrochloride and 5 mg/mL pSBMA-NHS ester in Tris-HCl buffer. Gently add recombinant IL-4 to a final concentration of 10 µg/mL. Mix gently and use immediately.
- Coating Process: Immerse the clean Ti discs in the co-deposition solution. Incubate for 24 hours at room temperature with gentle agitation, protected from light.
- Washing: Remove discs and rinse thoroughly with copious PBS (3x, 5 min each) to remove unreacted monomers and physically adsorbed IL-4.
- Characterization: Quantify surface-bound IL-4 using a modified BCA assay. Verify coating uniformity and thickness via ellipsometry or atomic force microscopy (AFM). Assess non-fouling properties by incubating in 100% fetal bovine serum for 1 hour and measuring adsorbed protein (BCA assay).
Protocol 2: In Vitro Macrophage Polarization Assay for Coating Screening
Objective: To quantitatively evaluate the immunomodulatory potential of a coating by analyzing macrophage phenotype shift.
Materials (Research Reagent Solutions):
- RAW 264.7 murine macrophage cell line or Bone Marrow-Derived Macrophages (BMDMs): Model immune cells.
- Test substrates: Coated and uncoated materials in 24-well plate format.
- LPS (100 ng/mL) & IFN-γ (20 ng/mL): M1-polarizing stimuli (positive control for inflammation).
- IL-4 (20 ng/mL): M2-polarizing stimuli (positive control for healing).
- qRT-PCR reagents: Primers for M1 markers (iNOS, TNF-α, CD86) and M2 markers (Arg1, CD206, IL-10).
- Flow cytometry antibodies: Anti-CD86-FITC (M1), Anti-CD206-PE (M2).
Procedure:
- Cell Seeding: Seed macrophages onto test substrates at 5 x 10^4 cells/cm² in complete medium. Allow to adhere for 6 hours.
- Stimulation: Replace medium with serum-free medium containing the appropriate stimuli (LPS/IFN-γ, IL-4, or medium alone). For test coatings, use serum-free medium only.
- Incubation: Culture cells for 48 hours.
- Analysis:
- Gene Expression: Harvest cells in TRIzol. Perform RNA extraction, cDNA synthesis, and qRT-PCR. Calculate fold-change in M1/M2 marker expression relative to uncoated control using the 2^(-ΔΔCt) method.
- Surface Markers: Detach cells gently. Stain with anti-CD86 and anti-CD206 antibodies for 30 min on ice. Analyze by flow cytometry. Report the percentage of double-negative, M1 (CD86+), M2 (CD206+), and double-positive populations.
- Cytokine Secretion: Collect conditioned medium. Analyze TNF-α (M1) and IL-10 (M2) secretion via ELISA.
Visualizations
Foreign Body Response Pathway and Intervention Points
Coating Development and Evaluation Workflow
The Scientist's Toolkit: Key Research Reagent Solutions
Table 3: Essential Materials for FBR Mitigation Research
| Reagent / Material | Function & Rationale |
|---|---|
| Zwitterionic Monomers (SBMA, CBMA) | Synthesize ultra-low fouling polymer brushes that resist non-specific protein adsorption via a strong hydration layer. |
| Dopamine Hydrochloride | Enables substrate-independent surface priming via self-polymerization into polydopamine, allowing secondary conjugation. |
| Recombinant Cytokines (IL-4, IL-10, IL-13) | Used as coating payloads or in vitro stimuli to polarize macrophages toward the pro-healing M2 phenotype. |
| RGD Peptide (Cyclo(Arg-Gly-Asp-D-Phe-Lys)) | A stable, cyclic integrin-binding peptide for creating ECM-mimetic surfaces that promote specific cell adhesion. |
| Dexamethasone-Loaded PLGA Microparticles | A controlled-release system for sustained local delivery of a potent anti-inflammatory corticosteroid. |
| Anti-CD86 & Anti-CD206 Antibodies | Essential flow cytometry markers for identifying and quantifying classical (M1) and alternative (M2) macrophages. |
| Bicinchoninic Acid (BCA) Assay Kit | Standard colorimetric method for quantifying total protein adsorbed onto a material surface. |
| LPS (Lipopolysaccharide) from E. coli | Toll-like receptor 4 agonist used as a standard in vitro stimulus to induce pro-inflammatory (M1) macrophage activation. |
Application Notes for Biomedical Implants & Prosthetics
1.0 Introduction & Thesis Context The advancement of active biomedical implants (e.g., pacemakers, neurostimulators, advanced prosthetic limbs) is critically constrained by energy system performance. The core thesis posits that next-generation prosthetics and implants require fully integrated, autonomous energy systems that maximize operational lifespan and minimize invasive replacement surgeries. This necessitates a tripartite focus: extending primary battery longevity, optimizing transcutaneous wireless power transfer (WPT), and scavenging endogenous energy via harvesting. These systems must operate within stringent biocompatibility, size, and safety (thermal/SAR) limits.
2.0 Quantitative Data Summary
Table 1: Comparison of Contemporary Implantable Battery Chemistries
| Chemistry | Energy Density (Wh/kg) | Cycle Life (to 80% capacity) | Key Advantage for Implants | Major Limitation |
|---|---|---|---|---|
| Lithium-Iodine (Li/I₂) | ~250 | N/A (Primary) | Ultra-high reliability & longevity (≈10 yrs) | Low power, primary only |
| Lithium-Carbon Monofluoride (Li/CFₓ) | ~350-500 | N/A (Primary) | Highest energy density for primary cells | Cannot be recharged wirelessly |
| Lithium-Ion (LCO, LFP) | 150-200 | 500-2000+ | Rechargeable, high power | Degradation accelerated by body temp, cycling |
| Solid-State Thin-Film | 100-300 | 10,000+ | Excellent safety, long cycle life | Lower energy density, manufacturing cost |
Table 2: Wireless Charging & Energy Harvesting Modalities
| Modality | Typical Power Achieved in vivo | Efficiency | Key Application | Primary Challenge |
|---|---|---|---|---|
| Inductive Coupling (WPT) | 10 mW - 5 W | 60-85% (transcutaneous) | High-power devices (prosthetic motors, LVADs) | Coil misalignment, tissue heating |
| Radio Frequency (RF) Harvesting | 1 µW - 100 µW | <1% (ambient) | Ultra-low-power sensors | Extremely low & variable ambient power |
| Piezoelectric (Kinetic) | 10 µW - 4 mW/cm³ | Varies with activity | Pacemakers, joint implants | Biocompatibility of materials, inconsistent input |
| Thermoelectric Generators (TEG) | 10 µW - 100 µW/cm² (ΔT=5°C) | 3-5% | Deep-body implants | Small core-to-skin temperature gradient |
| Biofuel Cells (Glucose/O₂) | 10 µW - 100 µW/cm² | N/A | Low-power sensors | Long-term stability & power density |
3.0 Experimental Protocols
Protocol 3.1: Accelerated Aging Test for Implantable Li-Ion Batteries Objective: To model 10-year battery degradation under simulated body conditions in 6 months. Materials: CR2032-type Li-ion cells (LFP cathode), environmental chamber, battery cycler, electrochemical impedance spectrometer (EIS). Procedure:
- Baseline Characterization: Measure initial capacity (C₀) via full discharge at C/10 rate. Perform EIS at 50% state-of-charge (SOC).
- Conditioning: Place cells in environmental chamber set to 37°C ± 0.5°C (core body temperature).
- Stress Cycling: Apply accelerated charge/discharge cycles:
- Charge at 1C to 4.2V, constant voltage hold until current drops to C/20.
- Discharge at 1C to 2.5V cut-off.
- Repeat continuously.
- Monitoring: Every 72 hours, pause cycling to perform a reference capacity test (C/10 discharge) and EIS measurement.
- Endpoint: Test until cell capacity degrades to 80% of C₀. Record total cycles completed.
- Data Analysis: Fit capacity fade data to square-root-of-time kinetic model (C = C₀ - k√t). Use EIS data to track increase in charge-transfer resistance.
Protocol 3.2: In vitro Evaluation of Transcutaneous Wireless Power Transfer Efficiency Objective: To quantify WPT efficiency and Specific Absorption Rate (SAR) under misalignment. Materials: Paired Litz wire coils (Tx external, Rx implantable), network analyzer, phantom tissue solution (0.9% NaCl with 0.24 S/m conductivity), infrared thermal camera, 3-axis positioning stage. Procedure:
- Coil Characterization: Use network analyzer to measure self-inductance (L), resistance (R), and quality factor (Q) of each coil at target frequency (e.g., 6.78 MHz).
- Phantom Setup: Submerge Rx coil in tissue phantom at 2cm depth (simulating subcutaneous implant). Fix Tx coil parallel above phantom surface.
- Alignment Optimization: Align coils coaxially. Use network analyzer to measure S₂₁ parameters and calculate peak efficiency (η_peak).
- Misalignment Study: Using positioning stage, introduce lateral misalignment (0-50% of coil diameter) and angular deviation (0-30°). Record S₂₁ and efficiency (η) at each step.
- Thermal Assessment: Drive Tx coil at nominal operating power for 30 minutes. Use IR camera to map surface temperature rise of phantom. Calculate SAR distribution.
- Analysis: Plot η vs. misalignment. Ensure peak SAR remains below regulatory limit (1.6 W/kg averaged over 1g tissue).
Protocol 3.3: Characterization of Piezoelectric Energy Harvester for Prosthetic Joint Objective: To measure power output from a packaged piezoelectric cantilever under simulated gait loading. Materials: PZT-5H cantilever beam, rectifying circuit, programmable mechanical shaker, resistive load bank, oscilloscope, encapsulation material (medical-grade PDMS). Procedure:
- Device Packaging: Encapsulate PZT cantilever in PDMS for moisture and bio-fluid protection.
- Mechanical Calibration: Mount packaged harvester on shaker. Program shaker to replicate acceleration profile of knee joint during walking (approx. 1-3g at 1-2 Hz).
- Electrical Characterization: Connect harvester to a full-wave bridge rectifier and storage capacitor. Connect a variable resistor as load.
- Load Sweep: Vary load resistance (1 kΩ to 10 MΩ). For each load (RL), measure RMS voltage (Vout) across it using the oscilloscope.
- Power Calculation: Calculate output power as Pout = (Vout)² / RL. Identify the optimal load resistance (Ropt) for maximum power transfer.
- Durability Test: Subject the harvester to 1 million cycles at Ropt. Monitor Pout degradation.
4.0 Diagrams
Diagram 1: Implant Energy System Integration
Diagram 2: WPT Efficiency Optimization Workflow
5.0 The Scientist's Toolkit: Research Reagent Solutions
Table 3: Essential Materials for Implantable Energy System Research
| Item/Reagent | Function in Research | Key Consideration for Implants |
|---|---|---|
| PZT-5H or AlN Wafers | Piezoelectric material for kinetic energy harvesting. AlN is CMOS-compatible & biocompatible. | Biocompatibility of lead-based PZT vs. lower efficiency of lead-free alternatives. |
| Medical-Grade PDMS (e.g., Sylgard 184) | Encapsulation and packaging to protect electronics from bio-fluids. | Long-term stability, permeability to moisture, and compliance with ISO-10993. |
| Litz Wire | Fabrication of WPT coils to minimize AC resistance at high frequencies (e.g., 6.78 MHz). | Flexibility for shaping, ability to be coated with biocompatible insulation. |
| Phantom Tissue Gel (0.9% NaCl, Agar) | Electromagnetic & thermal simulation of human tissue for in vitro WPT safety testing. | Electrical conductivity must match target tissue (muscle, skin) at test frequency. |
| LiFePO₄ (LFP) Cathode Material | Active material for rechargeable implantable battery anodes. Offers stability and safety. | Cycle life performance at 37°C, tolerance to intermittent charging from harvesters. |
| Supercapacitor (e.g., Tantalum) | Buffer storage for pulsed energy harvesting, handles high burst power. | Leakage current (self-discharge) and performance under low-voltage conditions. |
| Anisotropic Conductive Film (ACF) | Bonding flexible harvesting or coil components to rigid PCBs within implant. | Bond strength reliability under mechanical flexing and fluid exposure. |
Application Notes
Biomedical engineering research on prosthetics and implants is fundamentally shifting from passive, biocompatible devices to active, infection-resistant systems. This paradigm is critical, as biofilm-associated infections on medical devices are a leading cause of implant failure, morbidity, and high healthcare costs. This document outlines the three principal, often integrated, strategies: intrinsic antimicrobial materials, controlled-release drug-eluting designs, and surface technologies that inhibit biofilm formation.
- Antimicrobial Materials: This strategy incorporates antimicrobial agents (e.g., silver nanoparticles, copper ions, quaternary ammonium compounds, antimicrobial peptides) directly into the bulk material (e.g., polymer, metal alloy, ceramic) of the implant. The goal is to create a material that inherently resists microbial colonization and proliferation throughout its lifetime, providing a first line of defense.
- Drug-Eluting Designs: These are advanced coating or matrix systems engineered to release therapeutic agents (antibiotics, antifungals, anti-inflammatory drugs) in a controlled manner at the implant-tissue interface. The release can be passive (diffusion-based), triggered by the infection microenvironment (pH, enzymes), or actively modulated. This provides a high local concentration of drug while potentially minimizing systemic side effects.
- Anti-biofilm Surfaces: These are surface-engineered topographies or chemistries designed to prevent the initial attachment of microbes or disrupt biofilm communication (quorum sensing). Examples include nanopatterned surfaces inspired by insect wings, non-fouling hydrophilic polymer brushes (e.g., PEG), and surfaces that degrade bacterial signaling molecules.
The convergence of these strategies—for example, a drug-eluting hydrogel coating on an antimicrobial titanium alloy with a nanopatterned surface—represents the forefront of next-generation "smart" implants in orthopedic, dental, and cardiovascular applications.
Protocols
Protocol 1: In Vitro Assessment of Biofilm Formation on Surface-Modified Titanium Discs
- Objective: To quantify the efficacy of a novel nanopatterned, silver nanoparticle-coated titanium surface against Staphylococcus aureus biofilm formation.
- Materials: Titanium discs (12.7mm dia.), polished control, and test surfaces. S. aureus (ATCC 6538). Tryptic Soy Broth (TSB). 96-well plate. Crystal Violet stain. Acetic acid (33%). Microplate reader.
- Procedure:
- Sterilize all titanium discs via autoclaving.
- Inoculate TSB with a single colony of S. aureus and grow overnight at 37°C.
- Dilute the overnight culture 1:100 in fresh TSB.
- Place individual titanium discs in wells of a 24-well plate. Add 2 mL of diluted bacterial suspension per well. Include wells with broth only (negative control).
- Incubate statically for 24h or 48h at 37°C to allow biofilm formation.
- Carefully aspirate planktonic culture and rinse discs gently three times with PBS to remove non-adherent cells.
- Fix biofilms by adding 2 mL of 99% methanol per well for 15 minutes. Aspirate and air dry.
- Stain with 2 mL of 0.1% (w/v) Crystal Violet solution per well for 5 minutes.
- Rinse discs thoroughly under running tap water until no more stain elutes.
- Elute the bound stain by adding 2 mL of 33% acetic acid per well and incubating on a shaker for 30 minutes.
- Transfer 200 µL of eluate to a 96-well plate. Measure absorbance at 570 nm using a microplate reader.
Protocol 2: Release Kinetics of Vancomycin from a Biodegradable Polymer Coating
- Objective: To characterize the release profile of vancomycin from a poly(D,L-lactic-co-glycolic acid) (PLGA) coating on a stainless-steel substrate under physiological conditions.
- Materials: PLGA-coated test coupons. Phosphate Buffered Saline (PBS, pH 7.4). Sodium azide (0.02% w/v). HPLC system with C18 column. Shaking water bath at 37°C.
- Procedure:
- Prepare release medium: PBS with 0.02% sodium azide to prevent microbial growth.
- Place individual coated coupons in 20 mL glass vials containing 10.0 mL of release medium.
- Incubate vials in a shaking water bath at 37°C, 60 rpm.
- At predetermined time points (e.g., 1, 3, 6, 12, 24, 48, 72h, then daily for 28 days), remove the entire release medium from each vial and replace with 10.0 mL of fresh, pre-warmed medium.
- Analyze the collected samples for vancomycin concentration using a validated HPLC method (e.g., mobile phase: 10% acetonitrile/90% 25mM potassium phosphate buffer, pH 3.0; flow rate: 1.0 mL/min; detection: UV at 280 nm).
- Calculate cumulative release as a percentage of the total drug loaded (determined via complete dissolution of a separate set of coated coupons).
Data Presentation
Table 1: Comparative Efficacy of Antimicrobial Implant Surface Strategies
| Strategy | Example Agent/Technique | Target Microbes (Key Examples) | Typical Efficacy (Log Reduction in CFU/cm²)* | Key Advantages | Primary Limitations |
|---|---|---|---|---|---|
| Antimicrobial Materials | Silver Nanoparticles (AgNPs) | S. aureus, E. coli, P. aeruginosa | 2.0 - 4.0 | Broad-spectrum, long-lasting (if not leached) | Potential cytotoxicity, bacterial resistance, leaching kinetics |
| Copper-doped Bioactive Glass | S. epidermidis, C. albicans | 1.5 - 3.5 | Osteogenic properties, sustained ion release | Slower antimicrobial onset, color change | |
| Drug-Eluting Designs | Vancomycin-loaded PLGA coating | MRSA, S. epidermidis | 3.0 - 6.0+ | High, localized potency; tunable release | Limited duration; may promote resistance; burst release risk |
| pH-responsive Chitosan/Heparin film (release at low pH) | Mixed species in acidic infection sites | 2.5 - 4.5 | "Smart," triggered release; reduces off-target effect | Complex fabrication; requires specific trigger | |
| Anti-biofilm Surfaces | Nanopatterned Topography (mimicking cicada wing) | Gram-positive & Gram-negative bacteria | 1.0 - 2.5 (via contact-killing) | Physical mechanism, low resistance risk; durable | Can be fouled by proteins; complex manufacturing |
| Polyethylene Glycol (PEG) Brush Coating | Broad-spectrum (prevents attachment) | Up to 2.0 (prevention) | Excellent initial fouling resistance | Can degrade oxidatively in vivo; non-biocidal |
*Log reduction compared to unmodified control surface after 24-48h of incubation. Efficacy is highly dependent on specific formulation, concentration, and test method.
Visualizations
Diagram 1: Triggered Drug Release from a Smart Implant Coating
Diagram 2: Biofilm Lifecycle & Intervention Points
The Scientist's Toolkit
Table 2: Essential Research Reagents & Materials for Implant Infection Studies
| Item | Function & Relevance in Research |
|---|---|
| Titanium Alloy (Ti-6Al-4V) Discs | Standard substrate for orthopedic/dental implant research. Can be polished, anodized, or coated to test surface modifications. |
| Poly(D,L-lactic-co-glycolic acid) (PLGA) | A biodegradable, FDA-approved polymer used to create controlled-release drug-eluting coatings. The lactide:glycolide ratio controls degradation rate. |
| Silver Nanoparticles (AgNPs, 20-50nm) | A broad-spectrum antimicrobial agent incorporated into materials or coatings. Research focuses on stabilizing nanoparticles to achieve sustained release and minimize cytotoxicity. |
| Crystal Violet Stain | A basic dye used in standard colorimetric assays (like Protocol 1) to quantify total biofilm biomass adherent to a surface. |
| Calgary Biofilm Device (CBD) / MBEC Assay | A high-throughput system using a lid with pegs that fits into a 96-well plate. Used to grow biofilms and efficiently test the efficacy of antimicrobial agents against them. |
| Quorum Sensing Inhibitors (e.g., Hamamelitannin analogs) | Small molecules used in research to interfere with bacterial cell-cell communication (e.g., S. aureus Agr system), potentially preventing virulence and biofilm maturation without killing bacteria. |
| Live/Dead BacLight Bacterial Viability Kit | A two-component fluorescent stain (SYTO9 & propidium iodide) used in confocal microscopy to visualize live (green) vs. dead/compromised (red) bacteria within a biofilm on a test surface. |
| Simulated Body Fluid (SBF) | An ion-rich solution with pH and ionic concentration similar to human blood plasma. Used to study the formation of hydroxyapatite on bioactive surfaces and how this interacts with antimicrobial function. |
Application Notes
The integration of Data-Driven Optimization (DDO) into biomedical implants and prosthetics represents a paradigm shift from static, reactive designs to dynamic, adaptive systems. This approach leverages Artificial Intelligence and Machine Learning (AI/ML) models trained on multimodal sensor data to predict device performance degradation (predictive maintenance) and autonomously adjust device parameters (adaptive control) in real-time.
Table 1: Summary of AI/ML Applications in Implantable/Prosthetic Devices
| Device Class | Primary Data Source | AI/ML Model (Example) | Predictive Maintenance Output | Adaptive Control Action |
|---|---|---|---|---|
| Smart Knee Prosthesis | Embedded Inertial Measurement Units (IMUs), Force Sensors, Acoustic Emission Sensors | Long Short-Term Memory (LSTM) Network | Early wear detection in polyethylene liner; prediction of lubrication failure. | Real-time adjustment of variable-damping actuator to optimize gait stability and energy expenditure. |
| Deep Brain Stimulator (DBS) | Local Field Potentials (LFPs), Electrocorticography (ECoG), Patient Diary/Logs | Reinforcement Learning (RL) Agent | Prediction of battery depletion or lead impedance changes indicating fibrosis. | Closed-loop modulation of stimulation amplitude/frequency in response to detected neural biomarkers (e.g., beta bursts in Parkinson's). |
| Cochlear Implant | Electrodermal response, EEG signals, microphone input | Convolutional Neural Network (CNN) | Monitoring electrode integrity and predicting encapsulation tissue growth. | Dynamic sound processing strategy adaptation based on auditory scene classification and user cognitive load. |
| Cardiac Implantable Electronic Device (CIED) | Intracardiac Electrograms (IEGMs), thoracic impedance, accelerometer data | Anomaly Detection (Isolation Forest) | Prediction of lead fracture or battery end-of-life. | Adjustment of pacing parameters in response to predictive signals of heart failure decompensation. |
Table 2: Key Quantitative Performance Metrics for DDO Systems
| Metric | Traditional Implant | AI/ML-Augmented Implant (Reported Range) | Significance |
|---|---|---|---|
| Mean Time To Failure (MTTF) Prediction Accuracy | N/A (Reactive only) | 85-94% (7-14 day horizon) | Enables proactive clinical intervention. |
| False Alarm Rate for Anomalies | N/A | 2-5% | Minimizes unnecessary clinical overhead. |
| Adaptive Control Latency | N/A (Static or manual adjustment) | 50-200 milliseconds | Enables real-time physiological synchronization. |
| Battery Life Optimization | Fixed depletion curve | 15-30% extension | Reduces replacement surgery frequency. |
Experimental Protocols
Protocol 1: Developing a Predictive Maintenance Model for Polyethylene Wear in Knee Prostheses
Objective: To train an LSTM model to predict component wear severity from acoustic emission (AE) sensor data.
Materials: Instrumented knee prosthesis prototype with embedded AE sensors, multi-axis knee simulator, serum-based lubricant, high-frequency data acquisition system (>1 MHz), computational workstation.
Procedure:
- Accelerated Wear Testing: Mount the instrumented prosthesis on a kinematic knee simulator. Program the simulator to execute gait cycles per ISO 14243. Collect continuous AE time-series data and synchronized load/torque data.
- Ground Truth Labeling: Periodically halt testing (e.g., every 500,000 cycles). Use coordinate-measuring machines (CMM) to quantitatively measure volumetric wear of the polyethylene insert. Assign a wear severity label (e.g., Low, Medium, High) to each preceding AE data segment.
- Data Preprocessing: Segment the raw AE waveform data into 2-second windows corresponding to 2 gait cycles. Extract time-domain (e.g., RMS, kurtosis) and frequency-domain (spectral centroids) features from each window. Normalize features across the dataset.
- Model Training: Structure the feature sequence (20 consecutive windows) as input to the LSTM network. The output is a multi-class prediction of wear severity. Use 70% of data for training, 15% for validation, and 15% for testing. Employ cross-entropy loss and Adam optimizer.
- Validation: Validate model accuracy against CMM-measured wear. Deploy the model on a microcontroller unit (MCU) within a prosthesis prototype for real-time inference.
Protocol 2: Closed-Loop Adaptive Control for a Deep Brain Stimulator
Objective: To implement a Reinforcement Learning (RL) agent that adjusts DBS parameters based on sensed Local Field Potentials (LFPs).
Materials: Pre-clinical rodent model of Parkinsonism, bidirectional DBS system with sensing/stimulation capabilities, neural recording amplifier, RL software framework (e.g., OpenAI Gym custom environment).
Procedure:
- Biomarker Identification: Implant DBS leads in the subthalamic nucleus (STN). Record LFPs from the same leads in the parkinsonian model during rest and movement. Identify the power in the beta band (13-30 Hz) as the pathological biomarker.
- Environment Definition: Define the RL environment. State: Normalized beta band power. Action: Increment/decrement stimulation voltage by a discrete step (e.g., 0.1V) within a safe range. Reward: +1 for beta power suppression below a therapeutic threshold, -1 for exceeding it, -10 for violating safety limits.
- Agent Training: Train a Deep Q-Network (DQN) agent in the simulated environment. The agent learns a policy mapping observed beta power to optimal voltage adjustments.
- In Vivo Validation: Deploy the trained policy on the real-time DBS system. Continuously monitor beta power and allow the agent to adjust stimulation every 500ms. Assess therapeutic efficacy (e.g., reduction in rigidity) and side effects compared to static, high-frequency stimulation.
The Scientist's Toolkit: Research Reagent Solutions
| Item | Function in DDO for Implants |
|---|---|
| Biocompatible, Hermetic Sensor Packages | Encapsulates IMUs, strain gauges, and chemical sensors for long-term in vivo operation without biofouling or leakage. |
| Ultra-Low-Power AI Accelerator MCUs (e.g., Arm Cortex-M55+Ethos-U55) | Enables on-device, real-time inference of ML models, drastically reducing power consumption versus transmitting raw data. |
| Synthetic Biomedical Time-Series Data Generators (e.g., TSGAN) | Generates realistic, labelled sensor data for initial model training when in vivo data is scarce or expensive to acquire. |
| Federated Learning (FL) Software Frameworks (e.g., Flower, NVIDIA FLARE) | Enables training ML models across multiple patients' devices without centralizing sensitive personal health data, preserving privacy. |
| Electrochemical Impedance Spectroscopy (EIS) Circuits | Integrated into implants to monitor electrode-tissue interface stability, a key signal for predictive maintenance of stimulating leads. |
Visualizations
DDO Closed-Loop for Implants
RL for Adaptive DBS Control
Bench to Bedside: Validation Frameworks and Comparative Analysis of Modern Implant Technologies
Within biomedical engineering research for prosthetics and implants, the transition from a novel design concept to a clinically approved device is governed by a rigorous validation framework. Validation provides objective evidence that a device consistently meets user needs and intended uses, fulfilling defined requirements. This process is critical for ensuring safety, efficacy, and quality. Regulatory standards from the International Organization for Standardization (ISO), ASTM International, and regulatory bodies like the U.S. Food and Drug Administration (FDA) and the European Union's Medical Device Regulation (EU MDR) provide the structured pathways for this evidence generation. This document outlines key requirements and provides application notes and protocols aligned with these frameworks for research and development.
The table below summarizes the primary standards and regulations relevant to the validation of prosthetic and implantable devices.
| Regulatory Body / Standards Organization | Key Document(s) | Primary Focus for Validation | Key Quantitative Requirements/Outputs |
|---|---|---|---|
| ISO | ISO 13485:2016 | Quality Management System (QMS) for design, development, production, and servicing. Foundation for all validation activities. | Defined procedures for design validation (clause 7.3.7), process validation (clause 7.5.6), and monitoring of measurement systems. |
| ISO | ISO 14971:2019 | Application of risk management to medical devices. Informs validation scope and acceptance criteria. | Risk acceptability matrix (e.g., 5x5: Probability x Severity). Residual risk evaluation post-mitigation. |
| ASTM International | ASTM F04 Committee (Medical and Surgical Devices) | Material-specific, mechanical testing, and performance standards. Provides standardized test methods. | Quantitative pass/fail criteria for properties (e.g., fatigue strength, wear rate, polymer crystallinity). |
| U.S. FDA | 21 CFR Part 820 (Quality System Regulation) | Comprehensive QSR for device design, manufacturing, packaging, labeling, and storage. | Design Validation (§820.30(g)): Must include testing of production units under actual or simulated use conditions. |
| EU MDR | Regulation (EU) 2017/745 | Full life-cycle safety and performance requirements for market access in the EU. | Clinical Evaluation (Annex XIV): Requires clinical data confirming safety, performance, and benefit-risk. |
| Harmonized | ISO 10993-1:2018 (Biological Evaluation) | Evaluation of biological risk from material constituents. | Testing matrix based on device nature and body contact (e.g., cytotoxicity, sensitization, implantation). |
Application Notes & Experimental Protocols
Application Note: Integrating Risk Management (ISO 14971) into Design Validation
Validation activities must be traceable to identified risks. For a novel cementless femoral stem implant, a risk identified as "Aseptic loosening due to inadequate osseointegration" would drive specific validation protocols. The mitigation measure "Surface coating to promote bone ingrowth" requires validation of coating adhesion strength, bioactivity, and long-term stability.
Protocol: Mechanical Fatigue Validation per ASTM F2068 (Standard for Femoral Prostheses)
Title: Protocol for Fatigue Testing of a Metallic Femoral Hip Implant Stem.
1. Objective: To validate that the implant stem design withstands 10 million cycles of physiological loading without fracture or permanent deformation exceeding specified limits.
2. Materials & Reagent Solutions:
- Test Sample: Five (5) final, sterilized femoral stems.
- Apparatus: Servohydraulic or electromechanical test frame with environmental chamber (maintained at 37±2°C in simulated physiological fluid, e.g., 0.9% NaCl).
- Fixturing: Polyurethane foam block (density 0.64 g/cm³, per ASTM F1839) or composite bone analogue to simulate femur.
- Load Application: Custom fixture to apply cyclic axial-compressive and bending loads.
3. Methodology: 1. Fixture Setup: Securely pot the distal 1/3 of the stem in the simulated bone medium within the test fixture. 2. Load Calibration: Define the load profile based on ASTM F2068 (e.g., peak load scaled to patient weight, typically 230% body weight for severe duty). 3. Testing: Apply cyclic load at a frequency ≤5 Hz to minimize fluid heating. Monitor for failure (audible, visual crack, or displacement limit breach). 4. Endpoint: Continue testing of each sample to 10 million cycles or failure. 5. Post-Test Analysis: Visually inspect and perform dye penetrant check on all samples. Measure permanent deformation.
4. Acceptance Criteria: All five samples shall complete 10 million cycles without fracture. Permanent deformation shall not exceed 0.5 mm at the measurement point defined in the test plan.
Protocol: Biocompatibility Assessment Workflow per ISO 10993-1
Title: Workflow for Biological Evaluation of a New Implant Polymer.
Diagram Title: Biocompatibility Assessment Workflow for Implants
The Scientist's Toolkit: Key Research Reagent Solutions
| Item / Reagent | Function in Validation Context |
|---|---|
| Simulated Body Fluid (SBF) | Used in in vitro bioactivity testing (e.g., for hydroxyapatite coatings) to assess bone-bonding ability by monitoring apatite formation. |
| Cell Lines (e.g., MG-63, L929) | Standardized cells for cytotoxicity testing (ISO 10993-5). Essential for initial biological safety screening of materials and extracts. |
| Polyurethane Foam Blocks (ASTM F1839) | Simulate cancellous bone for consistent mechanical testing (e.g., stem fixation, screw pull-out). Provides uniform, comparable results. |
| Fluorescent Stains (e.g., DAPI, Phalloidin) | Used in in vitro validation of cell adhesion and proliferation on implant surfaces via fluorescence microscopy. |
| Wear Simulator Lubricant (e.g., Calf Serum) | Simulates synovial fluid in joint implant wear testing (ASTM F1714, ISO 14242). Protein content is critical for realistic wear patterns. |
| Reference Materials (ASTM / NIST) | Certified materials (e.g., polyethylene, metal alloys) used to calibrate equipment and validate test methods for mechanical/chemical analysis. |
Validation Under EU MDR: Clinical Evaluation & Post-Market Follow-up
The EU MDR emphasizes clinical evidence. For a novel implant, validation is incomplete without a Clinical Evaluation Plan (CEP) and Post-Market Clinical Follow-up (PMCF) Plan. The logical relationship between these activities is shown below.
Diagram Title: MDR Clinical Evidence Lifecycle for Implants
This application note, framed within a broader thesis on Biomedical Engineering Prosthetics and Implants Design Research, provides a comparative analysis of three dominant material platforms in orthopedic applications: Titanium Alloys, Polyetheretherketone (PEEK), and Bioceramics. The focus is on their material properties, biological performance, and protocols for preclinical evaluation to inform researchers, scientists, and development professionals.
Quantitative Material Property Comparison
Table 1: Core Mechanical & Physical Properties for Orthopedic Implants
| Property | Titanium Alloy (Ti-6Al-4V, ELI) | PEEK (Neat, Implant Grade) | Bioceramics (Alumina, Zirconia) | Clinical Significance |
|---|---|---|---|---|
| Elastic Modulus (GPa) | 110 - 125 | 3 - 4 | 200 - 380 (Alumina), ~210 (Y-TZP) | Match to bone (10-30 GPa) to reduce stress shielding. |
| Tensile Strength (MPa) | 860 - 965 | 90 - 100 | 300 - 500 (Compressive >2000 MPa) | Resistance to fracture under load. |
| Fatigue Strength (MPa) | ~500 (10^7 cycles) | ~70 (10^7 cycles) | High, but brittle fracture risk | Long-term cyclic loading resistance. |
| Fracture Toughness (MPa·m^1/2) | 50 - 115 | 3 - 5 | 3 - 6 (Alumina), 6 - 10 (Y-TZP) | Resistance to crack propagation. |
| Density (g/cm³) | ~4.43 | ~1.32 | ~3.9 - 6.0 | Impacts implant weight and imaging artifact. |
| Radiolucency | Opaque | Radiolucent | Opaque | PEEK allows for post-op imaging assessment. |
Table 2: Biological & Functional Performance Metrics
| Parameter | Titanium Alloy | PEEK | Bioceramics (Inert: Alumina/Zirconia) | Key Consideration |
|---|---|---|---|---|
| Osseointegration | Excellent (with surface treatment) | Poor (Bioinert) | Excellent (with HA coating) or poor (smooth) | Direct bone bonding critical for stability. |
| Biocompatibility | Excellent (High corrosion resistance) | Excellent (Inert, non-cytotoxic) | Excellent (Highly inert) | Systemic and local tissue response. |
| Wear Rate | Moderate (Can be high vs. UHMWPE) | Low (as bearing surface) | Extremely Low (for bearing surfaces) | Crucial for joint arthroplasty longevity. |
| Ion Release | Potential release of Al, V (mitigated by Ti-6Al-4V ELI or Ti-6Al-7Nb) | None | None | Risk of metallosis and adverse biological reactions. |
| Antibacterial Potential | Limited (can be conferred via surface mod.) | Limited (requires additive/coating) | Limited (surface-dependent) | Critical for preventing implant-associated infections. |
Experimental Protocols for In Vitro Evaluation
Protocol 2.1: Standardized Osteoblast Adhesion and Proliferation Assay
Aim: To quantitatively compare early cellular response on Ti-6Al-4V, PEEK, and Bioceramic (Zirconia) surfaces.
Materials: See "Scientist's Toolkit" below. Workflow:
- Sample Preparation: Sterilize 12mm diameter discs (n=5 per material) by autoclaving (PEEK, Ceramics) or ethanol/UV for Ti alloy. Place in 24-well plate.
- Surface Pre-conditioning: Immerse samples in Dulbecco's Phosphate Buffered Saline (DPBS) for 1 hour at 37°C.
- Cell Seeding: Seed MC3T3-E1 pre-osteoblasts at 20,000 cells/cm² in α-MEM + 10% FBS + 1% P/S.
- Adhesion Phase (4h): Incubate (37°C, 5% CO₂). After 4h, aspirate media, rinse with DPBS to remove non-adherent cells.
- Proliferation Phase (1, 3, 7 days): For later time points, refresh media every 2 days.
- Quantification: At each endpoint, lyse cells and quantify DNA content using PicoGreen assay (Thermo Fisher, P11496). Use a standard curve for conversion to cell number.
- Statistical Analysis: Perform one-way ANOVA with Tukey's post-hoc test (p < 0.05).
Diagram Title: Osteoblast Adhesion & Proliferation Assay Workflow
Protocol 2.2: Dynamic Mechanical Fatigue Simulation (ASTM F1717)
Aim: To evaluate the structural durability of spinal implant constructs under cyclic loading.
Materials: Standardized posterior spinal fixation construct (two rods, four pedicle screws). Materials: Ti-6Al-4V rods, Carbon-fiber reinforced PEEK (CFR-PEEK) rods, Zirconia-toughened alumina rods. Workflow:
- Construct Assembly: Assemble constructs per ASTM F1717 in a "parallelogram" configuration within ultra-high molecular weight polyethylene (UHMWPE) blocks.
- Fixture on Tester: Mount construct on a servo-hydraulic mechanical tester in a bath of 9g/L NaCl saline at 37°C.
- Load Application: Apply a cyclic axial load between a predefined minimum (e.g., 50N) and maximum load (based on 70% of ultimate load of weakest material). Frequency: 2-5 Hz.
- Cycle Monitoring: Run test until construct failure (defined as rod fracture, screw breakage, or permanent deformation exceeding 5mm) or completion of 5 million cycles.
- Post-Analysis: Document cycles to failure. Examine fracture surfaces via Scanning Electron Microscopy (SEM) to determine failure mode (ductile fatigue, brittle fracture, etc.).
Signaling Pathways in Material-Mediated Osseointegration
Diagram Title: Material Surface Interaction with Osteogenic Pathways
The Scientist's Toolkit: Key Research Reagent Solutions
Table 4: Essential Materials for Orthopedic Biomaterial Research
| Item / Reagent | Function / Application | Example Supplier / Cat. No. (Illustrative) |
|---|---|---|
| MC3T3-E1 Subclone 4 | Pre-osteoblast cell line for standardized in vitro biocompatibility & differentiation assays. | ATCC CRL-2593 |
| Quant-iT PicoGreen dsDNA Assay Kit | Fluorometric quantification of cell proliferation on material surfaces via DNA content. | Thermo Fisher Scientific, P11496 |
| Simulated Body Fluid (SBF) | In vitro bioactivity test for apatite formation on surfaces (Kokubo protocol). | Prepared in-house per ISO 23317. |
| AlamarBlue Cell Viability Reagent | Resazurin-based assay for measuring metabolic activity of cells on materials. | Thermo Fisher Scientific, DAL1025 |
| Recombinant Human BMP-2 | Positive control growth factor for osteogenic differentiation studies in media. | PeproTech, 120-02 |
| TRAP Staining Kit (Leukocyte) | Detection of osteoclast activity for assessing bone resorption parameters. | Sigma-Aldrich, 387A-1KT |
| ASTM F1717 Standard UHMWPE Blocks | For consistent mechanical testing of spinal implant constructs. | e.g., Wyoming Test Fixtures |
| 0.9% NaCl Solution, Sterile | Physiological saline for in vitro conditioning and mechanical test bath. | Baxter, 2F7124 |
Application Notes
In the advancement of upper-limb prosthetic control, three primary paradigms represent significant milestones: Conventional Myoelectric Control (MEC), Pattern Recognition Control (PR), and the surgical-biological integration of Targeted Muscle Reinnervation (TMR). This document details their operational principles, comparative performance metrics, and experimental protocols for evaluation within biomedical engineering research.
1.1 Conventional Myoelectric Control (MEC) MEC utilizes the amplitude of electromyographic (EMG) signals from one or two antagonistic muscle sites (e.g., wrist flexors and extensors) to control a single degree of freedom (DoF), such as hand open/close or wrist rotation. Control is sequential and requires mode switching for multi-DoF devices. It is robust but non-intuitive and cognitively burdensome.
1.2 Pattern Recognition Control (PR) PR processes multi-channel EMG signals from residual limb muscles using machine learning algorithms (e.g., linear discriminant analysis, convolutional neural networks) to classify distinct muscle activation patterns into intended movements. This allows for simultaneous or direct control of multiple DoFs, offering more intuitive prosthesis operation.
1.3 Targeted Muscle Reinnervation (TMR) TMR is a surgical procedure that redirects amputated nerve endings (e.g., median, ulnar, radial) to reinnervate new muscle targets (e.g., segments of pectoralis major). These reinnervated muscles act as biological amplifiers, producing distinct EMG signals for multiple lost limbs upon attempted movement. TMR is often combined with PR for optimal multifunctional control.
1.4 Quantitative Performance Comparison
Table 1: Comparative Metrics of Control Paradigms
| Metric | Conventional MEC | Pattern Recognition (PR) | TMR + PR |
|---|---|---|---|
| Control Sites Required | 1-2 | 4-16 (array) | 4-8 (over reinnervated sites) |
| Typical DoFs Controlled | 1-2 (sequential) | 2-4 (simultaneous) | 3-6 (simultaneous) |
| Motion Completion Time (s)* | 4.8 ± 1.2 | 3.1 ± 0.9 | 2.5 ± 0.7 |
| Classification Accuracy (%)* | N/A (direct control) | 92.5 ± 3.5 | 96.8 ± 2.1 |
| User Mental Demand (NASA-TLX)* | High (65-80) | Moderate (40-60) | Low-Moderate (30-50) |
| Clinical Adoption Stage | Standard of Care | Advanced Commercial | Specialized Centers/Research |
*Representative data aggregated from recent clinical studies (2021-2023). Motion Completion Time is for a standardized multi-step task (e.g., Box and Blocks).
Experimental Protocols
2.1 Protocol: EMG Signal Acquisition & Feature Extraction for PR
Objective: To record high-quality EMG data for training and testing a pattern recognition classifier. Materials: See Research Reagent Solutions (Table 2). Procedure:
- Site Preparation: Clean skin over target muscles with alcohol wipes. For TMR subjects, identify reinnervated muscle zones via palpation during attempted phantom movements.
- Electrode Placement: Apply adhesive surface EMG electrodes in a bipolar configuration. For PR, use an 8-channel array spaced ~2cm apart over the forearm residuum. For TMR, place pairs over each reinnervated region (e.g., pectoralis heads).
- Signal Acquisition Setup: Connect electrodes to an amplifier/biopotential acquisition system (e.g., Delsys Trigno). Set sampling rate to 1000 Hz, band-pass filter between 20-450 Hz, and apply a 60 Hz notch filter.
- Data Collection Protocol: a. Rest Period: Record 30 seconds of baseline muscle activity at rest. b. Cue-Based Activation: Using a visual guide, prompt the user to perform specific muscle contractions (e.g., "hand open," "wrist supination") corresponding to target movements. Each contraction is held for 5 seconds, followed by 5 seconds of rest. Repeat each movement 10 times. c. Real-Time Control Trial: After classifier training (offline), users perform functional tasks (e.g., clothespin relocation, Box and Blocks test) while EMG and task performance metrics are recorded.
2.2 Protocol: Offline Classifier Training & Evaluation
Objective: To develop and validate a movement intent classifier. Procedure:
- Data Segmentation: Segment the raw EMG data from cue-based trials into analysis windows (e.g., 150ms length with 100ms overlap).
- Feature Extraction: For each window, calculate a feature set per channel. Common features include:
- Time-domain: Mean Absolute Value, Waveform Length, Zero Crossings.
- Frequency-domain: Mean/Median Frequency (from power spectral density).
- Classifier Training: Use 70% of the trial data to train a classifier (e.g., Linear Discriminant Analysis or Support Vector Machine). The feature vector for each window serves as input, with the movement label as output.
- Performance Evaluation: Test the trained classifier on the remaining 30% of data. Calculate the Classification Error Rate and generate a confusion matrix.
2.3 Protocol: Surgical TMR Procedure (Animal Model - Murine)
Objective: To establish a validated pre-clinical model for nerve transfer and reinnervation studies. Procedure:
- Animal Preparation: Anesthetize the mouse using isoflurane. Confirm surgical plane. Shave and sterilize the thoracic and axillary region.
- Nerve Exposure: Make an incision over the brachial plexus. Isolate and transect the proximal median nerve. Identify a target motor branch to the sternal head of the pectoralis major and transect it distally.
- Microsurgical Coaptation: Using an operating microscope (25x), align the proximal end of the transected median nerve to the distal end of the target pectoral motor branch. Perform an end-to-end neurorrhaphy using 11-0 nylon suture.
- Outcome Measures (Terminal, 8-12 weeks post-op): a. Functional: Record EMG from the reinnervated pectoralis muscle during electrical stimulation of the transferred median nerve. Measure compound muscle action potential (CMAP) latency and amplitude. b. Histological: Harvest the muscle. Section and stain with Hematoxylin & Eosin (H&E) to assess general morphology and Masson's Trichrome to evaluate fibrosis. Perform immunohistochemistry for neurofilament (axons) and synaptophysin (motor endplates) to quantify reinnervation.
Diagrams
Title: Conventional Myoelectric Control Signal Pathway
Title: Pattern Recognition Control Workflow
Title: TMR Creates New Biological Control Sites
Research Reagent Solutions
Table 2: Essential Materials for Prosthetic Control Research
| Item | Function & Application |
|---|---|
| High-Density EMG Electrode Array | Acquires spatial myoelectric patterns from residual limb muscles for PR algorithm development. |
| Biopotential Data Acquisition System | Amplifies, filters, and digitizes low-voltage EMG signals for analysis (e.g., Delsys Trigno, Biosemi). |
| Linear Discriminant Analysis (LDA) Library | A computationally efficient, real-time capable classifier for decoding movement intent from EMG features. |
| Clinical Outcome Measure Kit | Standardized tools for functional assessment (e.g., Box and Blocks Test, Southampton Hand Assessment Procedure). |
| Isoflurane Anesthesia System | Provides stable, inhalable anesthesia for survival surgeries in animal TMR models. |
| Operative Microscope & Microsuture | Enables precise microsurgical coaptation of nerves (~1mm diameter) in TMR procedures. |
| Anti-Neurofilament Antibody | Immunohistochemical marker for visualizing axonal regeneration into target muscle in TMR studies. |
| Motion Capture System | Quantifies kinematics of prosthetic and intact limb movement during functional task analysis. |
In the research and development cycle of biomedical engineering prosthetics and implants, transitioning from benchtop validation to clinical efficacy is paramount. This phase requires robust, quantitative outcome measures to objectively capture functional gains and patient-reported quality of life (QoL). These measures are not merely endpoints but are integral to trial design, informing patient selection, intervention protocols, and regulatory submission strategies. For advanced neuroprosthetics, osseointegrated implants, and smart orthopedic devices, the synergy between engineered performance and patient-centric outcomes defines clinical success. This document outlines standardized protocols and analytical frameworks for their quantification.
The selection of outcome measures should be hierarchical, spanning from laboratory-based biomechanics to holistic life impact.
Table 1: Hierarchy of Outcome Measures for Prosthetic/Implant Trials
| Domain | Specific Measure | Description & Units | Typical Assessment Timeline | Primary Use Case |
|---|---|---|---|---|
| Body Function & Structure | 6-Minute Walk Test (6MWT) | Distance walked in 6 minutes (meters). | Baseline, 3, 6, 12 months | Lower-limb prosthetics, joint implants |
| Timed Up and Go (TUG) | Time to rise, walk 3m, return, sit (seconds). | Baseline, 3, 6, 12 months | Balance assessment for various implants | |
| Range of Motion (ROM) | Goniometric measure of joint angles (degrees). | Baseline, intra-op, post-op visits | Orthopedic and joint implants | |
| Activity & Participation | Activities-specific Balance Confidence (ABC) Scale | Self-reported confidence in balance (0-100%). | Baseline, 6, 12 months | Fall risk assessment in implant users |
| Prosthetic Limb Users Survey of Mobility (PLUS-M) | Computerized adaptive test for mobility (T-score). | Baseline, quarterly | Lower-limb prosthetic mobility | |
| Toronto Extremity Salvage Score (TESS) | Function after limb-salvage surgery (0-100%). | Post-op 6, 12 months, annually | Orthopedic oncology implants | |
| Quality of Life | EQ-5D-5L | Health status utility index (-0.59 to 1.0) & VAS (0-100). | Baseline, 3, 6, 12 months | Generic QoL for cost-utility analysis |
| Orthotics and Prosthetics User Survey (OPUS) | Modules for satisfaction, QoL, and function. | Annually or at significant follow-up | Comprehensive prosthetic outcome | |
| Device-Specific Metrics | Myoelectric Signal Fidelity | Signal-to-Noise Ratio (SNR) in dB. | During fitting, periodic checks | Neuroprosthetics and myoelectric devices |
| Implant Stability Quotient (ISQ) | Resonance frequency analysis (values 1-100). | Intra-op, post-op visits | Osseointegration for dental/limb implants | |
| Daily Step Count & Gait Symmetry | Via wearable inertial sensors (ratio L/R). | Continuous/periodic monitoring over trial | Real-world activity for all mobility devices |
Experimental Protocols for Key Assessments
Protocol 3.1: Instrumented Gait Analysis for Functional Biomechanics
Objective: To quantify spatiotemporal, kinematic, and kinetic parameters during walking to assess device integration and functional restoration. Materials: 10-camera optoelectronic motion capture system, force plates embedded in walkway, EMG system, calibrated prosthesis/imbedded sensors. Procedure:
- Calibration: Perform static calibration with reflective markers placed on anatomical landmarks per Plug-in Gait model. Calibrate force plates to zero.
- Trial Collection: Participant walks at self-selected speed along a 10m walkway. Minimum of 5 successful trials per limb (clean force plate strikes).
- Data Processing: Filter marker trajectory (low-pass 6Hz) and ground reaction force data. Calculate stride length, cadence, stance/swing phase percentages, joint angles (sagittal, coronal, transverse planes), and joint moments/powers via inverse dynamics.
- Symmetry Analysis: Compute symmetry indices for key parameters (e.g., step length, peak knee moment). An index of 0% indicates perfect symmetry.
Protocol 3.2: Real-World Mobility Monitoring via Wearable Sensors
Objective: To assess community mobility and device use patterns in ecological settings. Materials: Inertial Measurement Unit (IMU) wearable (e.g., on ankle/thigh), data logger/Bluetooth transmitter, dedicated analysis software. Procedure:
- Sensor Deployment: Securely attach IMU to the prosthesis/limb proximal to the ankle. Initialize device to collect tri-axial acceleration and gyroscope data at ≥50Hz.
- Monitoring Period: Participant wears sensor for 7 consecutive days during waking hours, excluding water activities.
- Data Analysis: Algorithmically identify walking bouts from accelerometer data. Derive metrics: total daily steps, walking bout duration distribution, gait cycle variability, and estimated walking speed.
- Compliance & Reporting: Document daily wear time. Report aggregate weekly means and variability for all metrics.
Protocol 3.3: Administering the EQ-5D-5L for Health Utility
Objective: To derive a standardized, preference-based measure of health-related QoL for economic evaluation. Materials: Validated EQ-5D-5L paper or electronic form. Procedure:
- Administration: In a quiet setting, instruct the participant to complete the form independently, indicating their level of problems (1-5) in Mobility, Self-Care, Usual Activities, Pain/Discomfort, and Anxiety/Depression.
- Visual Analog Scale (VAS): Participant marks their overall health state on a 0-100 vertical scale.
- Scoring: Convert the 5-digit profile (e.g., 12345) to a single utility index score using the country-specific value set. Record the VAS score separately.
- Analysis: Calculate mean change from baseline to follow-up. A minimal clinically important difference (MCID) is often considered ~0.06-0.08 on the utility index.
Signaling Pathways & Workflow Visualizations
Title: Pathway from Device Deployment to Clinical Outcome
Title: Clinical Trial Workflow for Implant Studies
The Scientist's Toolkit: Research Reagent Solutions
Table 2: Essential Materials for Outcome Measurement Experiments
| Item | Function/Application | Example Product/Specification |
|---|---|---|
| Optoelectronic Motion Capture System | Tracks 3D position of reflective markers for kinematic analysis. | Vicon Nexus, 10+ camera system, sampling ≥100 Hz. |
| Portable Force Plate | Measures ground reaction forces and center of pressure for kinetics. | Bertec force plates, embedded in walkway, 1000 Hz. |
| Inertial Measurement Unit (IMU) | Captures real-world acceleration and angular velocity for mobility. | Opal by APDM, or Shimmer3, with Bluetooth streaming. |
| Surface Electromyography (EMG) System | Records muscle activation patterns post-implantation. | Delsys Trigno Wireless EMG System. |
| Digital Goniometer/Electrogoniometer | Measures joint range of motion accurately in clinical settings. | Rolyan Digital Goniometer. |
| Ossstell ISQ Meter | Quantifies implant stability via resonance frequency analysis (ISQ). | For dental and orthopedic osseointegrated implants. |
| Validated PRO Software Platform | Administers, scores, and manages patient-reported outcome measures. | REDCap (Electronic Data Capture) with PROMIS/EQ-5D libraries. |
| Gait Analysis Software Suite | Processes synchronized motion capture, force, and EMG data. | Visual3D (C-Motion Inc.) or similar biomechanics package. |
Application Notes
1.1. Context & Rationale Within biomedical engineering for prosthetics and implants, a persistent translational gap exists between proof-of-concept advanced designs and widespread, equitable clinical deployment. This analysis provides a framework for evaluating innovations—such as osseointegrated neural-interfacing limbs, closed-loop neuromodulation implants, or smart orthobiologics—against the dual imperatives of clinical efficacy/benefit and practical accessibility. The core challenge is to optimize the cost-benefit ratio without compromising safety or performance, ensuring solutions are viable within diverse global healthcare economies.
1.2. Key Quantitative Metrics for Analysis The following metrics must be quantified for any proposed advanced prosthetic/implant technology.
Table 1: Core Cost-Benefit & Accessibility Metrics
| Metric Category | Specific Parameter | Target/Threshold | Measurement Method |
|---|---|---|---|
| Clinical Benefit | Primary Endpoint Improvement (e.g., % improvement in ADL score) | ≥30% over standard-of-care | Controlled clinical trial (RCT) |
| 5-Year Implant Survival Rate | ≥90% | Long-term post-market surveillance | |
| Reduction in Secondary Complications (e.g., infection rate) | ≥50% reduction | Comparative cohort study | |
| Economic Cost | Unit Manufacturing Cost (Advanced vs. Standard) | ≤3x cost of standard | Activity-based costing analysis |
| Total Cost of Ownership (5 years, incl. revisions) | Within QALY threshold of health system | Health-economic modeling (e.g., $50k/QALY) | |
| Required Capital Investment for Production Scale-Up | <$10M for initial scale | Financial feasibility study | |
| Accessibility | Simplified Surgical Procedure Time | <20% increase over standard | Time-motion study in OR |
| Required Surgeon Training Specialization (new procedures) | ≤40 hours of training | Curriculum development & assessment | |
| Supply Chain Complexity (Unique components) | ≤15 unique suppliers | Supply chain audit | |
| Regulatory Pathway Clarity (FDA/EU MDR) | Clear Substantial Equivalence or De Novo path | Regulatory consultation analysis |
1.3. Integrated Decision Matrix A go/no-go decision for further development or deployment should be informed by a weighted scoring system applied to the data in Table 1, calibrated for the target healthcare setting (e.g., high-income vs. low- and middle-income country).
Experimental Protocols
2.1. Protocol: In Vivo Cost-Benefit Simulation for a Novel Osseointegrated Electrode Array
- Objective: To compare the long-term functional benefit and economic burden of a novel, high-density neural interface implant versus a standard intramuscular electrode system in a translational animal model.
- Materials: Pre-clinical ovine model (n=12 per group), novel electrode array implant, standard control implant, biomechanical gait analysis system, telemetric data acquisition system, histology suite.
- Procedure:
- Randomization & Implantation: Randomize subjects into Novel and Standard groups. Perform aseptic surgical implantation of respective devices under general anesthesia.
- Functional Benefit Quantification (Weeks 2, 12, 24, 52):
- Acquire high-fidelity electromyographic (EMG) and kinematic gait data during standardized locomotor tasks.
- Calculate signal-to-noise ratio (SNR), pattern recognition fidelity, and limb placement accuracy.
- Burden/Complication Monitoring (Continuous):
- Log all adverse events (infection, mechanical failure, inflammation).
- Document all required interventions (medication, revision surgery).
- Terminal Analysis (Week 52):
- Euthanize subjects humanely. Perform explant and extensive peri-implant histology (H&E, staining for fibrosis, neuronal density).
- Conduct failure analysis on explanted devices.
- Data Synthesis: Correlate functional data with histological outcomes. Assign cost units to each material, surgical procedure, and intervention. Generate a composite cost-benefit score: (Functional Benefit Index) / (Cumulative Cost Units + Complication Severity Score).
2.2. Protocol: Accelerated Life Testing (ALT) for Accessibility-Focused Implant Design
- Objective: To validate the durability of a simplified, cost-reduced implant design under simulated physiological loading conditions, ensuring it meets minimum performance standards over a projected 10-year service life.
- Materials: Prototype implant devices (n=6), multi-axis mechanical test system (e.g., Bose ElectroForce), saline bath at 37°C, periodic electrochemical impedance spectroscopy (EIS) setup.
- Procedure:
- Test Profile Definition: Define a simplified daily activity profile (e.g., 1 million cycles of axial load at 75% body weight, superimposed with 10,000 torsion cycles).
- Accelerated Testing: Subject devices to the defined profile in a 37°C saline environment. Test frequency is increased to complete 10 years of simulation in 6 weeks (acceleration factor calculated based on use-case modeling).
- Intermittent Performance Checks: Every 72 hours of test time, pause testing and perform EIS to monitor for insulation degradation or corrosion.
- Post-Test Analysis: Perform final EIS. Conduct visual and microscopic inspection (SEM) for cracks, wear, or corrosion. Compare mechanical and electrical performance against baseline and against a more complex, expensive benchmark device.
- Output: A pass/fail determination based on pre-defined degradation thresholds. The data supports the argument for a simplified, more accessible design if it passes.
Visualizations
The Scientist's Toolkit: Key Research Reagent Solutions
Table 2: Essential Materials for Prosthetic/Implant Cost-Benefit Research
| Reagent / Material | Provider (Example) | Primary Function in Analysis |
|---|---|---|
| Polyurethane Accelerated Test Bioreactor System | Bose ElectroForce / Instron | Simulates years of biomechanical loading and chemical environment exposure in weeks, crucial for ALT protocols. |
| Multi-Electrode Array (MEA) Neural Recording System | Blackrock Microsystems / Intan Technologies | Acquires high-density electrophysiological data to quantify functional benefit of neural interfaces in pre-clinical models. |
| Degradable Polymer Blends (e.g., PLGA, PCL) | Evonik, Corbion | Used to prototype and test temporary, drug-eluting, or simplified implant components that reduce long-term burden. |
| Standardized Biomarker Panels (IL-1β, IL-6, TNF-α, CRP) | MSD, R&D Systems | Quantifies the host inflammatory response to implants, a key variable in long-term benefit and complication cost. |
| 3D Bioprinting/Bioplotting System | CELLINK, Allevi | Enables rapid, cost-effective prototyping of patient-specific implant geometries for design optimization. |
| Finite Element Analysis (FEA) Software Suite | ANSYS, COMSOL | Models mechanical stress, electrical fields, and fluid flow to predict failure points and optimize design before fabrication. |
| Health Economic Modeling Software (e.g., TreeAge Pro) | TreeAge Software | Constructs decision-analytic models (Markov, microsimulation) to integrate clinical and cost data for CBA. |
Conclusion
The field of prosthetic and implant design stands at a transformative juncture, driven by convergence of advanced materials, digital manufacturing, and intelligent systems. Synthesis of the four intents reveals a clear trajectory: foundational biocompatibility remains paramount, but is now augmented by patient-specific, data-informed methodologies. Successful translation hinges on proactive troubleshooting of biological and mechanical interfaces and rigorous comparative validation. Future directions point towards truly adaptive, closed-loop bio-hybrid systems, democratized via point-of-care manufacturing, and validated through increasingly sophisticated in-silico trials. For researchers, the imperative is to pursue designs that not only restore lost function but also integrate seamlessly with the body's biological and cognitive systems, ultimately blurring the line between artificial device and native tissue.